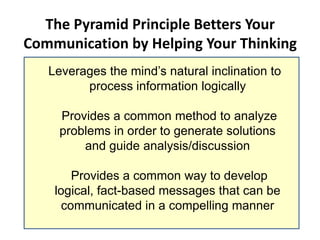
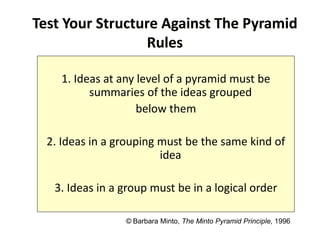
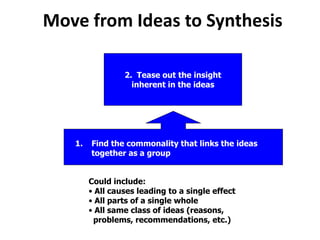
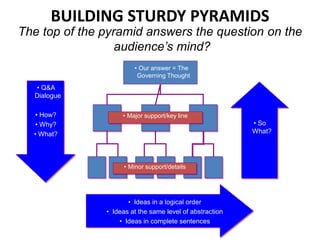
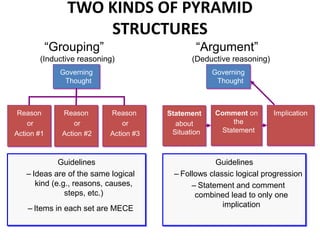
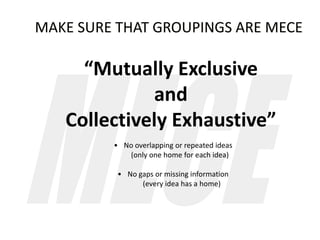
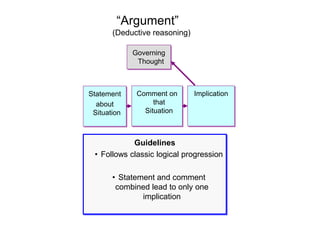
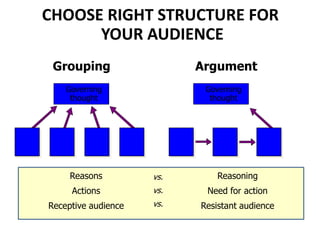
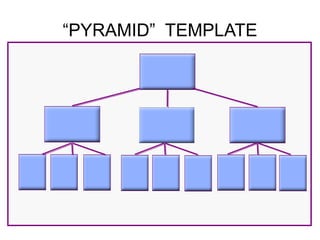
3. The Pyramid Principle Betters Your
Communication by Helping Your Thinking
Leverages the mind’s natural inclination to
process information logically
Provides a common method to analyze
problems in order to generate solutions
and guide analysis/discussion
Provides a common way to develop
logical, fact-based messages that can be
communicated in a compelling manner
5. Ideas Form A Pyramid Under One Main
Message
Main
Message
Key Line
Idea Idea Idea
Idea Idea Idea Idea Idea Idea Idea Idea
6. An Idea Is A Full Sentence That Presents
New Information
Organization
Our Approach
Scope
Seven Success Factors
Goals and Objectives
Strategy
Timeframe
Not Ideas (Lists/Labels)
A shared services model
is cost effective
We will follow an
accelerated approach
Limit the scope to avoid risk
Success will depend
on an integrated team
The objective is unclear
Microsoft’s strategy is
aggressive
Ideas (Not Lists/Labels)
. . . generating a
question in the
audience’s mind
8. Move from Ideas to Synthesis
1. Find the commonality that links the ideas
together as a group
Could include:
• All causes leading to a single effect
• All parts of a single whole
• All same class of ideas (reasons,
problems, recommendations, etc.)
2. Tease out the insight
inherent in the ideas
9. Don’t undermine impact by
building to an intellectually blank
synthesis/insight
Weak insight Better insight
The company has
two organization
problems
The major organization
problem is the inability
to delegate authority
There are three
reasons why post-
merger integration
will go smoothly
Post-merger integration
will go smoothly because
the organizations share
many characteristics
10. • So
What?
BUILDING STURDY PYRAMIDS
• Ideas in a logical order
• Ideas at the same level of abstraction
• Ideas in complete sentences
• Minor support/details
• Q&A
Dialogue
• How?
• Why?
• What?
• Major support/key line
• Our answer = The
Governing Thought
The top of the pyramid answers the question on the
audience’s mind?
12. TWO KINDS OF PYRAMID
STRUCTURES
Guidelines
– Ideas are of the same logical
kind (e.g., reasons, causes,
steps, etc.)
– Items in each set are MECE
“Grouping”
(Inductive reasoning)
Governing
Thought
Reason
or
Action #1
Reason
or
Action #2
Reason
or
Action #3
“Argument”
(Deductive reasoning)
Governing
Thought
Statement
about
Situation
Comment on
the
Statement
Implication
Guidelines
– Follows classic logical progression
– Statement and comment
combined lead to only one
implication
14. “Grouping” (Inductive Reasoning) Requires Skills In
Summarizing and Ordering Ideas
KEY QUESTIONS
• What belongs?
• What does not belong?
• What is the “So What?”(i.e., the higher
level of insight)?
WHAT’S REQUIRED TO GROUP?
15. MAKE SURE THAT GROUPINGS ARE MECE
“Mutually Exclusive
and
Collectively Exhaustive”
• No overlapping or repeated ideas
(only one home for each idea)
• No gaps or missing information
(every idea has a home)
18. CHOOSE RIGHT STRUCTURE FOR
YOUR AUDIENCE
Reasons
Actions
Receptive audience
vs.
vs.
vs.
Reasoning
Need for action
Resistant audience
Argument
Grouping
Governing
thought
Governing
thought
20. 0
100
200
300
400
500
Jan Feb Mar Apr May Jun Jul Aug
SALES 1998
US$ Millions
Sales are steadily increasing
Simplicity
and
consistency
in format
Content
and title
work
together
One clear
message
per chart
LEGIBLE!
“Less is
better”
Successful Charts Have Several Essential
Characteristics
21. Translating Data To The Appropriate
Chart Involves A Four-Step Process
2.
Determine
your message
3.
Identify the
comparison
4.
Determine
appropriate chart
form
1.
Analyze the
data
Gene Zelazny, Say It With Charts, 1996
22. Chart Forms Vary Based On The
Comparison Made By The Data
Gene Zelazny, Say It With Charts, 1996
COMPONENT
Percentage of total
(share, percentage of
total, accounted for)
ITEM
Ranking of items
(rank, larger than,
smaller than, equal)
TIME SERIES
Changes over time
(trend, change, grow,
rise, decline, increase,
decrease, fluctuate)
FREQUENCY
DISTRIBUTION
Items within numerical
ranges (x to y range,
concentration, frequency,
distribution)
CORRELATION
Relationship
between variables
(related to, increases
with, decreases with,
changes with, doesn’t
increase with)
23. COMPONENT
Percentage of total
(share, percentage of total, accounted for)
ITEM
Ranking of items
(rank, larger than, smaller than, equal)
TIME SERIES
Changes over time
(trend, change, grow, rise, decline,
increase, decrease, fluctuate)
FREQUENCY
DISTRIBUTION
Items within numerical
ranges (x to y range, concentration,
frequency, distribution)
CORRELATION
Relationship
between variables
(related to, increases with, decreases
with, changes with, doesn’t increase with)
Determine
your
message
Analyze
the data
From
Data
To
Chart Identify the
comparison
Determine the
most
appropriate
chart form
DOT
LINE
COLUMN
COMPONENT ITEM TIME SERIES FREQUENCY CORRELATION
BAR
PIE
CHART FORMS
COMPARISONS
Determine
your
message
Analyze
the data
Gene Zelazny, Say It With Charts, 1996