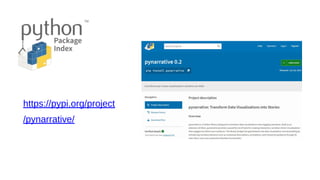
PyNarrative: A Python Library for Data Storytelling
PyNarrative is a Python library for data storytelling.
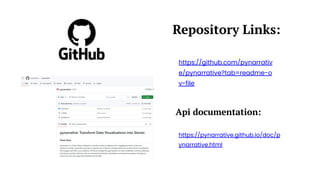
More details here:
https://github.com/pynarrative/pynarrative
Install PyNarrative as follows:
pip install pynarrative
PyNarrative: A Python Library for Data Storytelling
1.
PyNarrative: A PythonLibrary
for Data Storytelling
Angelica Lo Duca, Roberto Olinto Barsotti
2.
Introduction
PyNarrative is aPython library we created and developed to facilitate data
narration.
The central theme of the work is the integration of technology and
communication through data storytelling.
3.
There is abig gap between developers
and the communication of data, as
they often lack the necessary skills to
convey them clearly and effectively
4.
The current surveyof data visualisation libraries
includes:
State of the Art
for Python:
• Matplotlib: specializing in static and interactive graphs
• Seaborn: focused on statistical graphs
• Plotly: oriented towards web views
• Altair: characterised by a declarative approach
5.
For other languages:
Stateof the Art
• D3.js for JavaScript
• ggplot2 for R
• JFreeChart for Java
However, these libraries focus mainly on
visualisation, neglecting the narrative aspect.
6.
Data scientists facedifferent challenges:
The Problem
• Existing tools, although powerful, are complex
to use
• Dozens of lines of code are needed to
implement narrative elements
• Different applications are necessary
• Communication with a non-technical audience
is difficult
7.
To create asimple story using Altair requires
more than 100 lines of code, resulting in a
time-consuming technical set-up rather than
storytelling.
8.
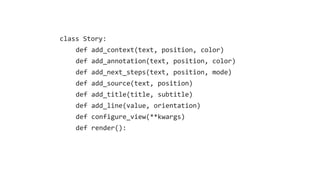
WHAT IS PYNARRATIVE?
PyNarrativeis a library designed to integrate narrative
elements seamlessly into data visualization.
Instead of writing too many lines of code to add explanations,
annotations, and context, PyNarrative simplifies this process
with structured storytelling components.
9.
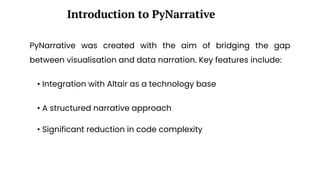
PyNarrative was createdwith the aim of bridging the gap
between visualisation and data narration. Key features include:
Introduction to PyNarrative
• Integration with Altair as a technology base
• A structured narrative approach
• Significant reduction in code complexity
10.
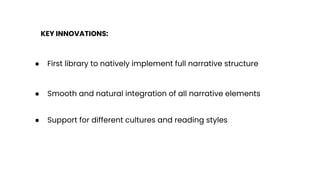
KEY INNOVATIONS:
● Firstlibrary to natively implement full narrative structure
● Smooth and natural integration of all narrative elements
● Support for different cultures and reading styles
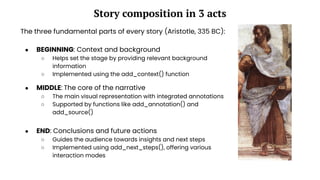
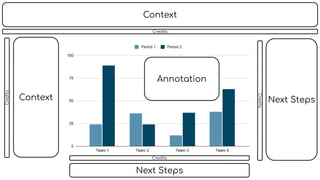
Story composition in3 acts
The three fundamental parts of every story (Aristotle, 335 BC):
● MIDDLE: The core of the narrative
○ The main visual representation with integrated annotations
○ Supported by functions like add_annotation() and
add_source()
● END: Conclusions and future actions
○ Guides the audience towards insights and next steps
○ Implemented using add_next_steps(), offering various
interaction modes
● BEGINNING: Context and background
○ Helps set the stage by providing relevant background
information
○ Implemented using the add_context() function
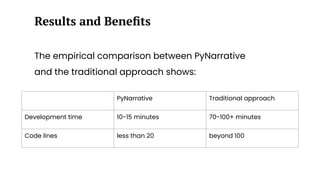
The empirical comparisonbetween PyNarrative
and the traditional approach shows:
Results and Benefits
PyNarrative Traditional approach
Development time 10-15 minutes 70-100+ minutes
Code lines less than 20 beyond 100