1. Sector update 2010 Q3
12 November 2010
Analyst: Einar Kilde Evensen
+47 2294 8232
einar.kilde.evensen@dnbnor.no
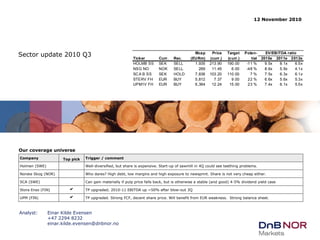
Company Top pick Trigger / comment
Holmen (SWE)
Norske Skog (NOR) Who dares? High debt, low margins and high exposure to newsprint. Share is not very cheap either.
SCA (SWE) Can gain materially if pulp price falls back, but is otherwise a stable (and good) 4-5% dividend yield case
b
b
Well-diversified, but share is expensive. Start-up of sawmill in 4Q could see teething problems.
TP upgraded; 2010-11 EBITDA up ~50% after blow-out 3Q
TP upgraded. Strong FCF, decent share price. Will benefit from EUR weakness. Strong balance sheet.
Stora Enso (FIN)
UPM (FIN)
Our coverage universe
Mcap Price Target Poten- EV/EBITDA ratio
Ticker Curr. Rec. (EURm) (curr.) (curr.) tial 2010e 2011e 2012e
HOLMB SS SEK SELL 1,935 213.90 190.00 -11 % 9.5x 8.1x 6.5x
NSG NO NOK SELL 269 11.45 6.00 -48 % 8.6x 5.9x 4.1x
SCA B SS SEK HOLD 7,836 103.20 110.00 7 % 7.5x 6.3x 6.1x
STERV FH EUR BUY 5,812 7.37 9.00 22 % 6.6x 5.6x 5.3x
UPM1V FH EUR BUY 6,364 12.24 15.00 23 % 7.4x 6.1x 5.5x
2. 2
Sector update
12 November 2010
PULP AND PAPER SECTOR
Paper 3Q 2010 update
What's new 2010 third quarter Pulp & Paper update
Holmen recommendation reduced to Sell (PT unchanged at SEK 190)
NSG reiterated at Sell, NOK 6.00
SCA reiterated at Hold, SEK 110.00
Stora Enso reiterated at Buy, with PT up to EUR 9.00 from EUR 7.00
UPM reiterated at Buy, with PT up to EUR 15.00 from EUR 13.00
Our assessment 1: Newsprint "bull story" of rising 2011 prices is over. It's all over.
The market already expects and has to a large extent discounted NP price
increases in Europe next year of 10%-15%.
European newsprint demand is in structural decline, implying deteriorating
market conditions for 2012 and forward
Investors should avoid NSG and also Holmen who have the highest exposure
to European newsprint (Holmen is also positively exposed to packaging).
Investment conclusion Pair trades recommended
Short Holmen: Trading near historically high multiples. Startup of new SEK 1.1bn
Braviken sawmill in 4Q may have teething problems
Short NSG (if possible): Bullish story on 2011 NP prices is discounted.
Long Stora Enso: Lowest EV/EBITDA multiple, best exposure (packaging)
Long UPM: Lowest EV/EBITDA multiple, strong balance sheet
2: Packaging is the place to be
Market is growing, but with stable prices. If the general economy and consumer
spending remain fair, packaging should be an attractive growth market.
3. 3
Sector update
12 November 2010
PULP AND PAPER SECTOR
3Q roundup: Publication paper disappointed; Pulp and packaging better
Sales EBIT
Company Reported vs DNM vs cons. Reported vs DNM vs cons.
Holmen
Holmen Paper 1,982 -4 % -3 % -129 6 % 10 % On par
Iggesund Paperboard 1,225 0 % 1 % 243 12 % 23 % Better
Holmen Timber 162 2 % - 8 -49 % n.a. Worse
Holmen Skog 1,281 8 % 7 % 212 21 % 27 % Better
Holmen Energi 419 9 % - 96 50 % n.a. Better
Norske Skog
Newsprint Europe 1,374 1 % - -174 -107 % -40 % Worse
Newsprint Ex-Europe 1,495 12 % - 153 220 % 3 % Better
Magazine 1,606 3 % - -90 n.m. -100 % Worse
SCA
Personal Care 6,125 -6 % -5 % 697 -7 % -5 % Worse
Tissue 9,924 -5 % -3 % 753 -14 % -6 % Worse
Packaging 7,392 1 % -2 % 512 47 % 20 % Better
Forest Products 4,415 3 % 2 % 685 -1 % -7 %
Publication Products 2,131 -1 % - -38 n.m. n.a. On par
Pulp, Timber & Wood 2,284 8 % - 723 8 % n.a. Better Better
Stora Enso
Newsprint and Book Paper 323 -0 % -0 % 0 n.m. n.m. On par
Magazine Paper 541 3 % -1 % 46 79 % 69 % Better
Fine Paper 563 7 % 5 % 71 38 % 16 % Better
Consumer Board 594 -2 % 3 % 78 -4 % 21 % On par
Industrial Packaging 225 -12 % -9 % 19 158 % 25 % Better
UPM
Energy 124 4 % 3 % 44 12 % 17 % Better
Pulp 489 10 % 8 % 199 38 % 24 % Better
Forest and Timber 387 5 % 7 % 68 107 % 331 % Better
Paper 1,672 7 % 2 % -64 -195 % -228 % Worse
Label 284 3 % 3 % 24 13 % 17 % Better
Better 2 of 8 3 of 4 2 of 4 2 of 2 3 of 4 2 of 2
On par 3 of 8 1 of 4 - - - -
Worse 3 of 8 - 2 of 4 - 1 of 4 -
* Note: ''On par'' if reported within +/- 5 % range of estimates
Wood &
forest Energy
Publ.
paper
Board &
pack.
Other
paper Pulp
Apart from SCA's
disappointments in
Personal Care and Tissue,
the main disappointments
came within Publication
paper
0
1
2
3
4
5
6
7
8
9
Publ.
paper
Board &
pack.
Other
paper
Pulp Wood &
forest
Worse
On par
Better
4. 4
Sector update
12 November 2010
PULP AND PAPER SECTOR
Agenda
Case: Newsprint
Other key considerations
Valuation
3Q updates and changes of estimates
Appendix
5. 5
Sector update
12 November 2010
PULP AND PAPER SECTOR
The subject of this update
The end of newsprint (as we know it)?
Newsprint is continuously losing advertising market share
Newsprint's key strengths
"Coffee table effect". Multiple readers per paper
Media choice #1 for baby boomers
Purchaser "owns" newspaper
Local
Portability
Newsprint's key weaknesses
Distribution
Heavily dependent upon advertising from real estate, employment
and autos
Declining circulation and subscription
7. 7
Sector update
12 November 2010
PULP AND PAPER SECTOR
An analogy to newspaper as media habits change: Blockbuster Inc.
Blockbuster Inc. facts
First store opened in Dallas,
TX, 1985
IPO in 1999, for USD 560m
5,000 stores in US (Jan 2010)
Peaks
Share price: April 2002, at USD
30 (Market cap: USD 5,300m)
Yearly revenues: 2004, at USD
6,053m
EBIT margin: 2003, at 8%
NIBD: 2005, at USD 882m
BUST
8. 8
Sector update
12 November 2010
PULP AND PAPER SECTOR
Blockbuster is now bust (no pun intended)
Blockbuster Inc filed for
Chapter 11 in September
2010
We believe newsprint is a structural
sunset industry, just like video rental
(with physical stores), and LPs, music
cassettes and CDs.
There will be niche markets, but market
demand is going to continue falling.
9. 9
Sector update
12 November 2010
PULP AND PAPER SECTOR
What's going on with New York Times?
Arthur Sulzberger Jr, CoB of NYT Co.
We will stop
printing the
New York Times
some time in
the future.
(Sept 2010)
Our print
product is alive
and well
(Sept 2010)
Janet Robinson, CEO of NYT
New York Times facts
Published since 1851
Has won 104 Pulitzer prizes,
more than any other media
Current circulation: 950', down
>10% from peak
First major newspaper to
launch iPod/iPhone application
in 2008
Third largest newspaper in US
after WSJ and USA Today
Question:
Will this newspaper bellwether
also be the first to stop printing
on paper?
10. 10
Sector update
12 November 2010
PULP AND PAPER SECTOR
Newsprint demand is falling – North America leads
US demand is now less
than half what it was in
2000.
-51%
-10%
11. 11
Sector update
12 November 2010
PULP AND PAPER SECTOR
Which are the companies most exposed to Newsprint?
Norske Skog most exposed
Newsprint: >50% of revenue (but ~50/50 split Europe vs ex-Europe)
Magazine: ~40% (all in Europe, and ~50/50 split SC/LWC)
Holmen
Significant SC exposure
Note: Magazine grades: SC = ''Un-coated''; LWC = ''Light-weight''; CWF = ''Heavy''
Implicit revenue exposure to paper grades
-
10%
20%
30%
40%
50%
60%
Un-coated Light-weight Heavy
Newsprint Magazine Office paper
Holmen NSG SCA Stora Enso UPM
13. 13
Sector update
12 November 2010
PULP AND PAPER SECTOR
0
20
40
60
80
100
120
140
160
180
02.01.2007
02.04.2007
02.07.2007
02.10.2007
02.01.2008
02.04.2008
02.07.2008
02.10.2008
02.01.2009
02.04.2009
02.07.2009
02.10.2009
02.01.2010
02.04.2010
02.07.2010
02.10.2010
EUR/tonne
OCC
ONP/OMG
But lower RP prices are a positive trigger
Recovered paper prices
-€20?
-€40?
-€60?
-€80??
NSG's 2011 EBITDA to
gain 12% if RP price falls
by EUR 20/tonne (year
average).
We currently do not
model major shifts in the
RP price, which to a large
extent is pulled by strong
demand from China/Asia
Implications from EUR -20/tonne lower RP price:
Exposure: NP RP Chg. cost Revenue Impact EBITDA EBITDA
Long (short) prod. exposure @ €-20/t 2011e (margin 2011e gain
Company (kt/year) (kt/year) (EUR m) (EUR m) impr.) (EUR m)
Holmen 825 -750 -15 1,833 0.8 % 304 5 %
NSG 2,945 -1,300 -26 2,336 1.1 % 213 12 %
SCA 375 -3,800 -76 11,800 0.6 % 1,867 4 %
Stora Enso 2,650 -2,400 -48 10,197 0.5 % 1,451 3 %
UPM 2,090 -3,000 -60 8,900 0.7 % 1,572 4 %
14. 14
Sector update
12 November 2010
PULP AND PAPER SECTOR
Agenda
Case: Newsprint
Other key considerations
Valuation
3Q updates and changes of estimates
Appendix
17. 17
Sector update
12 November 2010
PULP AND PAPER SECTOR
Per end-3Q 2010
EURm Undrawn Funds* / Maturities Average
Company Cash facilites debts 2010e 2011e 2012e Later maturity
Holmen 12 792 117 % 210 63 44 368 2.4
Norske Skog 552 - 33 % 12 266 483 896 5.1
SCA - 3,306 77 % 1,007 972 175 2,155 2.8
Stora Enso 1,121 1,400 69 % 190 650 140 2,700 5.6
UPM 484 1,200 44 % 180 400 1,030 2,180 5.4
Exchange rates used: EURSEK 9.295, EURNOK 8.078
Assuming even spread of maturities over each calendar year
* Cash + undrawn facilities
Maturities: Holmen and SCA have the most solid balances; Stora Enso
and UPM the longest maturities
x
!b
Best:
• Holmen, Stora Enso
Worst:
• Norske Skog – critical
for 2012
x
18. 18
Sector update
12 November 2010
PULP AND PAPER SECTOR
Pulp price seems to have peaked, at 66% over the trough in April 2009
Lower pulp price will help
Norske Skog through
lower costs on magazine
paper production (not
newsprint).
NBSK Europe is down 2%
from the peak in July
2010, which was 7%
above the previous peak
in June 2008
Pulp markets remain
tight due to the absence
of shipments from Chile
and Indonesia as well as
the gradual improvement
in paper demand and
production in Europe
Stora Enso and UPM are
net producers of pulp,
while the rest are net
buyers, SCA being the
largest
0
200
400
600
800
1,000
1,200
03.12.1996
03.12.1997
03.12.1998
03.12.1999
03.12.2000
03.12.2001
03.12.2002
03.12.2003
03.12.2004
03.12.2005
03.12.2006
03.12.2007
03.12.2008
03.12.2009
USD/tonne
-
10
20
30
40
50
60
days
Inventories (right)
NBSK US
NBSK Europe
19. 19
Sector update
12 November 2010
PULP AND PAPER SECTOR
NP prices are higher in US than in Europe by a margin of 7%
It costs EUR 40-50/tonne
to ship newsprint across
the Atlantic
Jan-Apr 2010 European
shipments are up 4% YoY
Announced NP closures in
Europe for 2010 amount
to 295kt or ~2.3% of
total capacity (~13mt),
while demand is up 4.1%
YoY first nine months.
Lower recovered paper
prices (ONP/OMG) will
help P&Ls (9% of NSG's
costs are RP!)
European shipments YTD
-800
-600
-400
-200
0
200
400
600
1 2 3 4 1 2 3 4 1 2 3 4 1 2 3 4 1 2 3 4 1 2 3 4
2006 2007 2008 2009 2010 2011
'000tonnes(yearlycapacity)
Volga JSC
UPM
Stora Enso
Solikamsky Pulp & Paper JSC
SCA
Perlen Papier
Papierfabrik Palm
Papeteries de Turckheim
Osnova
Norske Skog Industries
Matussière & Forest
Investlesprom Group
Holmen
Fabryka Papieru Myszków
Burgo Group
Belarus Government
AbitibiBowater
Category Graphic Grade NEWS Region Europe
Sum_Change
Year Q
Parent
European capacity closures 2006-2010
200
300
400
500
600
700
800
06-2001
12-2001
06-2002
12-2002
06-2003
12-2003
06-2004
12-2004
06-2005
12-2005
06-2006
12-2006
06-2007
12-2007
06-2008
12-2008
06-2009
12-2009
06-2010
EUR/tonne
300
350
400
450
500
550
600
650
700
750
800
USD/tonne
NP Europe (EUR)
NP N.Am (EUR)
NP N.Am (USD)
Diff: EUR 31 / ton
(7%)
-8,000
-4,000
0
4,000
8,000
12,000
jmmjsnjmmjsnjmmjsnjmmjsnjmmjsnjmmjsnjmmjsnjmmjs
2003 2004 2005 2006 2007 2008 20092010
'000tonnes
-20 %
-10 %
0 %
10 %
20 %
30 %
growth
YTD Shipments
Acc. YoY Growth
20. 20
Sector update
12 November 2010
PULP AND PAPER SECTOR
-300
-200
-100
0
100
200
300
400
500
1 2 3 4 1 2 3 4 1 2 3 4 1 2 3 4 1 2 3 4
2006 2007 2008 2009 2010
'000tonnes(yearlycapacity)
Vertaris
UPM
Stora Enso
Saber Paper
Papierfabrik Golzern
Papierfabrik am Neckar
Papeteries des Deux-Guiers
Papeteries des Alpes
Norske Skog Industries
Myllykoski
Matussière & Forest
JIP-Papirny
Holmen
Cartiere Paolo Pigna
Burgo Group
Arctic Paper
Category Graphic Grade UM Region Europe
Sum_Change
Year Q
Parent
-800
-700
-600
-500
-400
-300
-200
-100
0
100
200
1 2 3 4 1 2 3 4 1 2 3 4 1 2 3 4 1 2 3 4
2006 2007 2008 2009 2010
'000tonnes(yearlycapacity)
UPM
Stora Enso
Sappi Limited
Perlen Papier
Papierfabrik am Neckar
Myllykoski
Matussière & Forest
Kübler & Niethammer
Investlesprom Group
Holmen
Burgo Group
Category Graphic Grade CM Region Europe
Sum_Change
Year Q
Parent
Magazine paper: Picking up … slowly
Jan-Sept 2010 shipments
• SC: +2.0% YoY
• CM: +8.7% YoY
• CWF: +12.1% YoY
Announced 2010 capacity
growth:
• UM: -1.2% of cap.
• CM: +0.3% of cap.
• CWF: none
Largest exposures:
• UM: Holmen, NSG
• CM: NSG, UPM
• CWF: STERV, UPM
European UM capacity closures 2006-2010 European CM capacity closures 2006-2010
400
500
600
700
800
900
1,000
06-2001
11-2001
04-2002
09-2002
02-2003
07-2003
12-2003
05-2004
10-2004
03-2005
08-2005
01-2006
06-2006
11-2006
04-2007
09-2007
02-2008
07-2008
12-2008
05-2009
10-2009
03-2010
08-2010
EUR/tonne
CWF (heavy, coated mag. paper)
LWC (lightweight coated mag. paper)
21. 21
Sector update
12 November 2010
PULP AND PAPER SECTOR
Packaging prices – peaking out already??
Largest exposures:
• Liner: SCA
• Fluting: only minor
• FBB: STERV, Holmen
0
100
200
300
400
500
600
700
13.01.2004
13.06.2004
13.11.2004
13.04.2005
13.09.2005
13.02.2006
13.07.2006
13.12.2006
13.05.2007
13.10.2007
13.03.2008
13.08.2008
13.01.2009
13.06.2009
13.11.2009
13.04.2010
13.09.2010
EUR/tonne
Testliner P
Kraftliner
RB fluting
22. 22
Sector update
12 November 2010
PULP AND PAPER SECTOR
Agenda
Case: Newsprint
Other key considerations
Valuation
3Q updates and changes of estimates
Appendix
23. 23
Sector update
12 November 2010
PULP AND PAPER SECTOR
STERV and UPM have the lowest EV/EBITDAs in the group*, and are also
the cheapest vs own history
Holmen vs rebased peers from jan 1999
Rebased to price per 15.01.1999
#REF!
2.0x
3.0x
4.0x
5.0x
6.0x
7.0x
8.0x
9.0x
10.0x
11.0x
jan99
jul99
jan00
jul00
jan01
jul01
jan02
jul02
jan03
jul03
jan04
jul04
jan05
jul05
jan06
jul06
jan07
jul07
jan08
jul08
jan09
jul09
jan10
jul10
EV/EBITDA
Holmen Norske Skog SCA Stora Enso UPM
EV/EBITDA observation summary
Last, Average
Company 10.11.10 2 year 5 year
Holmen 7.5x 8.3x 7.9x
Norske Skog 5.7x 6.2x 6.4x
SCA 6.1x 6.4x 6.6x
Stora Enso 5.9x 7.3x 6.9x
UPM 5.9x 6.7x 6.8x
Median 5.9x 6.7x 6.8x
Last vs average
Company 2 year 5 year
Holmen 91 % 95 %
Norske Skog 93 % 89 %
SCA 95 % 92 %
Stora Enso 81 % 86 %
UPM 87 % 86 %
Median 91 % 89 %
* Except Norske Skog
27. 27
Sector update
12 November 2010
PULP AND PAPER SECTOR
Agenda
Case: Newsprint
Key considerations
Valuation
3Q updates and changes of estimates
Appendix
28. 28
Sector update
12 November 2010
PULP AND PAPER SECTOR
Changes to estimates and recommendations
Main changes
• Norske Skog PT down
from NOK 8 to NOK 7
• Stora Enso PT down
from EUR 5.00 to EUR
4.60, recommendation
changed from Sell to
Hold
Revenue
(million) New estimates Old estimates Change
Company Curr. 2010 2011 2012 2010 2011 2012 2010 2011 2012
Holmen SEK 17,067 18,067 18,894 17,200 18,317 19,199 -133 -250 -305
Norske Skog NOK 18,848 19,493 19,884 18,382 18,491 18,777 466 1,002 1,107
SCA NOK 109,891 113,489 115,217 110,993 114,207 115,984 -1,102 -718 -767
Stora Enso € 10,211 9,703 9,618 9,106 8,647 8,536 1,105 1,056 1,081
UPM € 8,900 8,904 8,923 8,791 8,766 8,787 109 138 136
EBITDA
(million) New estimates Old estimates Change
Company Curr. 2010 2011 2012 2010 2011 2012 2010 2011 2012
Holmen SEK 2,516 2,830 3,283 2,395 2,825 3,146 121 5 137
Norske Skog NOK 1,295 1,716 2,141 1,461 1,801 2,227 -166 -85 -86
SCA SEK 15,926 17,385 17,422 15,330 17,119 17,226 595 266 195
Stora Enso € 1,256 1,392 1,400 808 992 980 447 400 420
UPM € 1,411 1,572 1,587 1,268 1,357 1,792 143 215 -205
EPS adj.
New estimates Old estimates Change
Company Curr. 2010 2011 2012 2010 2011 2012 2010 2011 2012
Holmen SEK 8.42 11.50 15.98 7.58 11.28 14.66 0.84 0.22 1.32
Norske Skog NOK -3.21 -3.53 1.50 -2.54 -2.99 1.86 -0.67 -0.54 -0.36
SCA SEK 9.16 10.11 9.45 8.19 9.48 9.17 0.97 0.63 0.28
Stora Enso € 0.81 0.76 0.79 0.37 0.40 0.40 0.44 0.36 0.39
UPM € 0.85 1.01 1.08 0.70 0.81 1.34 0.15 0.20 -0.26
Recommendation changes
New Old Change
Company Rec. PT Rec. PT Rec. PT
Holmen SELL 190 HOLD 185 Downgrade + 5.00
Norske Skog SELL 6.00 SELL 6.00 - -
SCA HOLD 110 BUY 110 Downgrade -
Stora Enso BUY 9.00 BUY 7.00 - + 2.00
UPM BUY 15.00 BUY 13.00 - + 2.00
34. 34
Sector update
12 November 2010
PULP AND PAPER SECTOR
Agenda
Case: Newsprint
Key considerations
Valuation
3Q updates and changes of estimates
Appendix
35. 35
Sector update
12 November 2010
PULP AND PAPER SECTOR
P/B: Except NSG, the shares trade very close around 0.90-1.05x
Holmen vs rebased peers from nov 1994
Rebased to price per 18.11.1994
#REF!
-
0.25x
0.50x
0.75x
1.00x
1.25x
1.50x
1.75x
2.00x
nov94
nov95
nov96
nov97
nov98
nov99
nov00
nov01
nov02
nov03
nov04
nov05
nov06
nov07
nov08
nov09
P/B
Holmen Norske Skog SCA Stora Enso UPM
Average
Company
Last,
10.11.10 1 year
nov 94 -
nov 10
Holmen 1.05x 0.98x 1.17x
Norske Skog 0.24x 0.18x 0.77x
SCA 0.98x 0.97x 1.17x
Stora Enso 0.99x 0.88x 1.05x
UPM 0.90x 0.81x 1.10x
Average 0.83x 0.76x 1.05x
Last vs average
Company 1 year
nov 94 -
nov 10
Holmen 107 % 90 %
Norske Skog 134 % 31 %
SCA 101 % 84 %
Stora Enso 114 % 95 %
UPM 111 % 81 %
Average 113 % 76 %
36. 36
Sector update
12 November 2010
PULP AND PAPER SECTOR
5-yr CDS: NSG still considered most risky
0
200
400
600
800
1,000
1,200
1,400
1,600
12-2006
03-2007
06-2007
09-2007
12-2007
03-2008
06-2008
09-2008
12-2008
03-2009
06-2009
09-2009
12-2009
03-2010
06-2010
09-2010
basispoints
NSG
Stora Enso
UPM
SCA
M-real
Last, Average
Comp. 05.11.10 1 yr 5 yr
M-real 451 733 1,129
NSG 790 1,065 712
SCA 72 84 86
STERV 257 321 250
UPM 257 280 209
37. 37
Sector update
12 November 2010
PULP AND PAPER SECTOR
DISCLAIMER AND STATEMENT THAT AFFECTS YOUR RIGHTS
This report must be seen as marketing material unless the criteria for preparing investment research, according to the Norwegian Securities Trading Regulation 2007/06/29 no. 876, are met.
This report has been prepared by DnB NOR Markets, a division of DnB NOR Bank ASA. The report is based on information obtained from public sources that DnB NOR Markets believes to be
reliable but which DnB NOR Markets has not independently verified, and DnB NOR Markets makes no guarantee, representation or warranty as to its accuracy or completeness. Any opinions
expressed herein reflect DnB NOR Markets’ judgment at the time the report was prepared and are subject to change without notice. Confidentiality rules and internal rules restrict the exchange
of information between different parts of DnB NOR Markets/DnB NOR Bank ASA and this may prevent employees of DnB NOR Markets who are preparing this report from utilizing or being
aware of information available in DnB NOR Markets/DnB NOR Bank ASA which may be relevant to the recipients’ decisions. This report is not an offer to buy or sell any security or other
financial instrument or to participate in any investment strategy. No liability whatsoever is accepted for any direct or indirect (including consequential) loss or expense arising from the use of
this report. Distribution of research reports is in certain jurisdictions restricted by law. Persons in possession of this report should seek further guidance regarding such restrictions before
distributing this report. Please contact DnB NOR Markets at +47 22 94 82 72 for further information and inquiries regarding this report, such as ownership positions and publicly
available/commonly known corporate advisory performed by DnB NOR Markets etc, in relation to the Norwegian Securities Trading Act 2007/06/29 no. 75 and the Norwegian Securities Trading
Regulation 2007/06/29 no. 876. This report is for clients only, and not for publication, and has been prepared for information purposes only by DnB NOR Markets - a division of DnB NOR Bank
ASA registered in Norway number NO 984 851 006 (the Register of Business Enterprises) under supervision of the Financial Supervisory Authority of Norway (Finanstilsynet), Monetary
Authority of Singapore, and on a limited basis by the Financial Services Authority of UK. Information about DnB NOR Markets can be found at dnbnor.no.
Additional information for clients in Singapore: This report has been distributed by the Singapore branch of DnB NOR Bank ASA. It is intended for general circulation and does not take
into account the specific investment objectives, financial situation or particular needs of any particular person. You should seek advice from a financial adviser regarding the suitability of any
product referred to in this report, taking into account your specific financial objectives, financial situation or particular needs before making a commitment to purchase any such product.
Recipients of this report should note that, by virtue of their status as “accredited investors” or “expert investors”, the Singapore branch of DnB NOR Bank ASA will be exempt from complying
with certain compliance requirements under the Financial Advisers Act, Chapter 110 of Singapore (the “FAA”), the Financial Advisers Regulations and associated regulations there under. In
particular, it will be exempt from: - Section 27 of the FAA (which requires that there must be a reasonable basis for recom-mendations when making recommendations on investments). Please
contact the Singapore branch of DnB NOR Bank ASA at +65 6212 0753 in respect of any matters arising from, or in connection with, this report. We, the DnB NOR Group, our associates,
officers and/or employees may have interests in any products referred to in this report by acting in various roles including as distributor, holder of principal positions, adviser or lender. We, the
DnB NOR Group, our associates, officers and/or employees may receive fees, brokerage or commissions for acting in those capacities. In addition, we, the DnB NOR Group, our associates,
officers and/or employees may buy or sell products as principal or agent and may effect transactions which are not consistent with the information set out in this report. In the United
States: Each research analyst named on the front page of this research report, or at the beginning of any subsection hereof, hereby certifies that (i) the views expressed in this report
accurately reflect that research analyst’s personal views about the company and the securities that are the subject of this report; and (ii) no part of the research analyst’s compensation was,
is, or will be, directly or indirectly, related to the specific recommendations or views expressed by that research analyst in this report. This report is being furnished upon request and is
primarily intended for distribution to “Major U.S. Institutional Investors” within the meaning of Rule 15a-6 of the U.S. Securities and Exchange Commission under the Securities Exchange Act of
1934. To the extent that this report is being furnished, or will be disseminated, to non-Major U.S. Institutional Investors, such distribution is being made by DnB NOR Markets, Inc., a
separately incorporated subsidiary of DnB NOR that is a U.S. broker-dealer and a member of the Financial Industry Regulatory Authority and the Securities Investor Protection Corporation.
Any U.S. recipient of this report seeking to obtain additional information or to effect any transaction in any security discussed herein or any related instrument or investment should call or write
DnB NOR Markets, Inc., 200 Park Avenue, New York, NY 10166-0396, telephone number 212-681-3800 or fax 212-681-4119. In Canada: This email, and any materials attached with it, has
been distributed in reliance on the International Dealer Exemption pursuant to NI 31-103 subsection 8.18(2) and subsection 8.18(4)(b). Please be advised that: 1. DnB Nor Bank ASA (DnB
NOR Markets) and DnB NOR Markets, Inc. are not registered in Canada. 2. DnB Nor Bank ASA (DnB NOR Markets) and DnB NOR Markets, Inc's jurisdiction of residence is Norway and the
United States, respectively. 3. The name and address of the agent for service of process for DnB Nor Bank ASA (DnB NOR Markets) and DnB NOR Markets, Inc. in the local jurisdiction is:
Alberta: Blake, Cassels & Graydon LLP, Attention: Pat Finnerty/Ross Bentley, 855 – 2nd Street S.W., Suite 3500, Bankers Hall East Tower, Calgary, AB T2P 4J8. British Columbia: Blakes
Vancouver Services, Inc., 595 Burrard Street, P.O. Box 49314, Suite 2600, Three Bentall Centre, Vancouver, BC V7X 1L3. Labrador: Stewart McKelvey, Cabot Place, 100 New Gower Street,
Suite 1100, P.O. Box 5038, St. John’s, NL A1C 5V3. Manitoba: Aikins, MacAulay & Thorvaldson LLP, 30th Floor, Commodity Exchange Tower, 360 Main Street, Winnipeg, MB R3C 4G1.
Newfoundland: Stewart McKelvey, Cabot Place, 100 New Gower Street, Suite 1100, P.O. Box 5038, St. John’s, NL A1C 5V3. New Brunswick: Stewart McKelvey, 10th Floor, Brunswick House,
44 Chipman Hill, Saint John, NB E2L 4S6. Nova Scotia: Stewart McKelvey, Purdy’s Wharf Tower One, 1959 Upper Water Street, Suite 900, P.O. Box 997, Halifax, NS B3J 2X2. Ontario:
Blakes Extra-Provincial Services Inc., Suite 2800, 199 Bay Street, Toronto, Ontario M5L 1A9. Prince Edward Island: Stewart McKelvey, 65 Grafton Street, Box 2140, Charlottetown, PE C1A
8B9. Quebec: Services Blakes Quebec Inc., 600 de Maisonneuve Boulevard Ouest, Suite 2200, Tour KPMG, Montreal, QC H3A 3J2. Saskatchewan: MacPherson, Leslie & Tyerman LLP, 1500
Continental Bank Building, 1874 Scarth Street, Regina, SK S4P 4E9. Northwest Territories: Gerald Stang, Suite 201, 5120-49 Street, Yellowknife, NT X1A 1P8. Yukon: Grant Macdonald,
Macdonald & Company, Suite 200, Financial Plaza, 204 Lambert Street, Whitehorse, YK Y1A 3T2. Nunavut: Terry Gray, P.O. Box 1779, Building 1088C, Iqaluit, NU X0A0H0. 4. There may be
difficulty enforcing legal rights against DnB NOR Bank ASA (DnB NOR Markets) and DnB NOR Markets, Inc. because each is a resident outside of Canada and all or substantially all of their
assets may be situated outside of Canada.