Download as PDF, PPTX

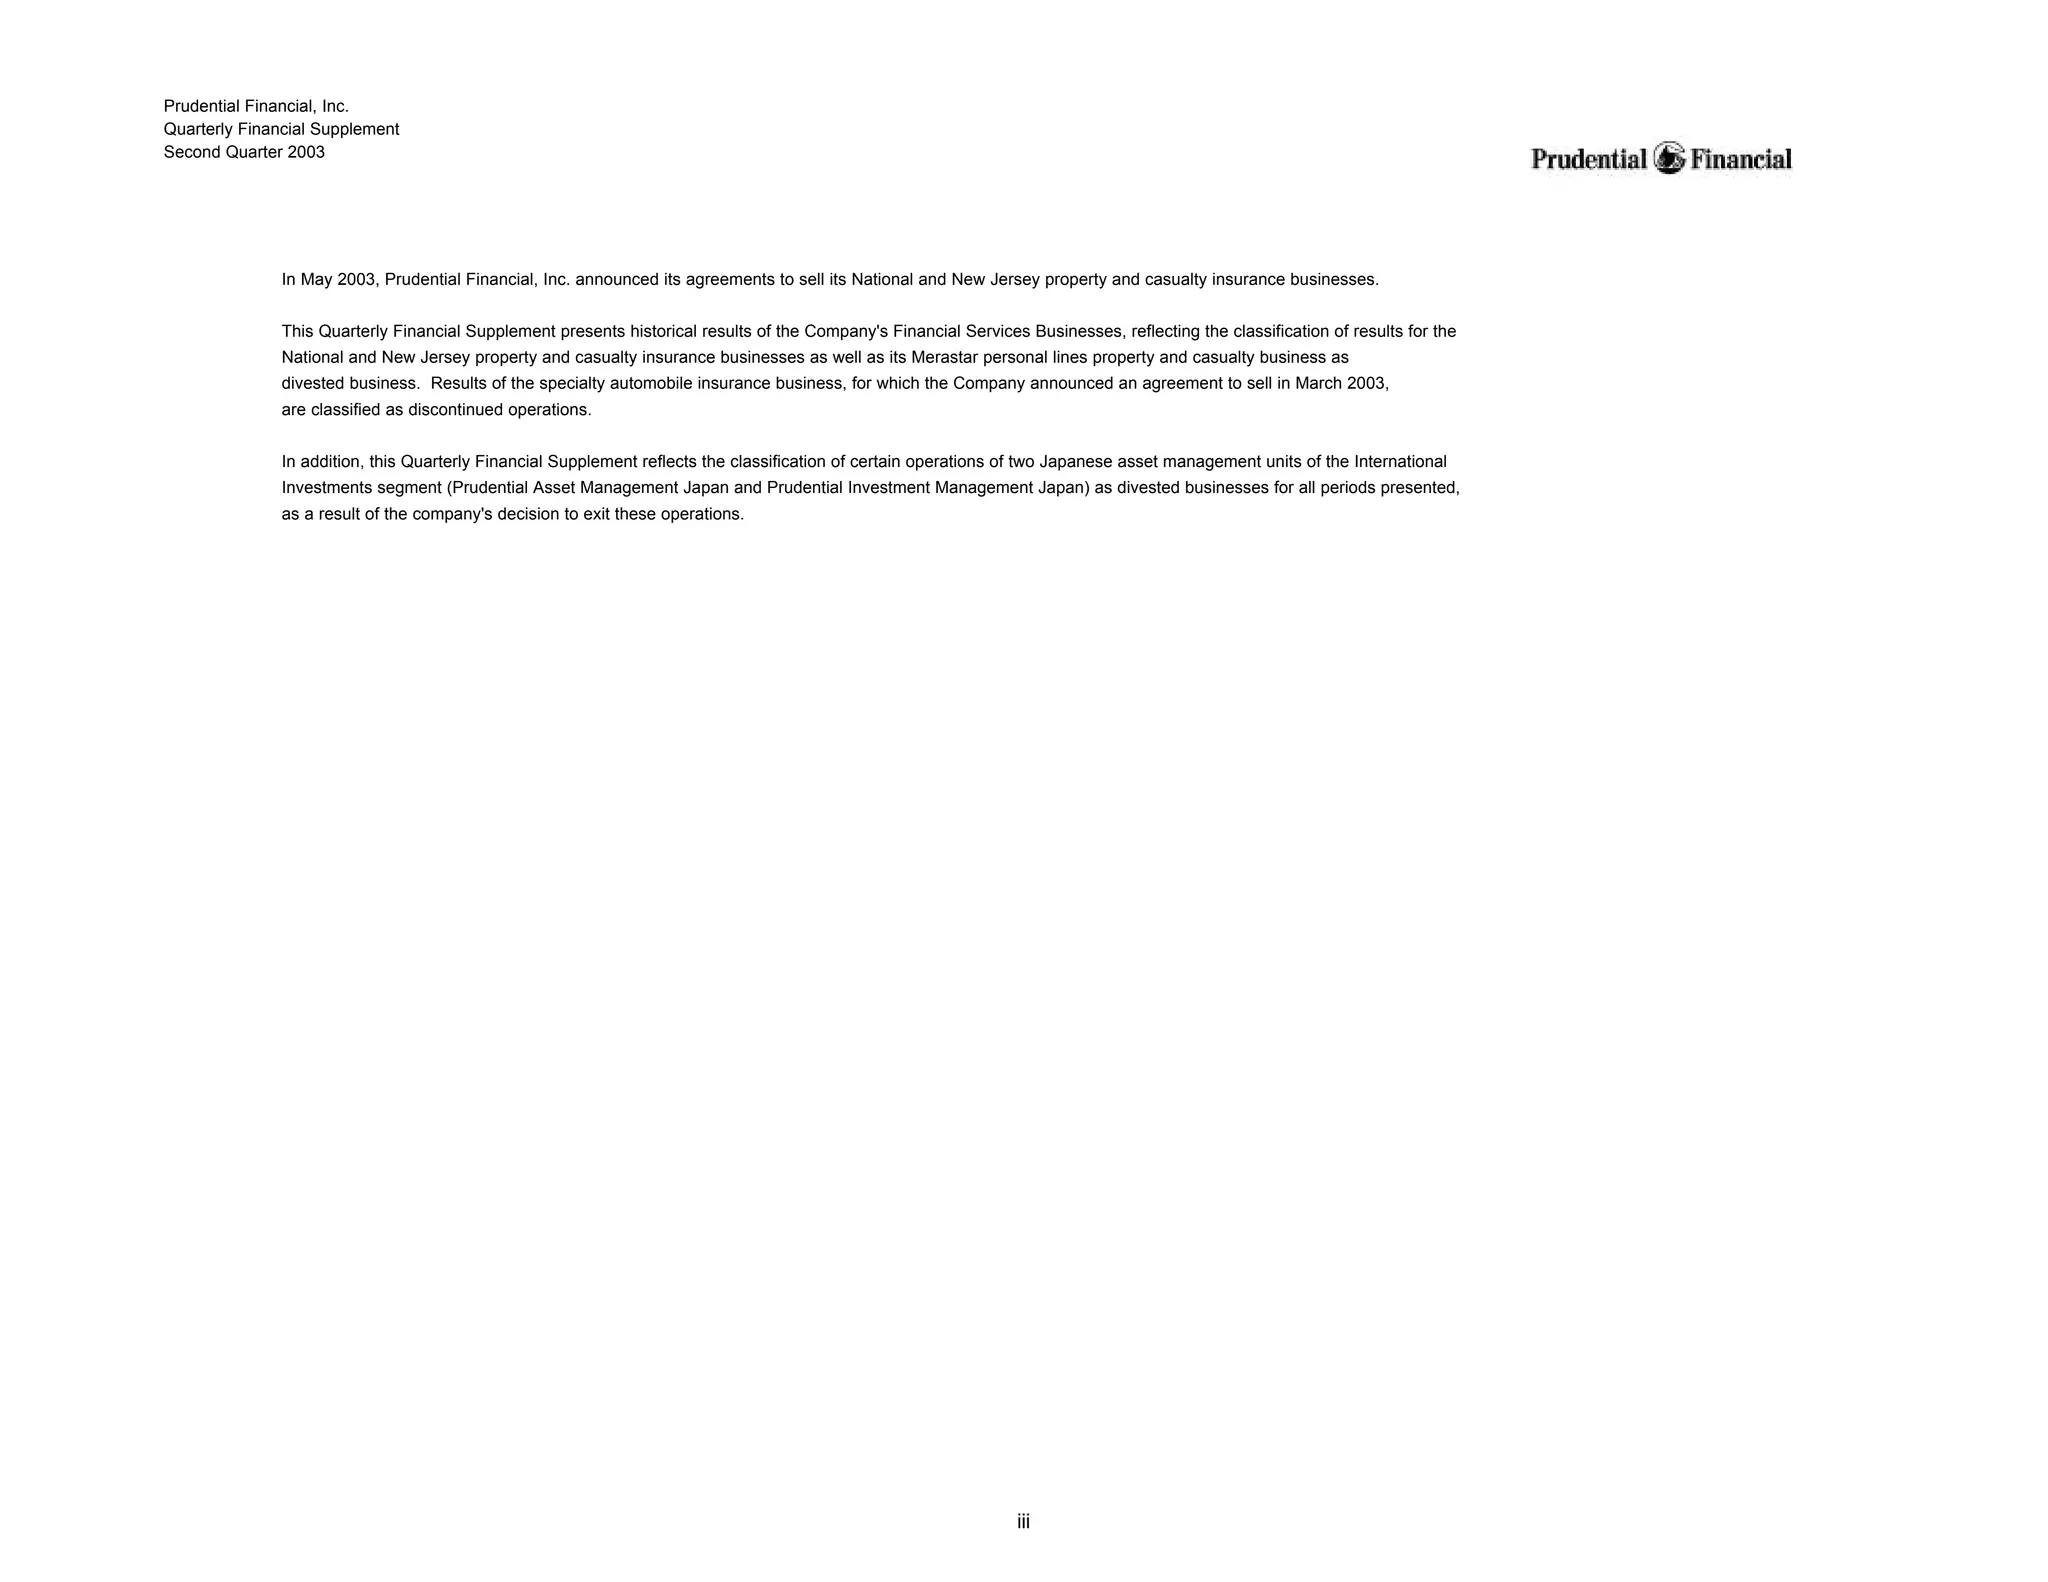


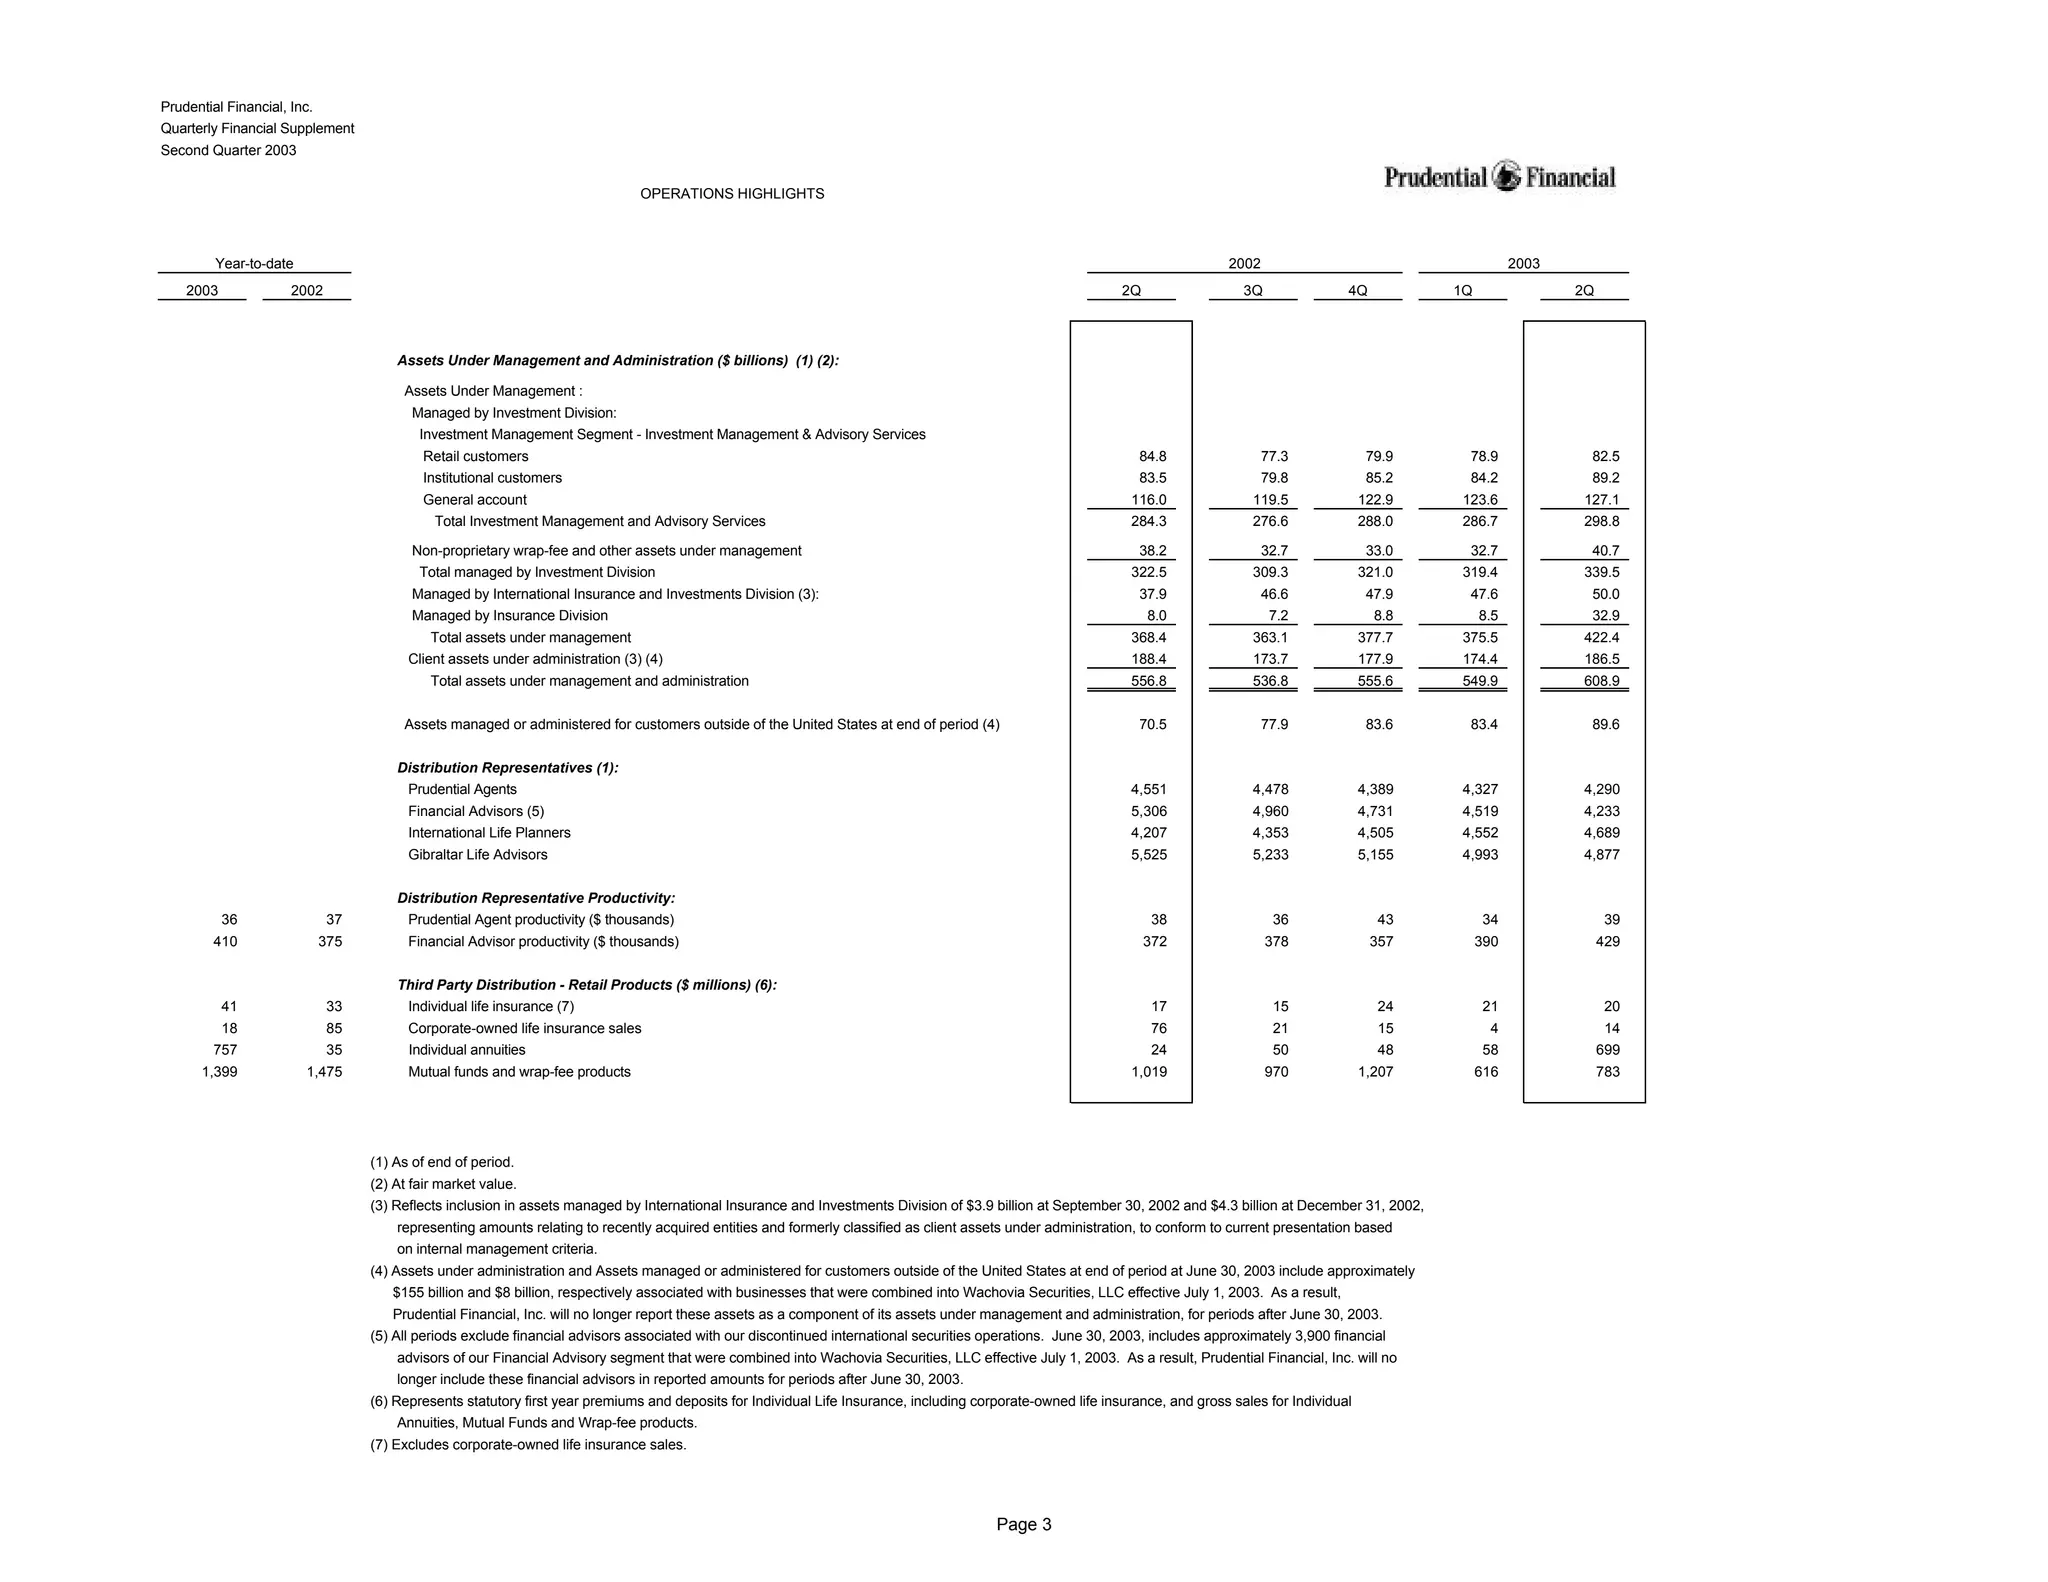
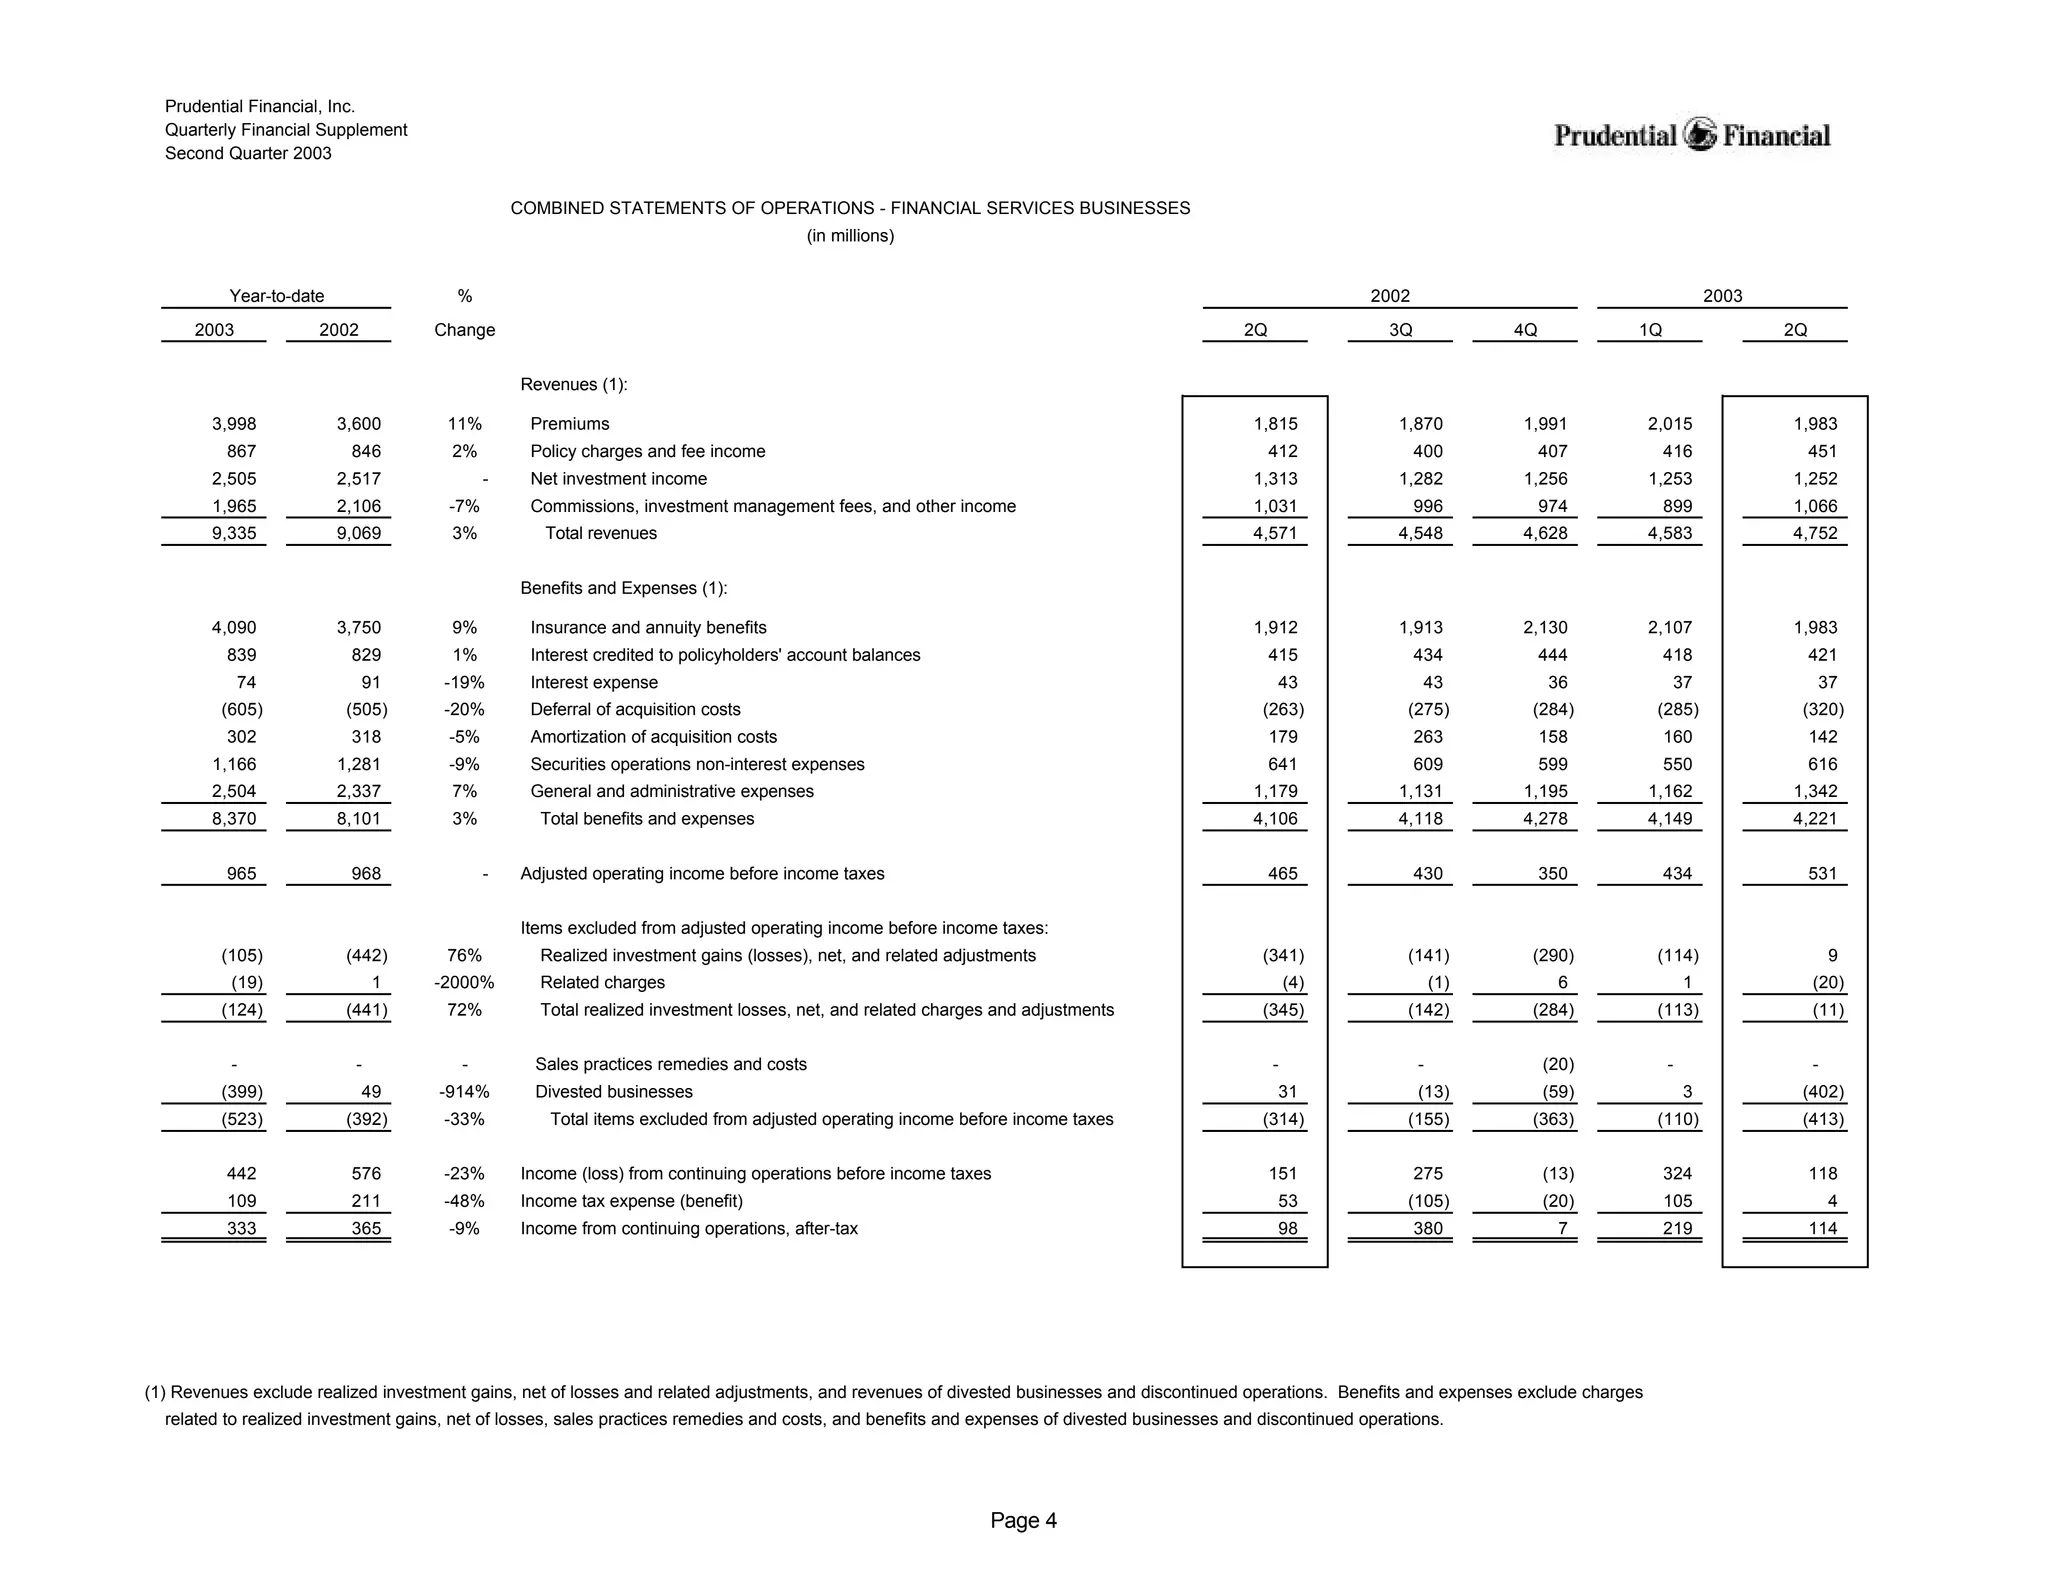


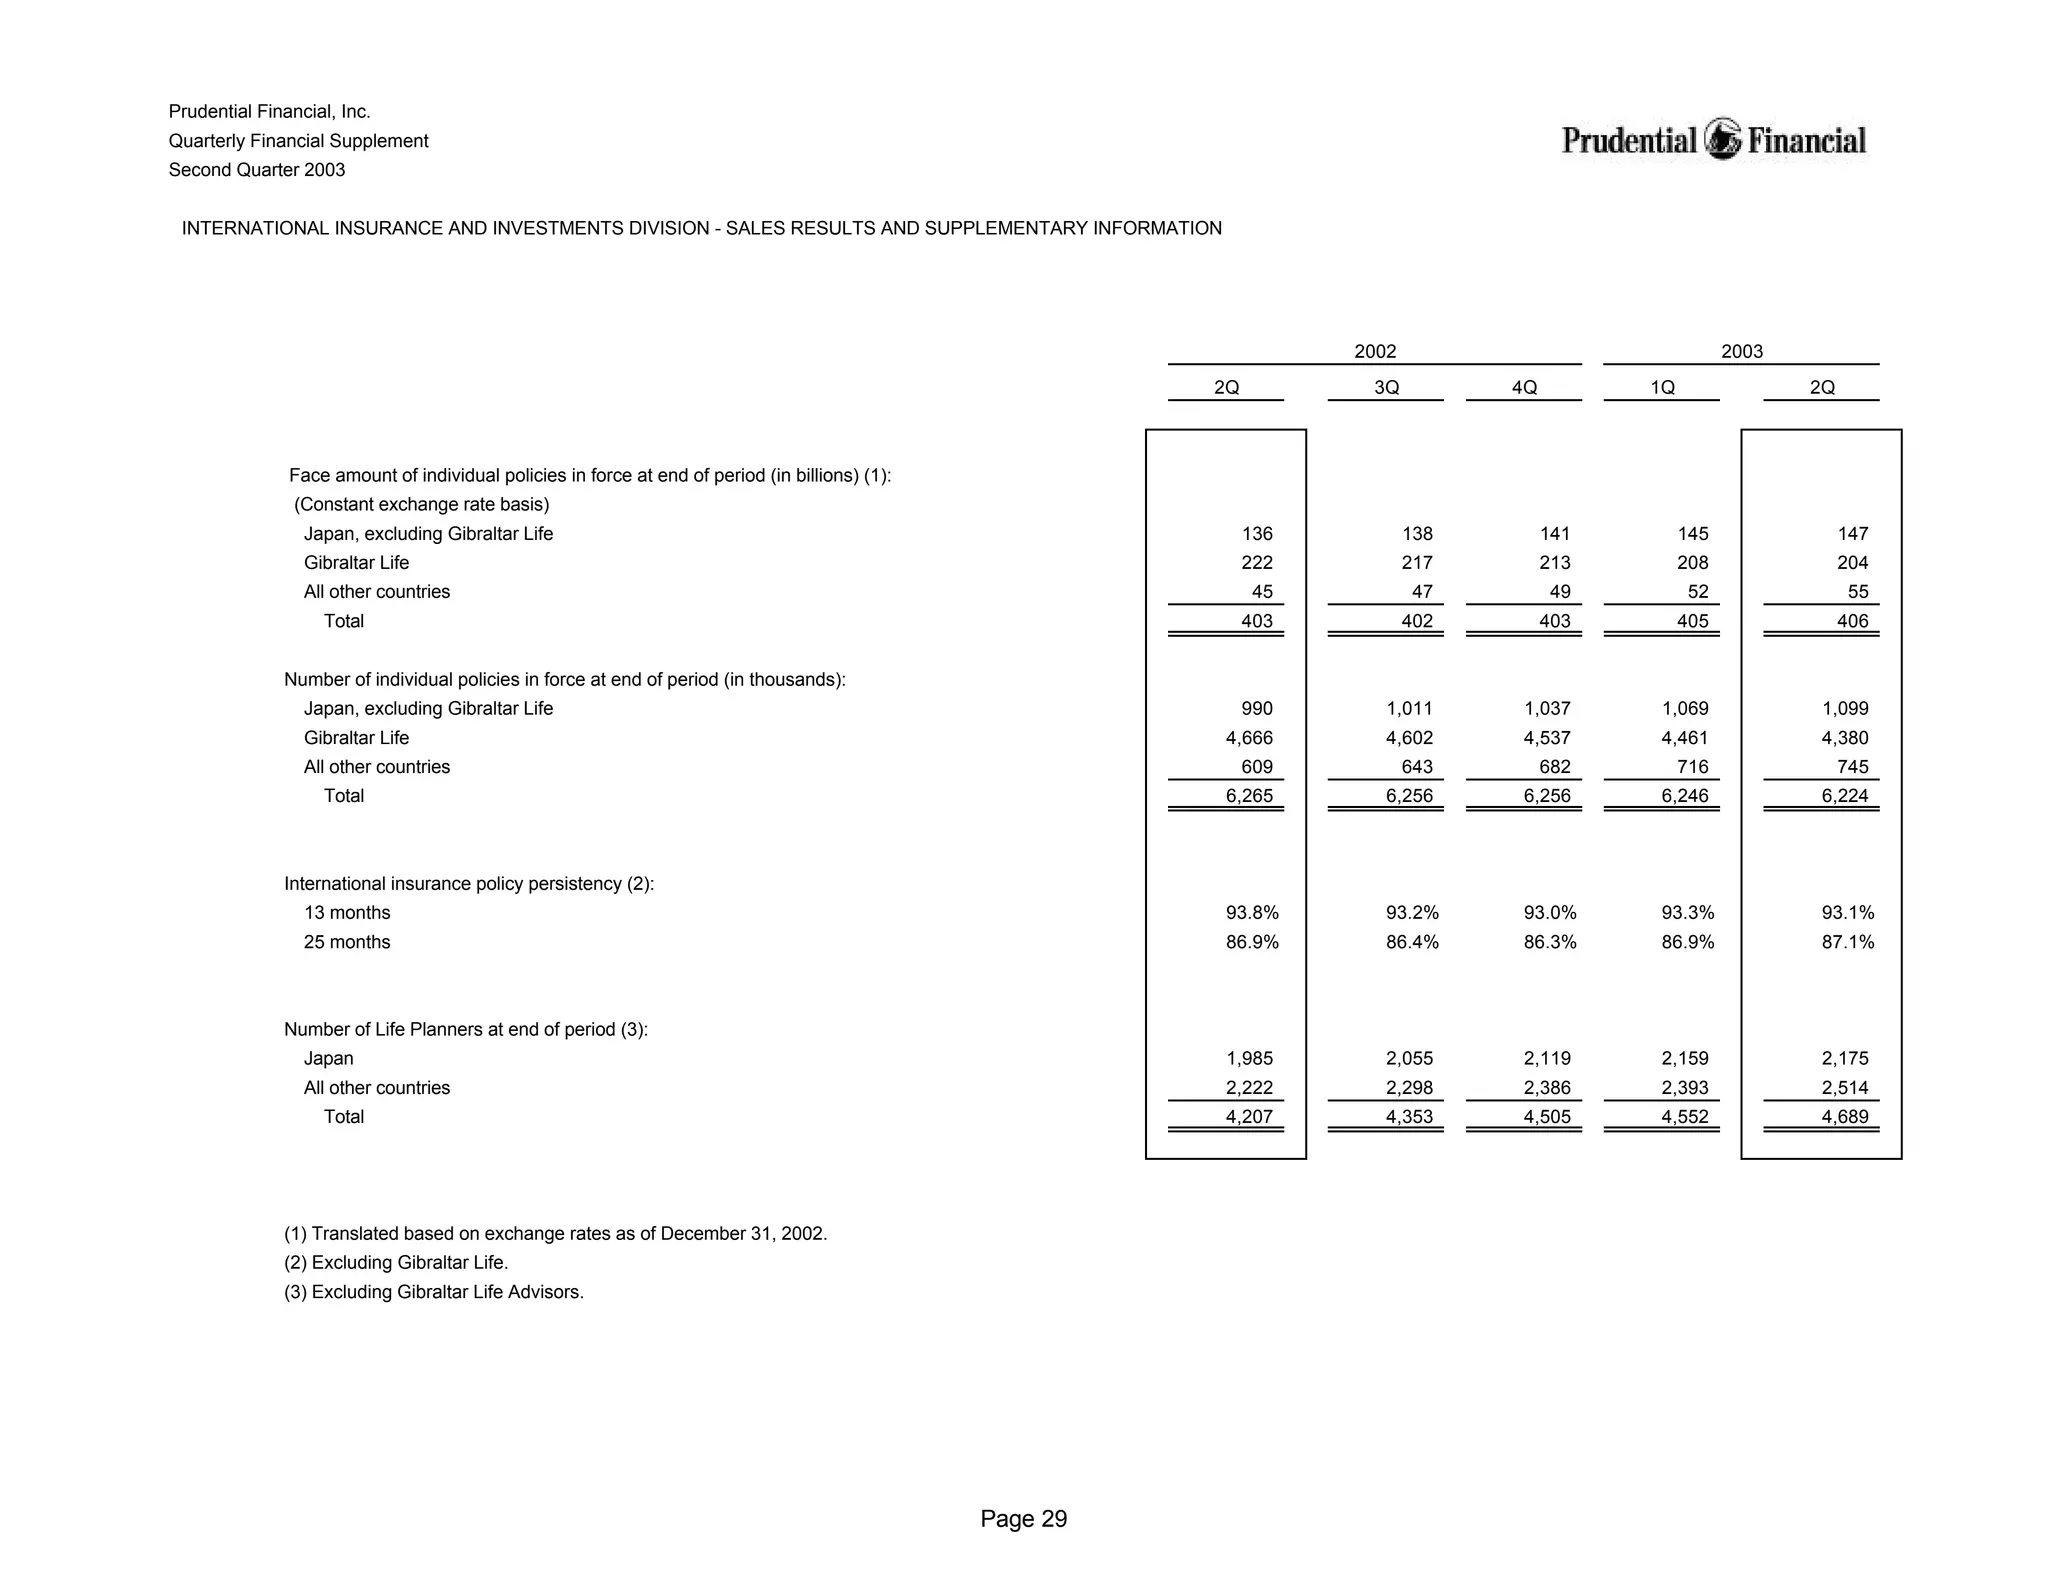

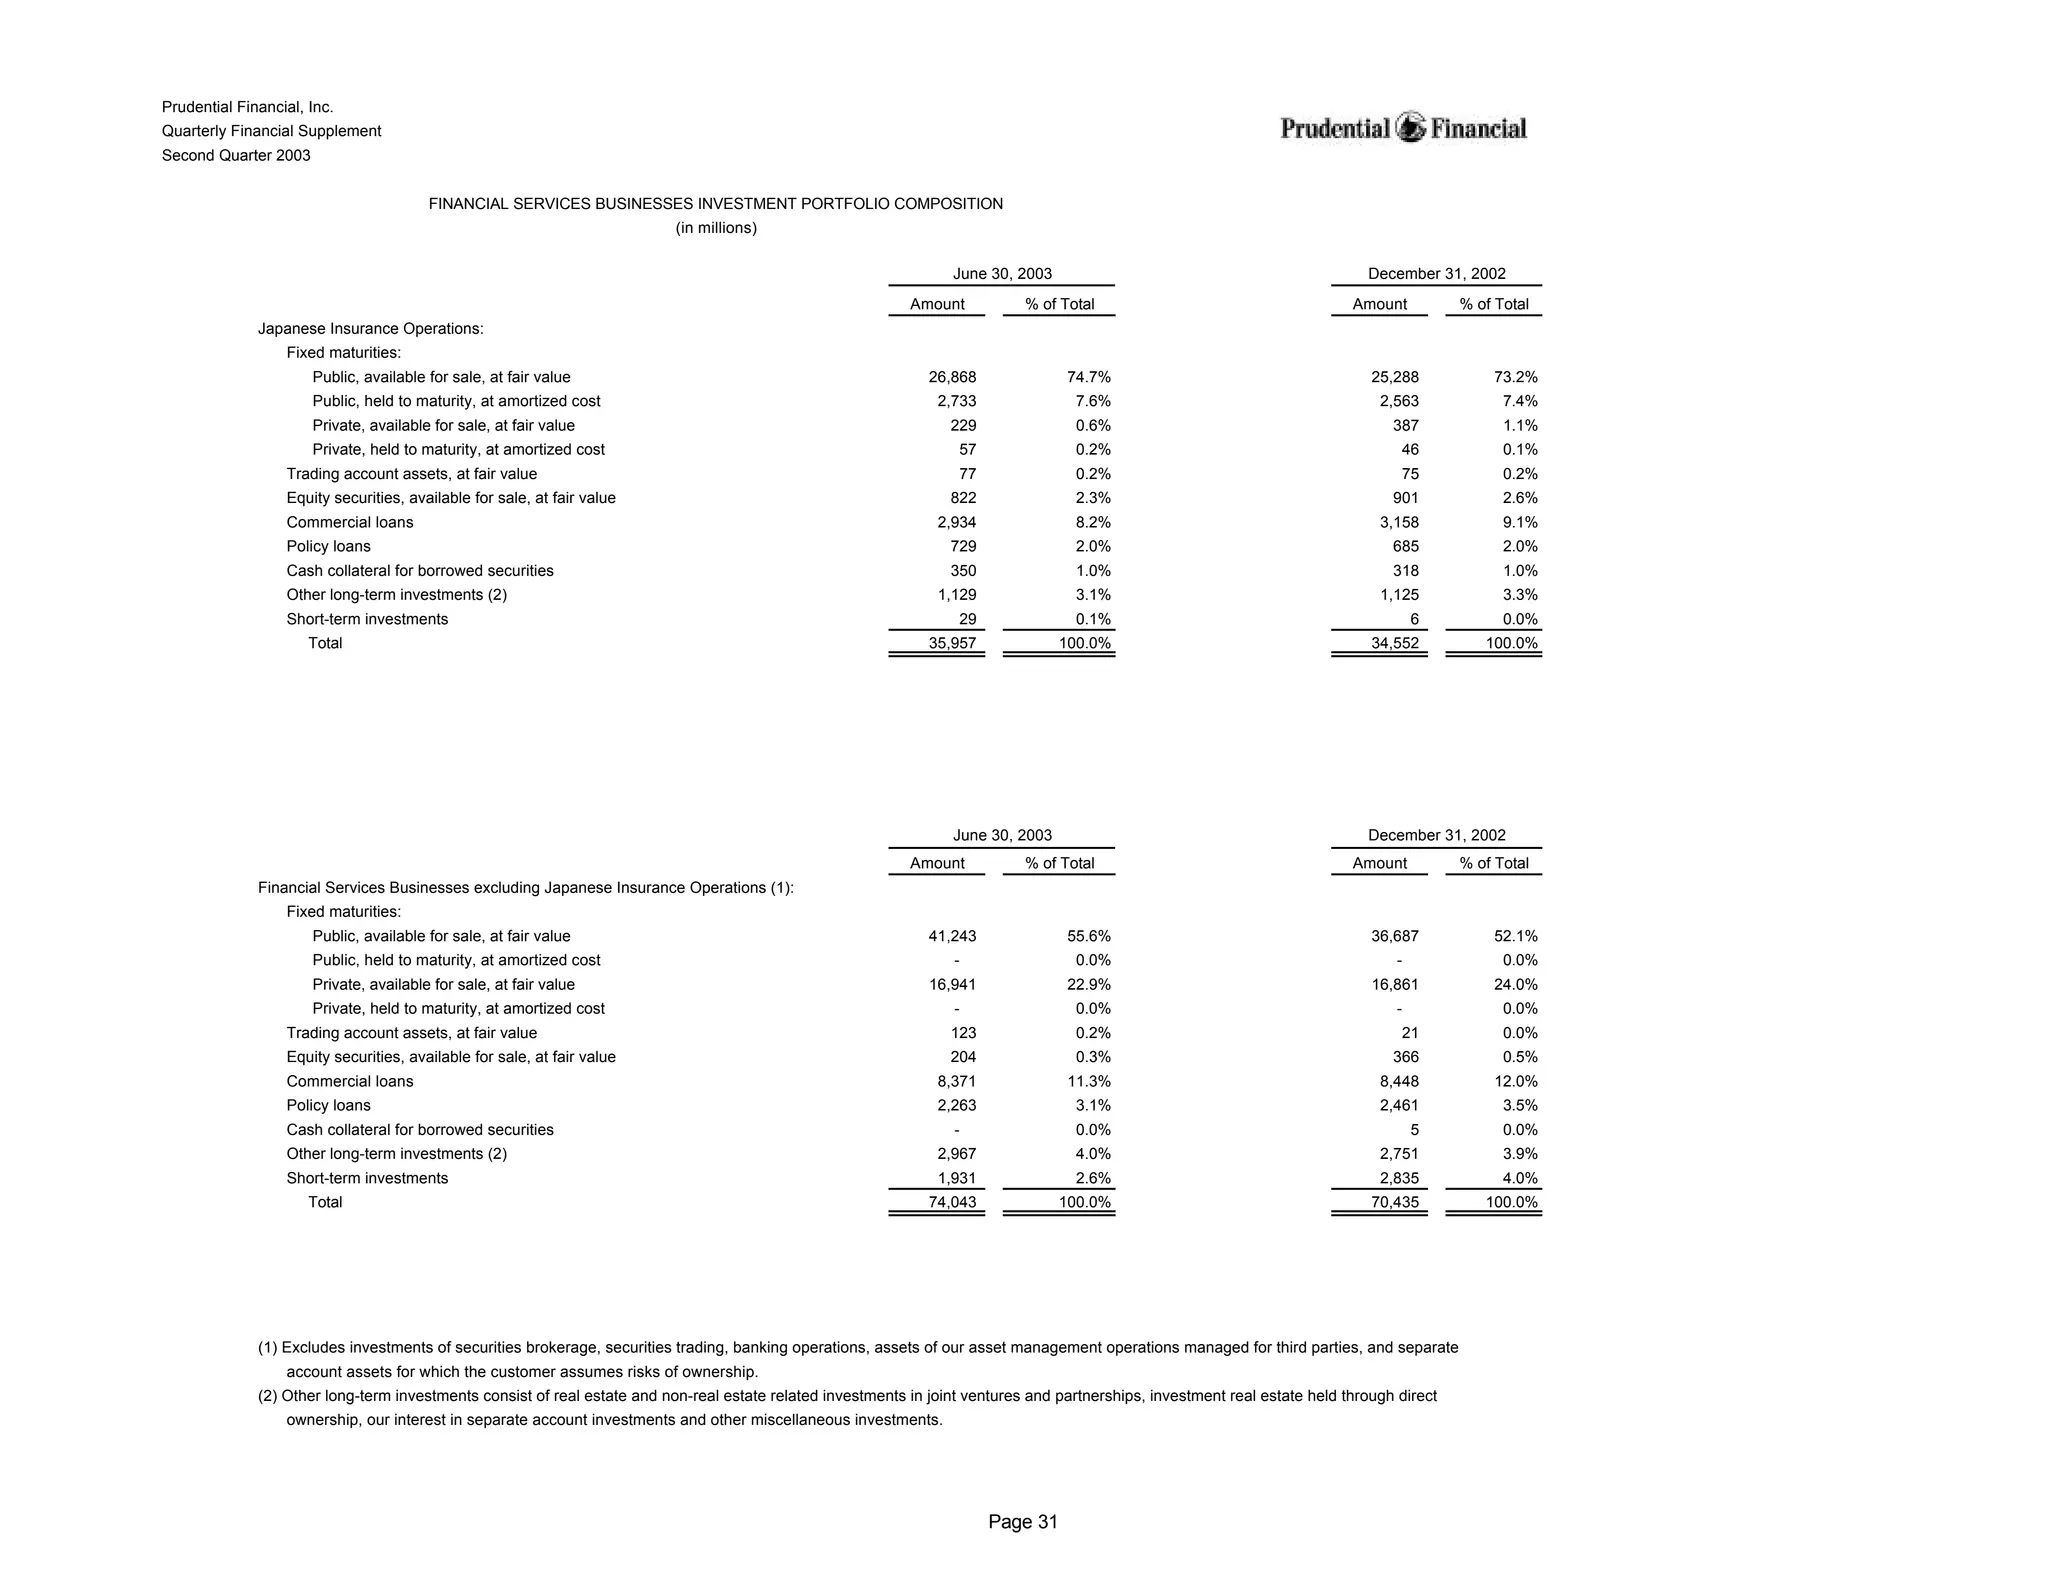


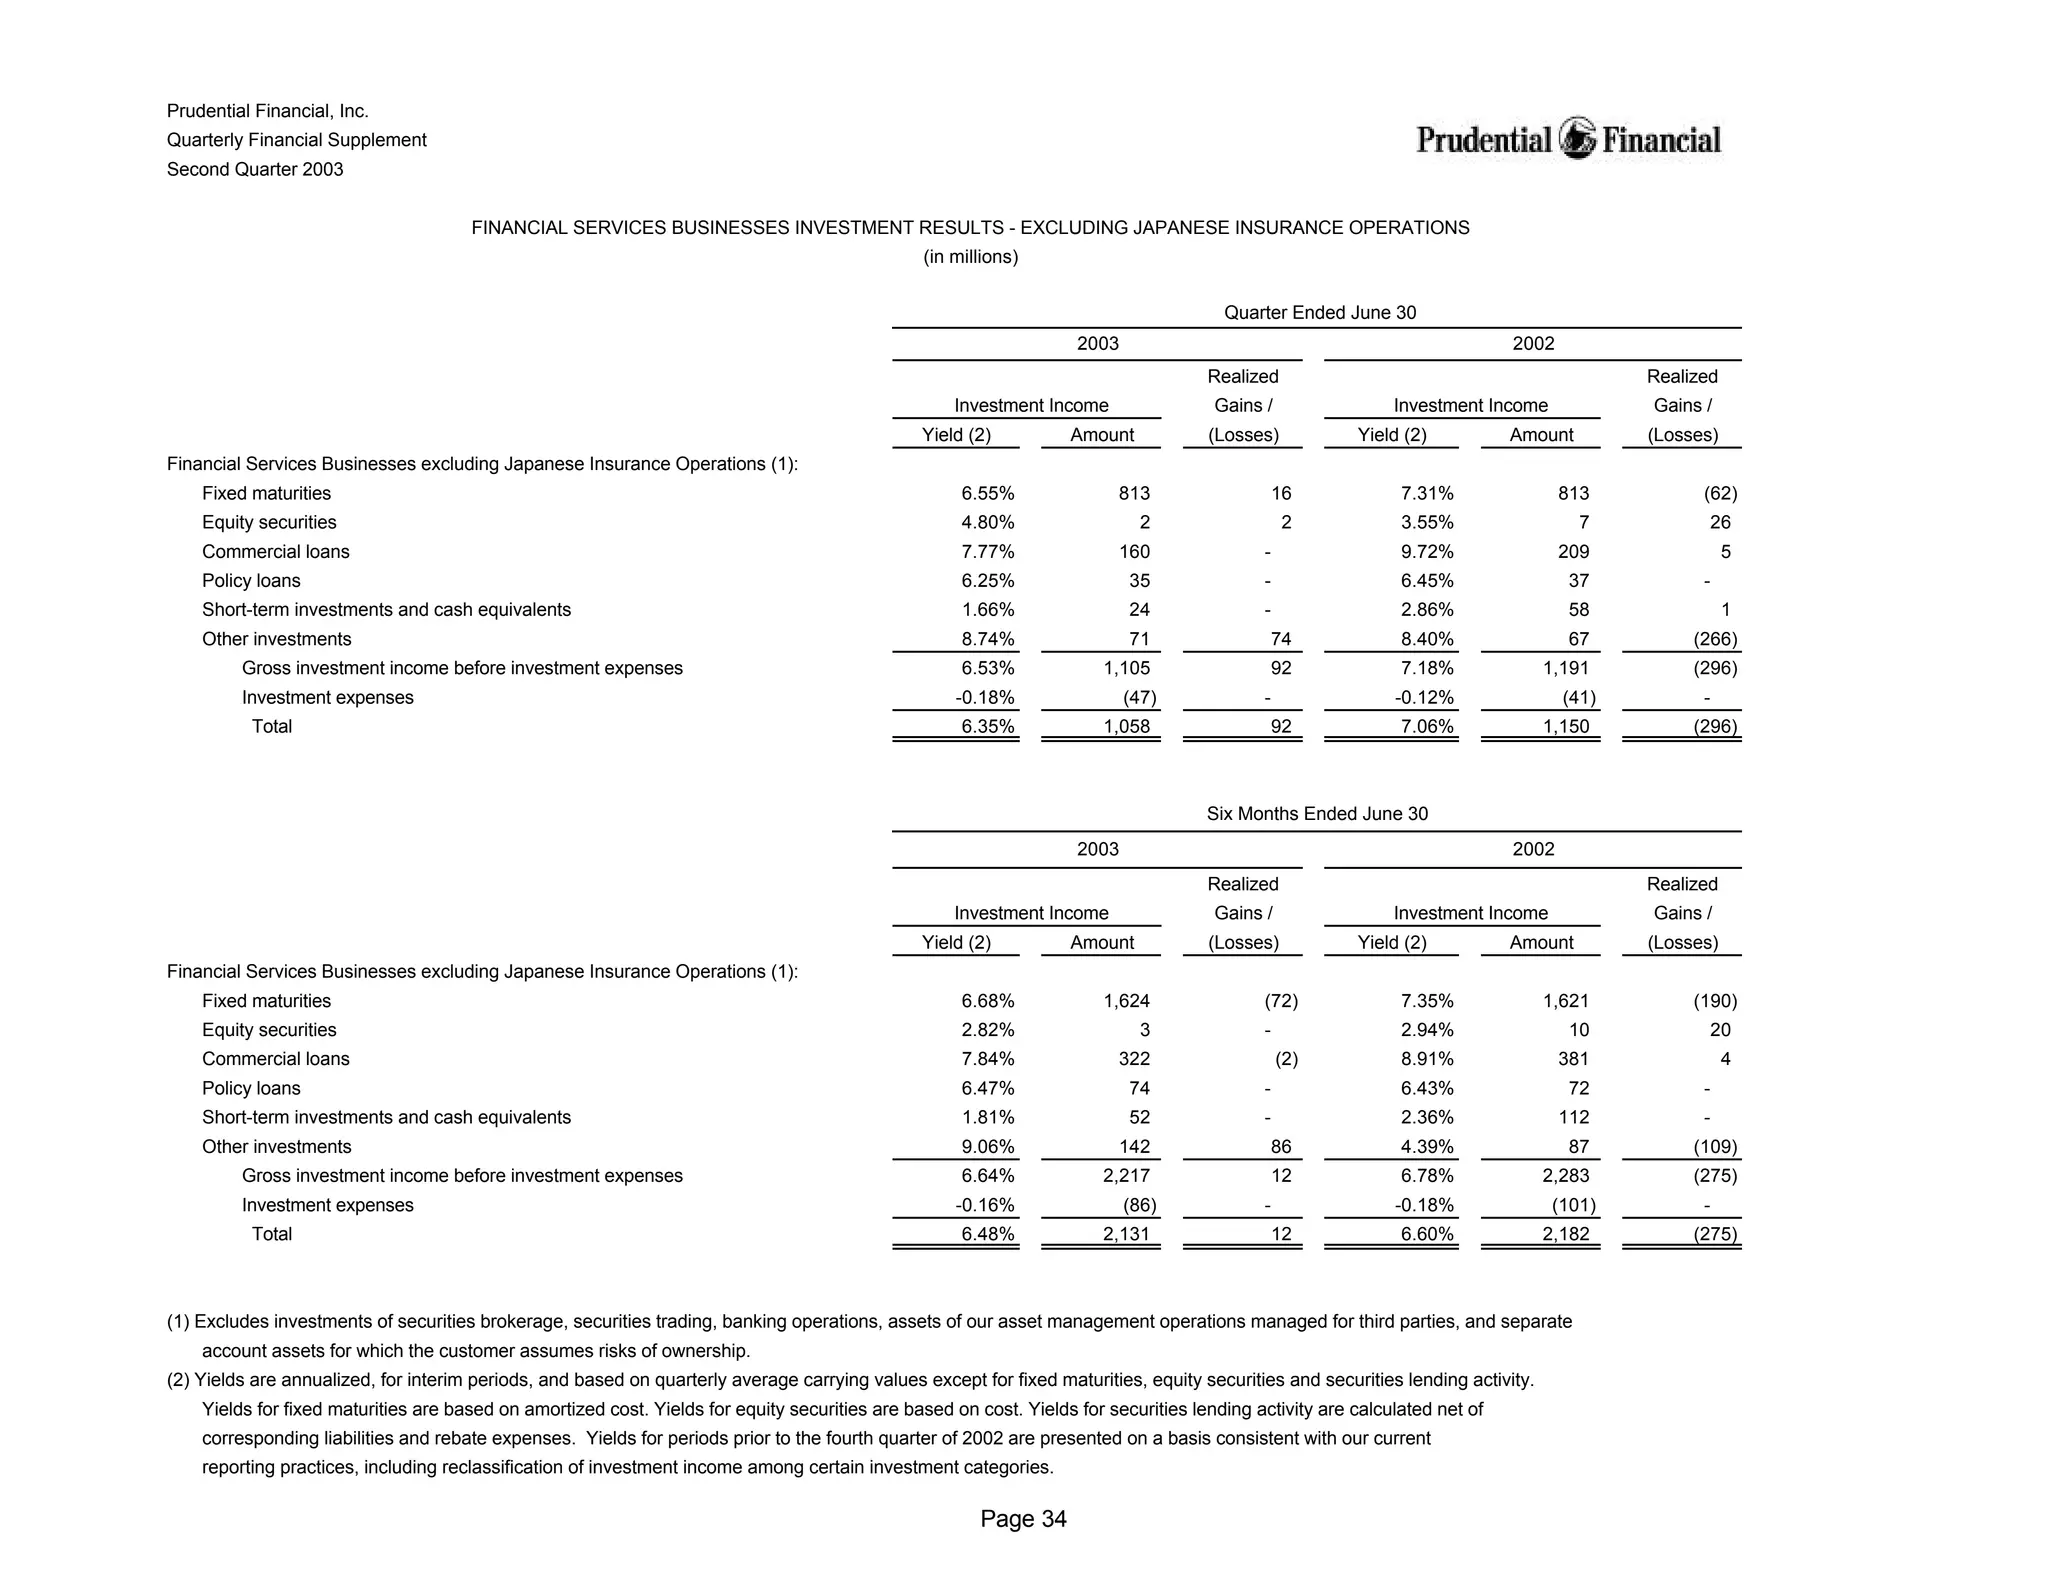
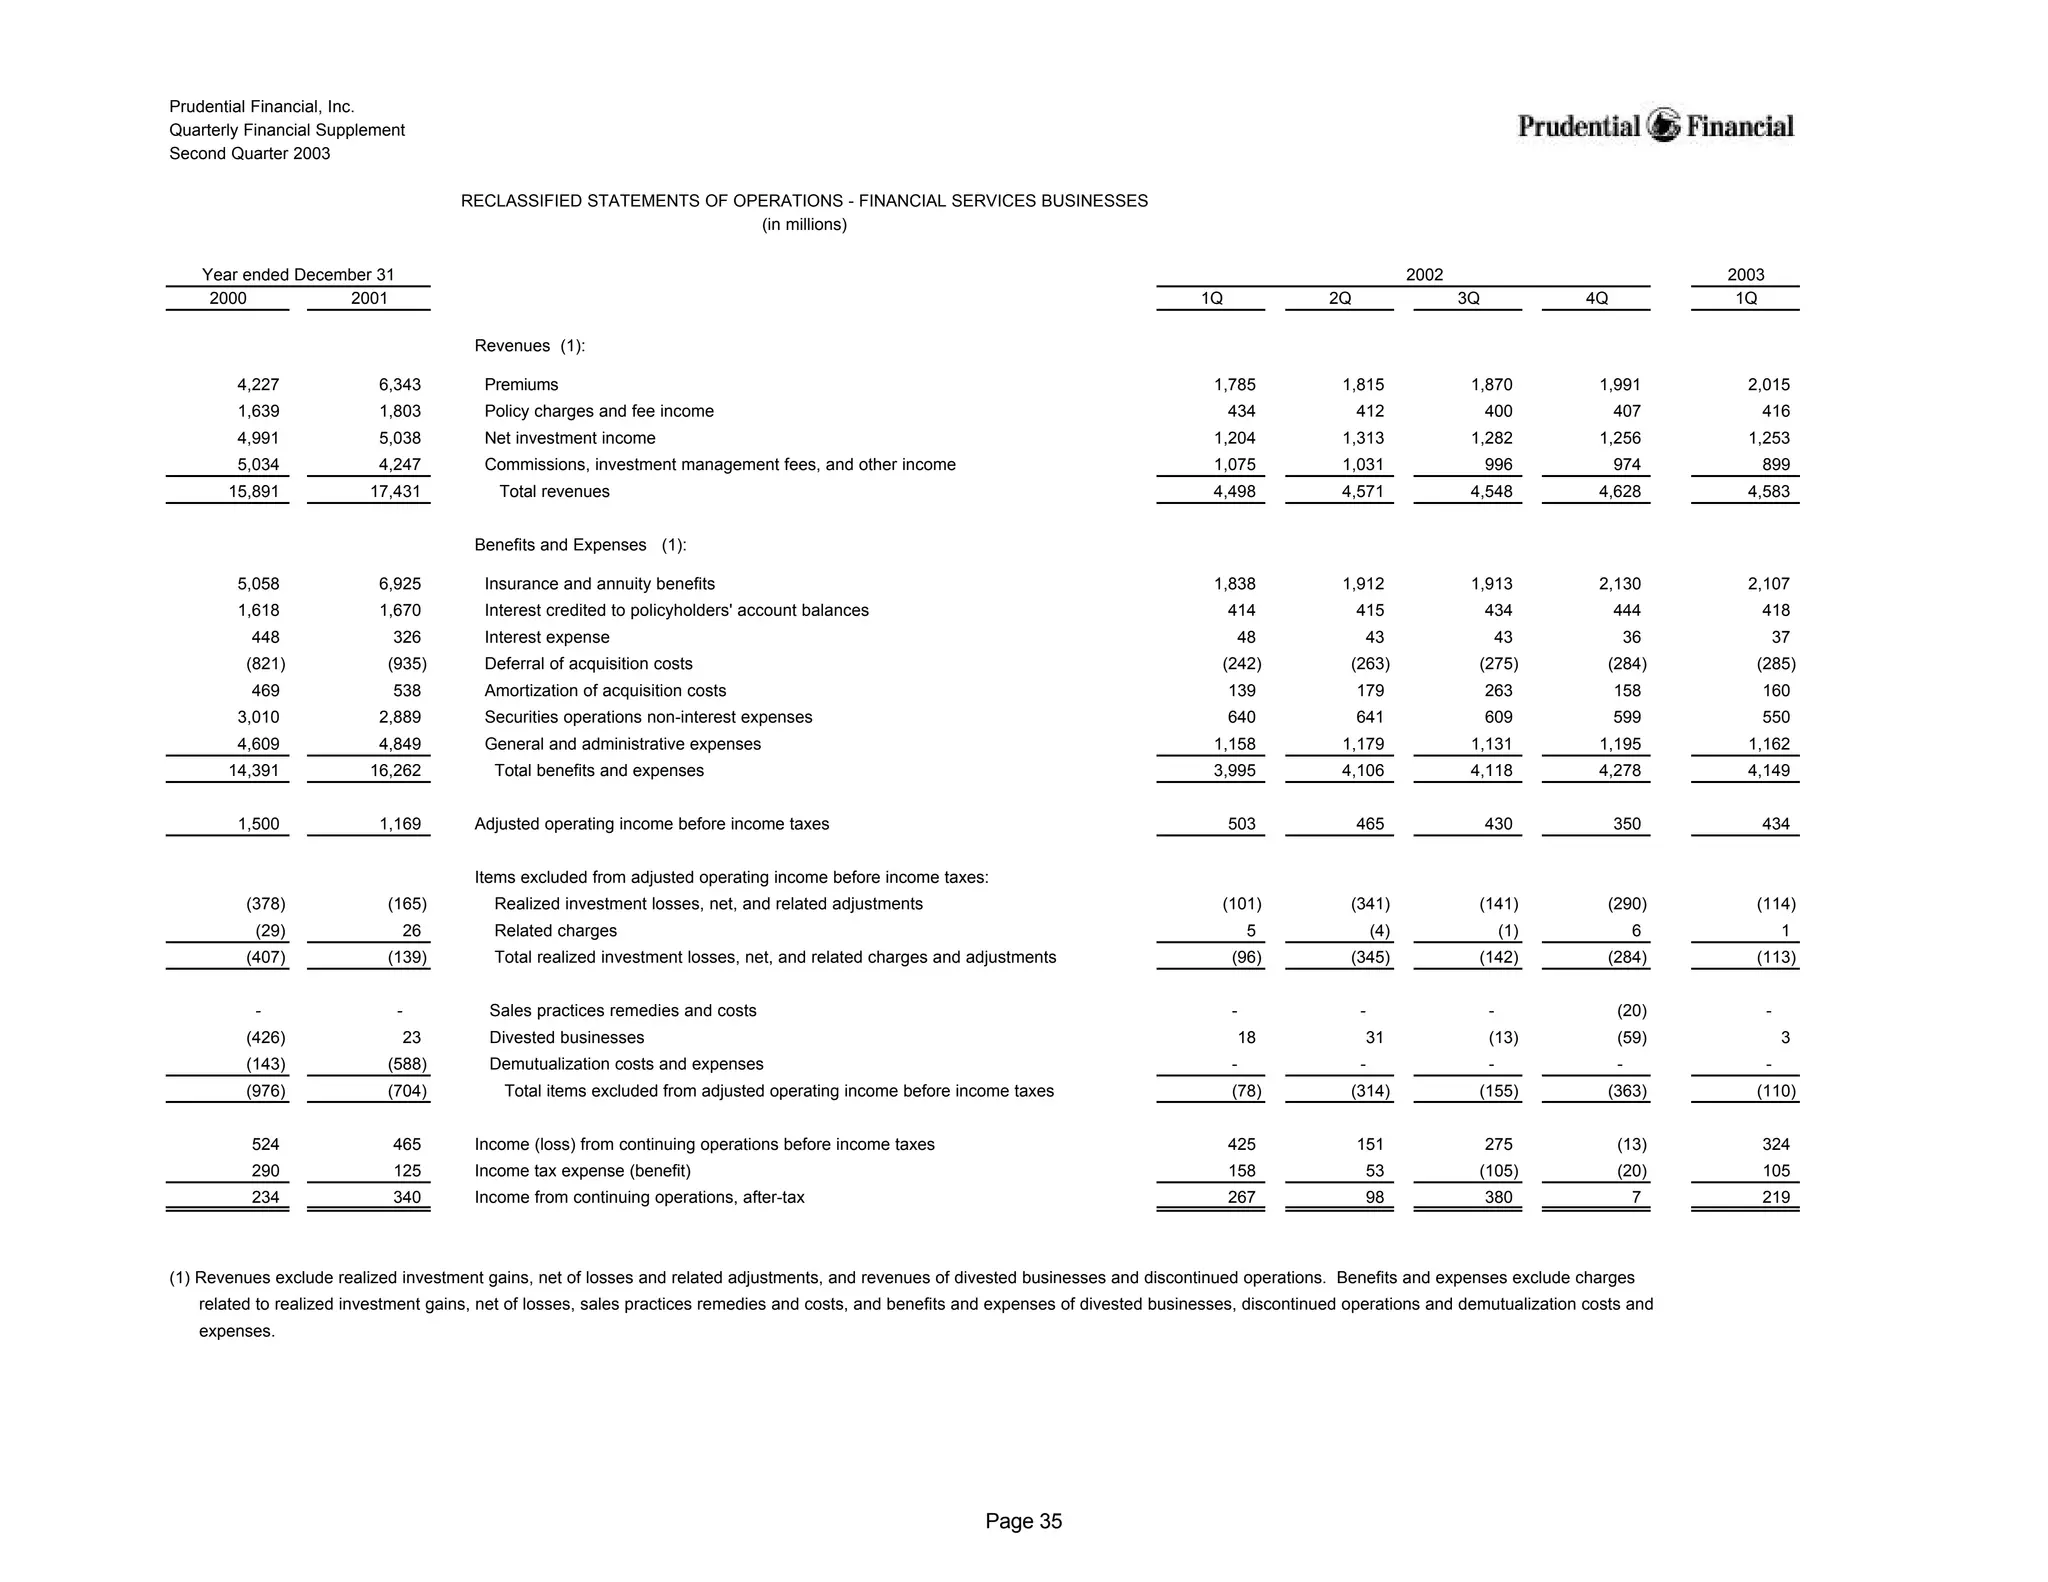


- Prudential Financial's Quarterly Financial Supplement provides financial and operating highlights for the second quarter of 2003. - Key metrics include pre-tax adjusted operating income, net income, earnings per share, assets under management, distribution representatives, and capitalization data for the Company's Financial Services Businesses. - The document presents historical results reflecting the classification of certain property/casualty insurance businesses as divested and the classification of two Japanese asset management units as divested businesses.


