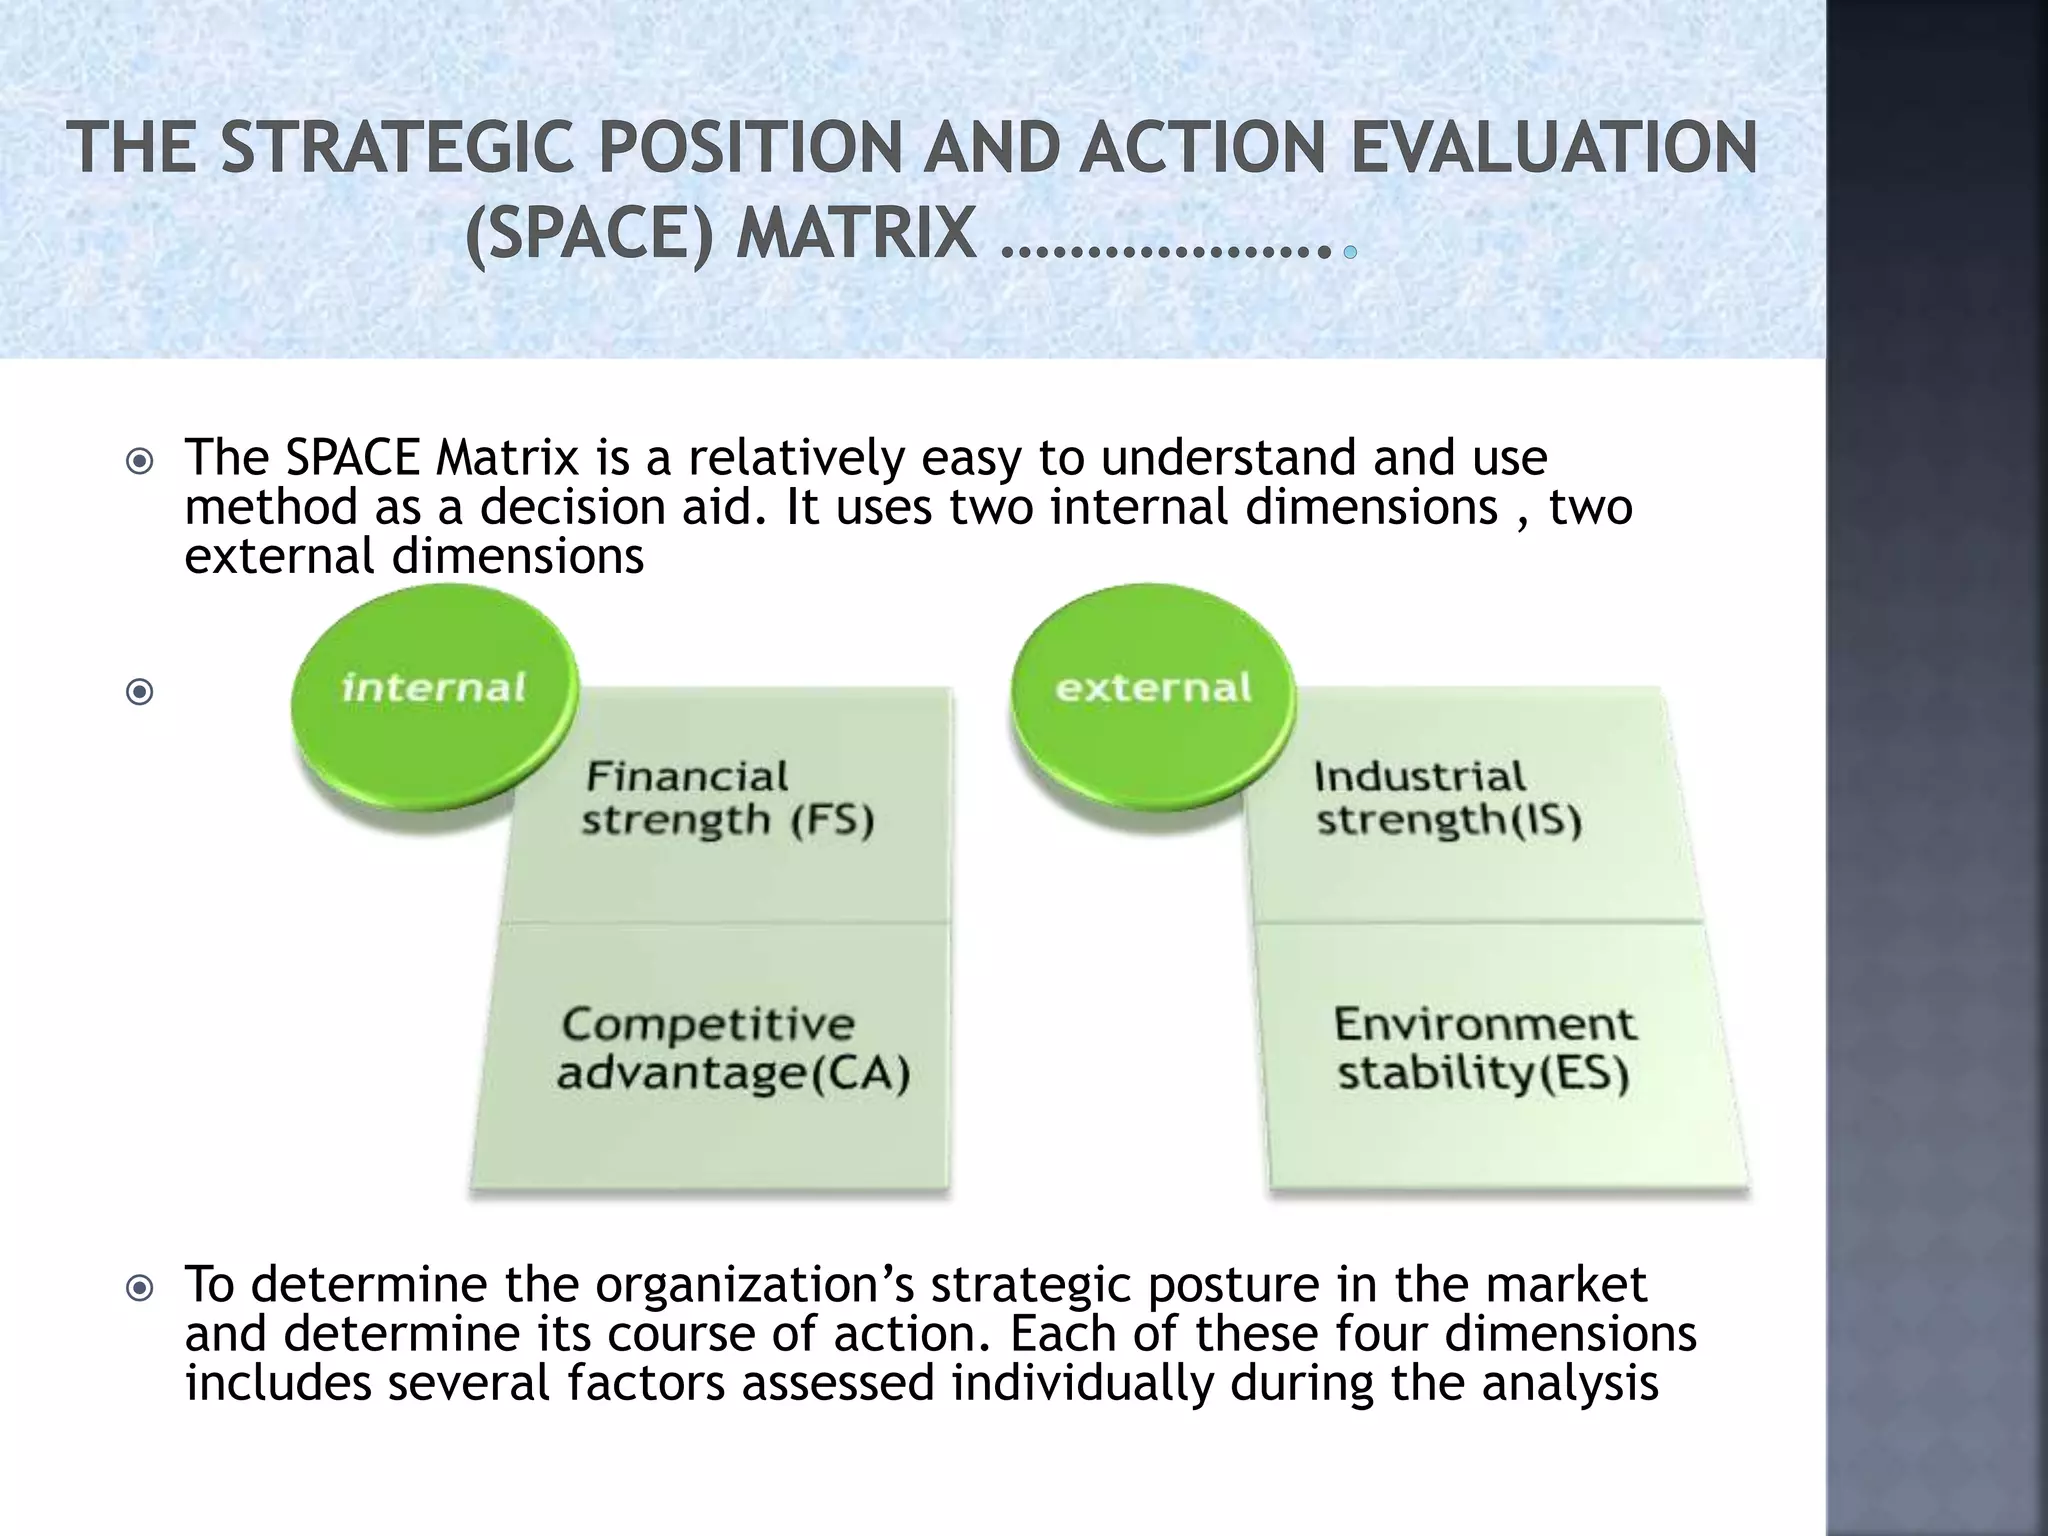
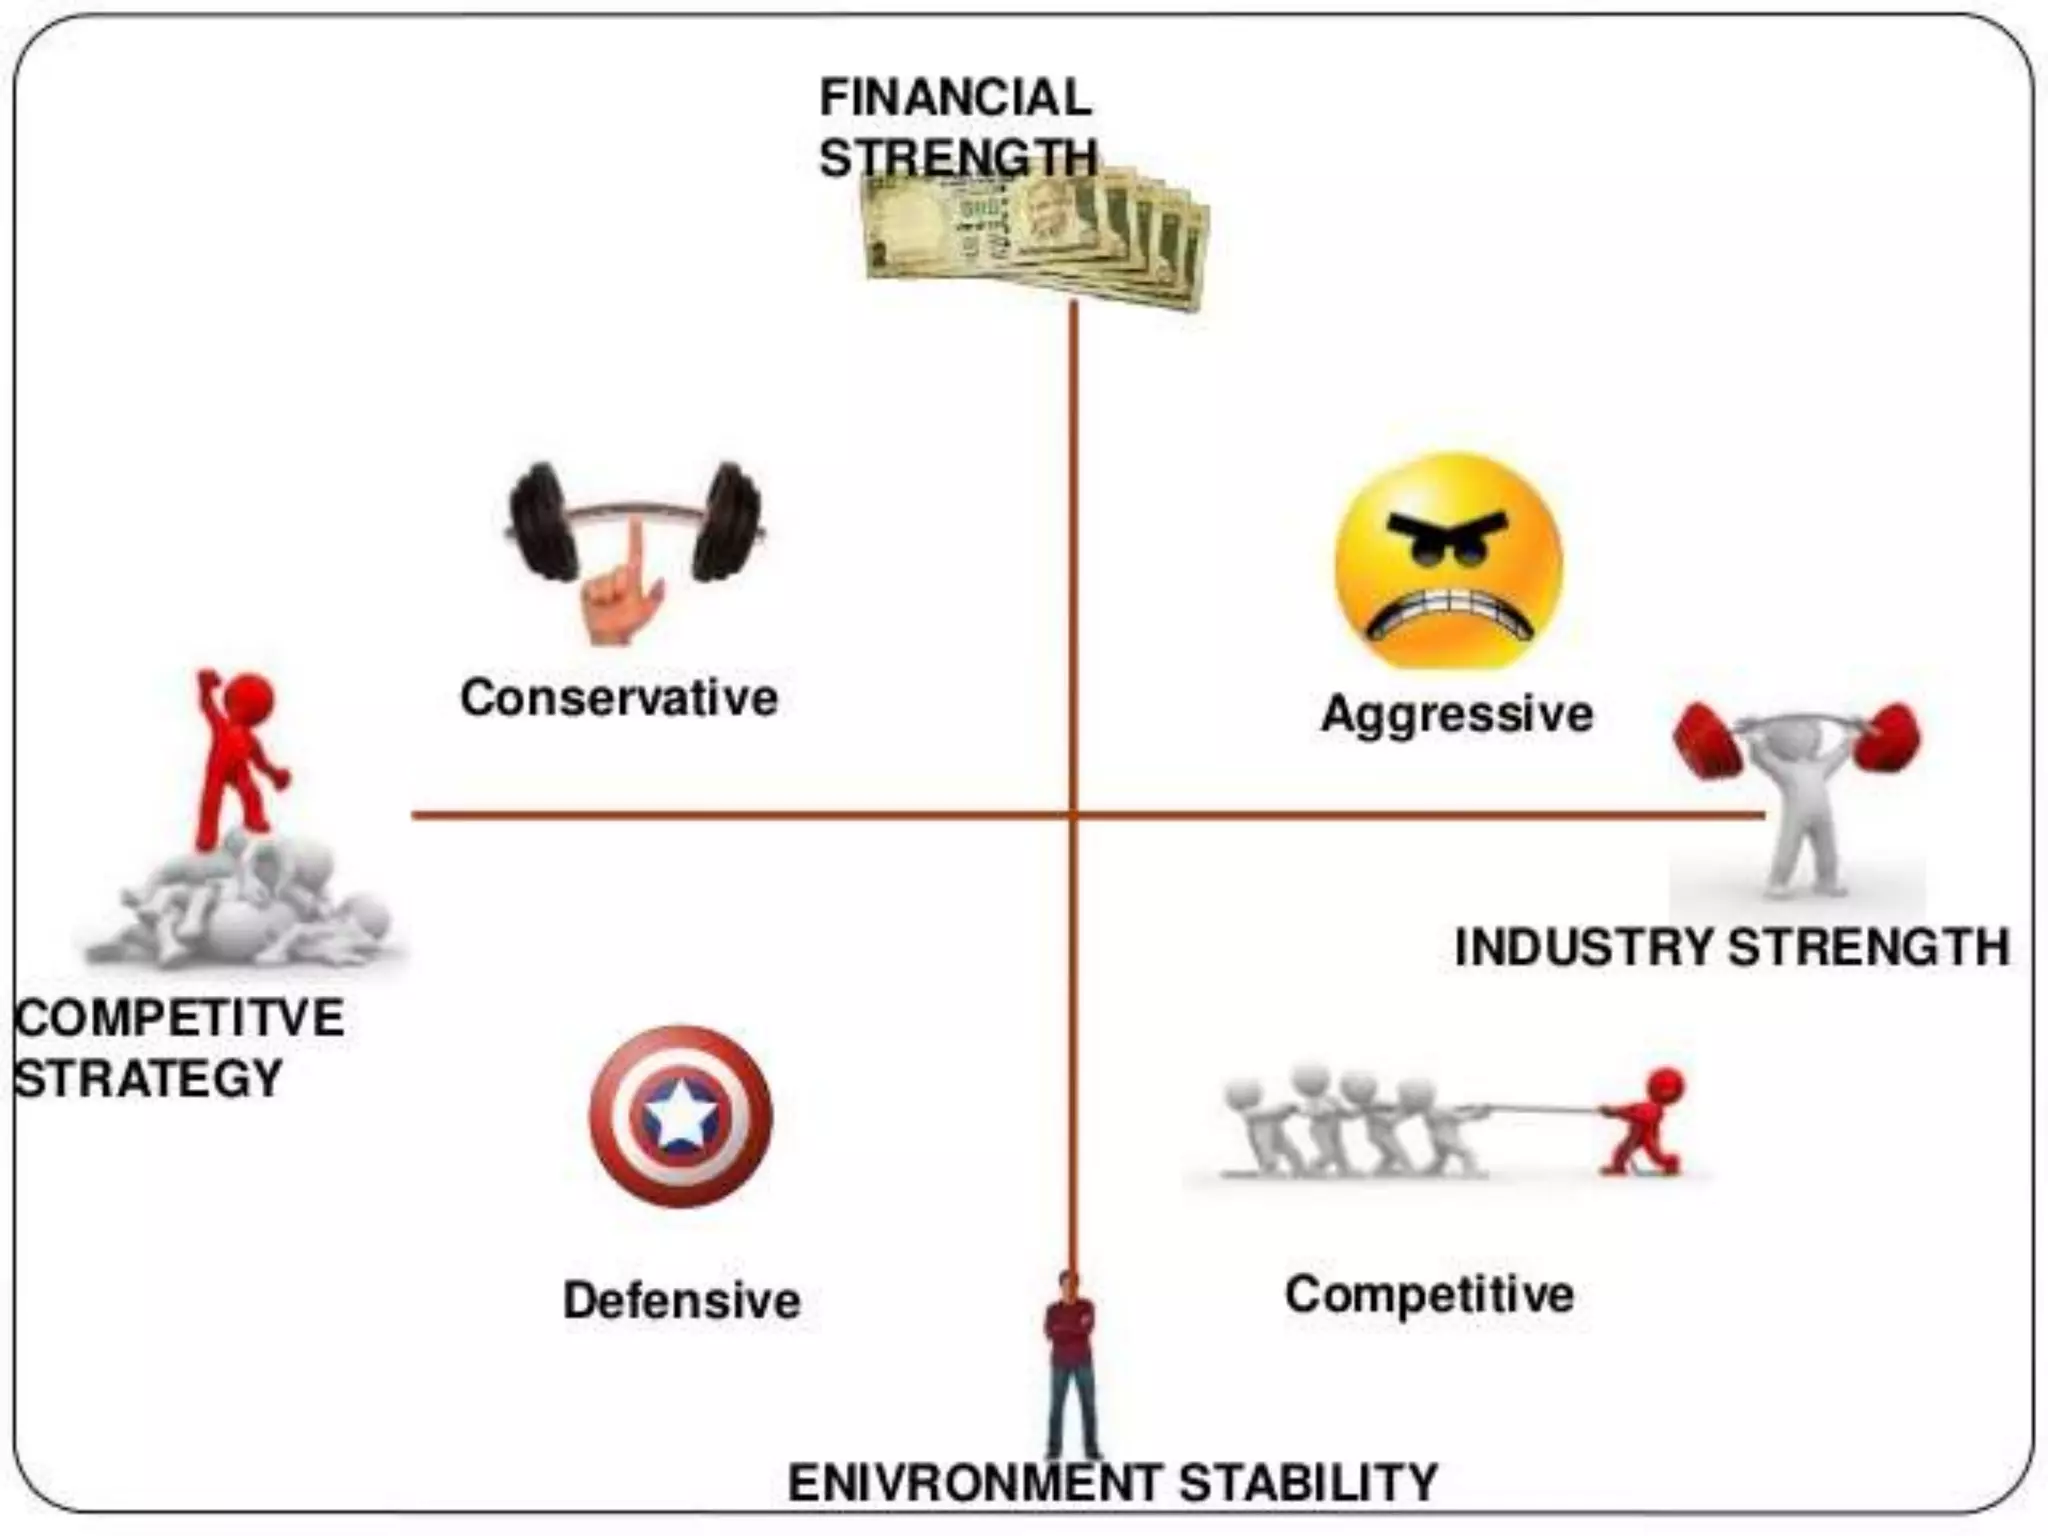
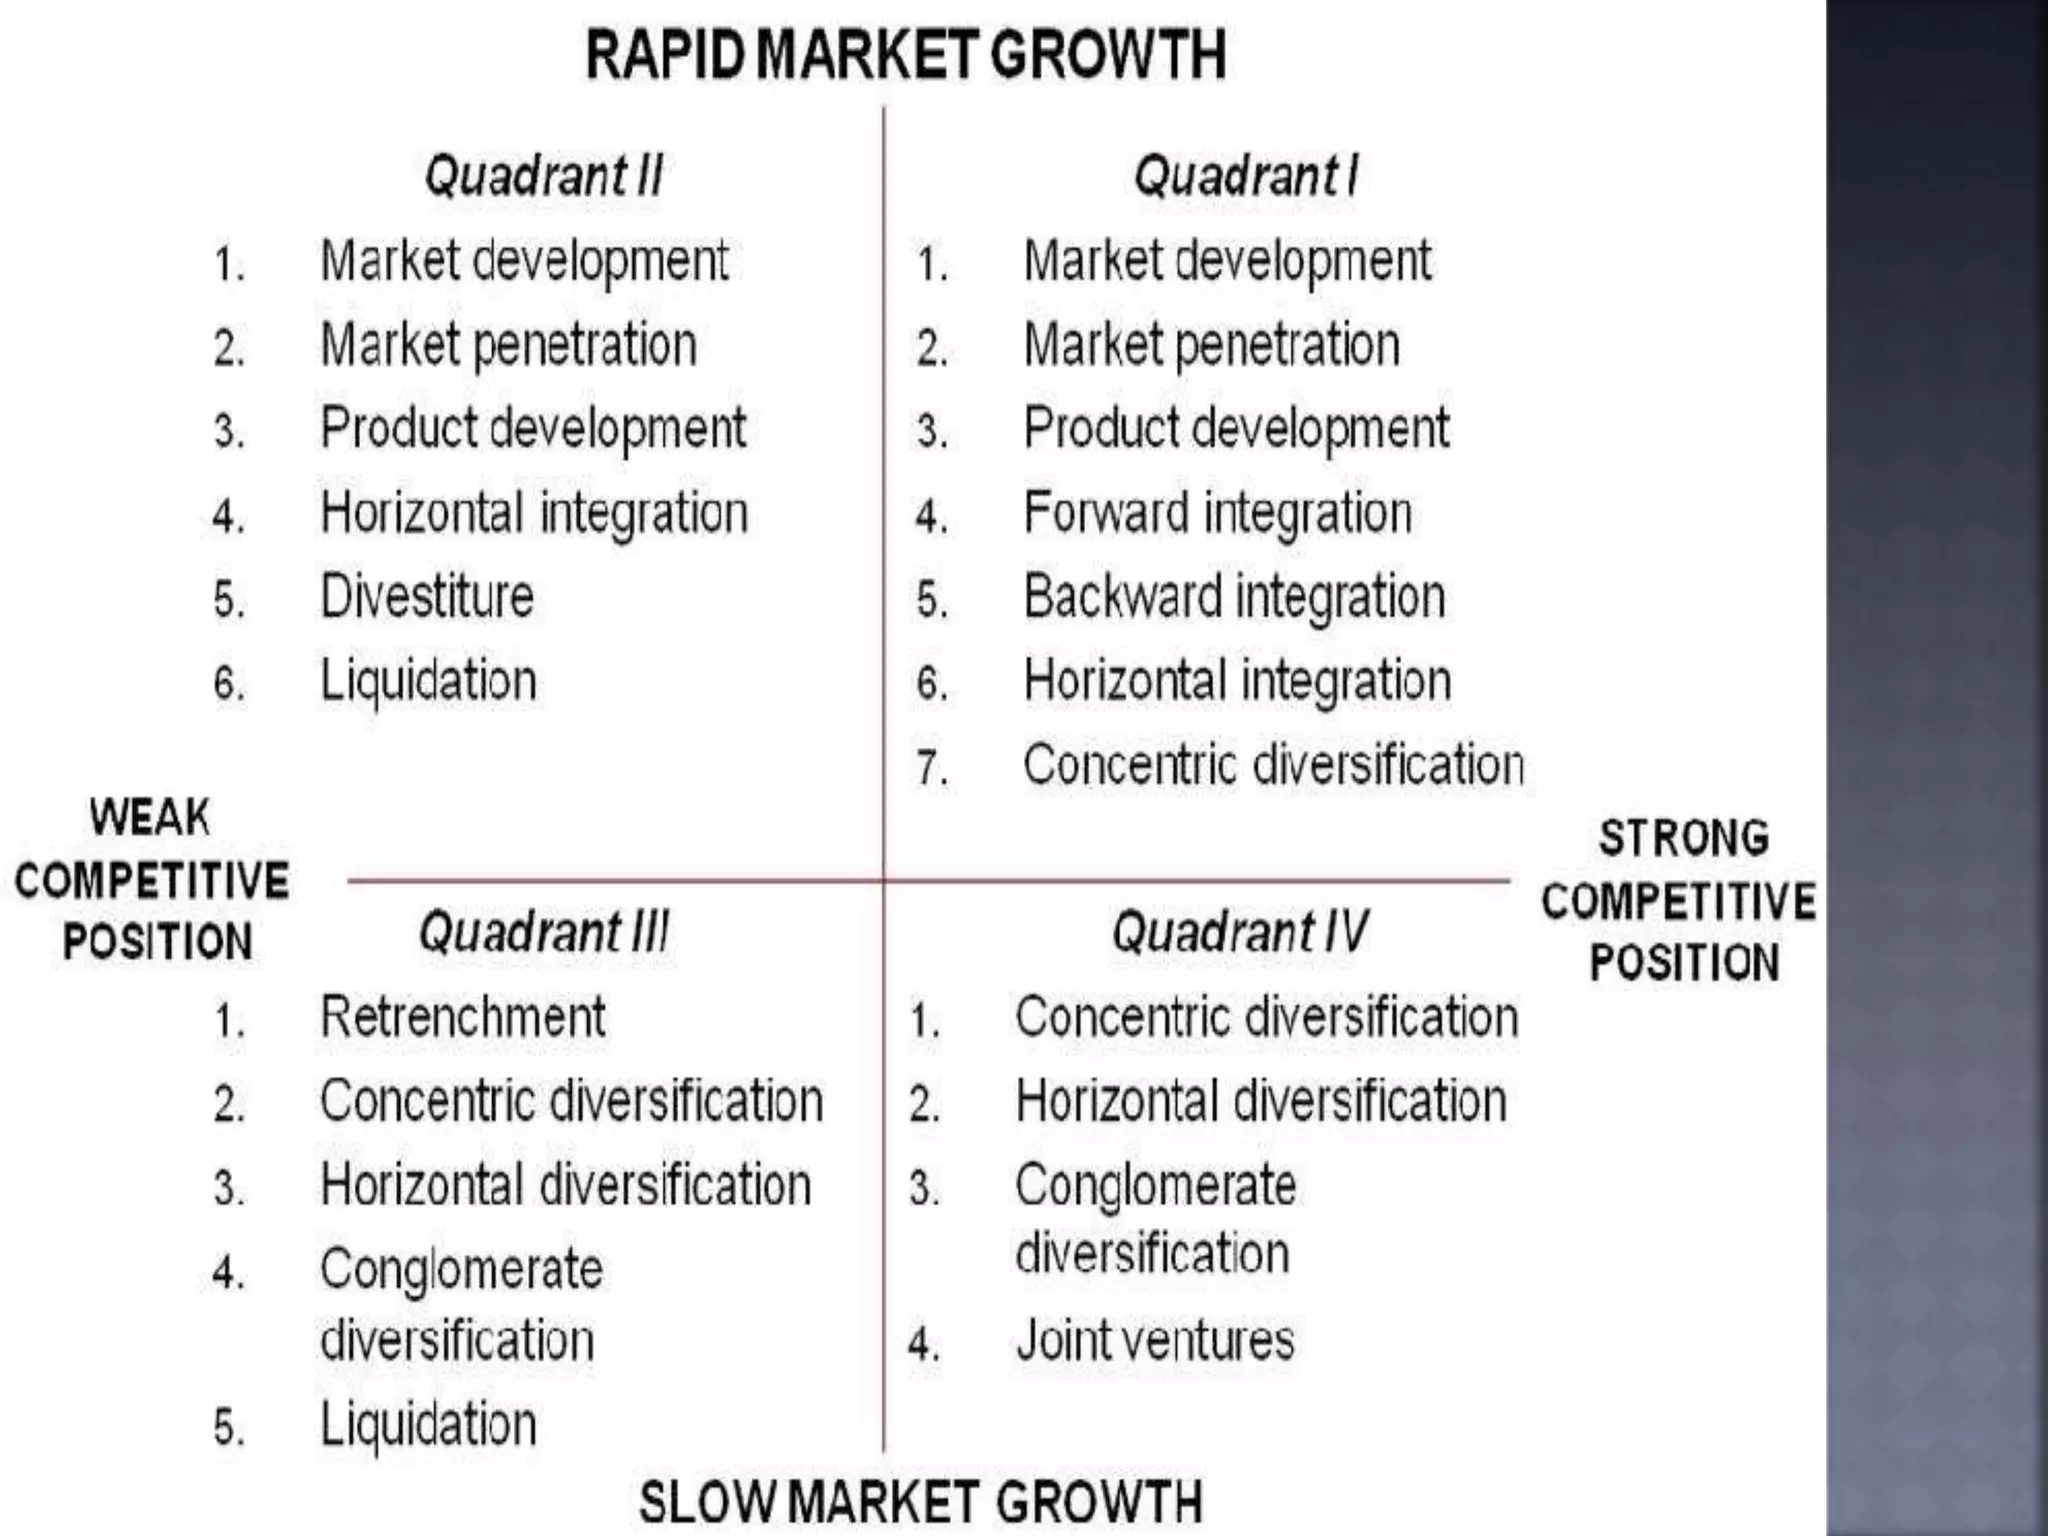
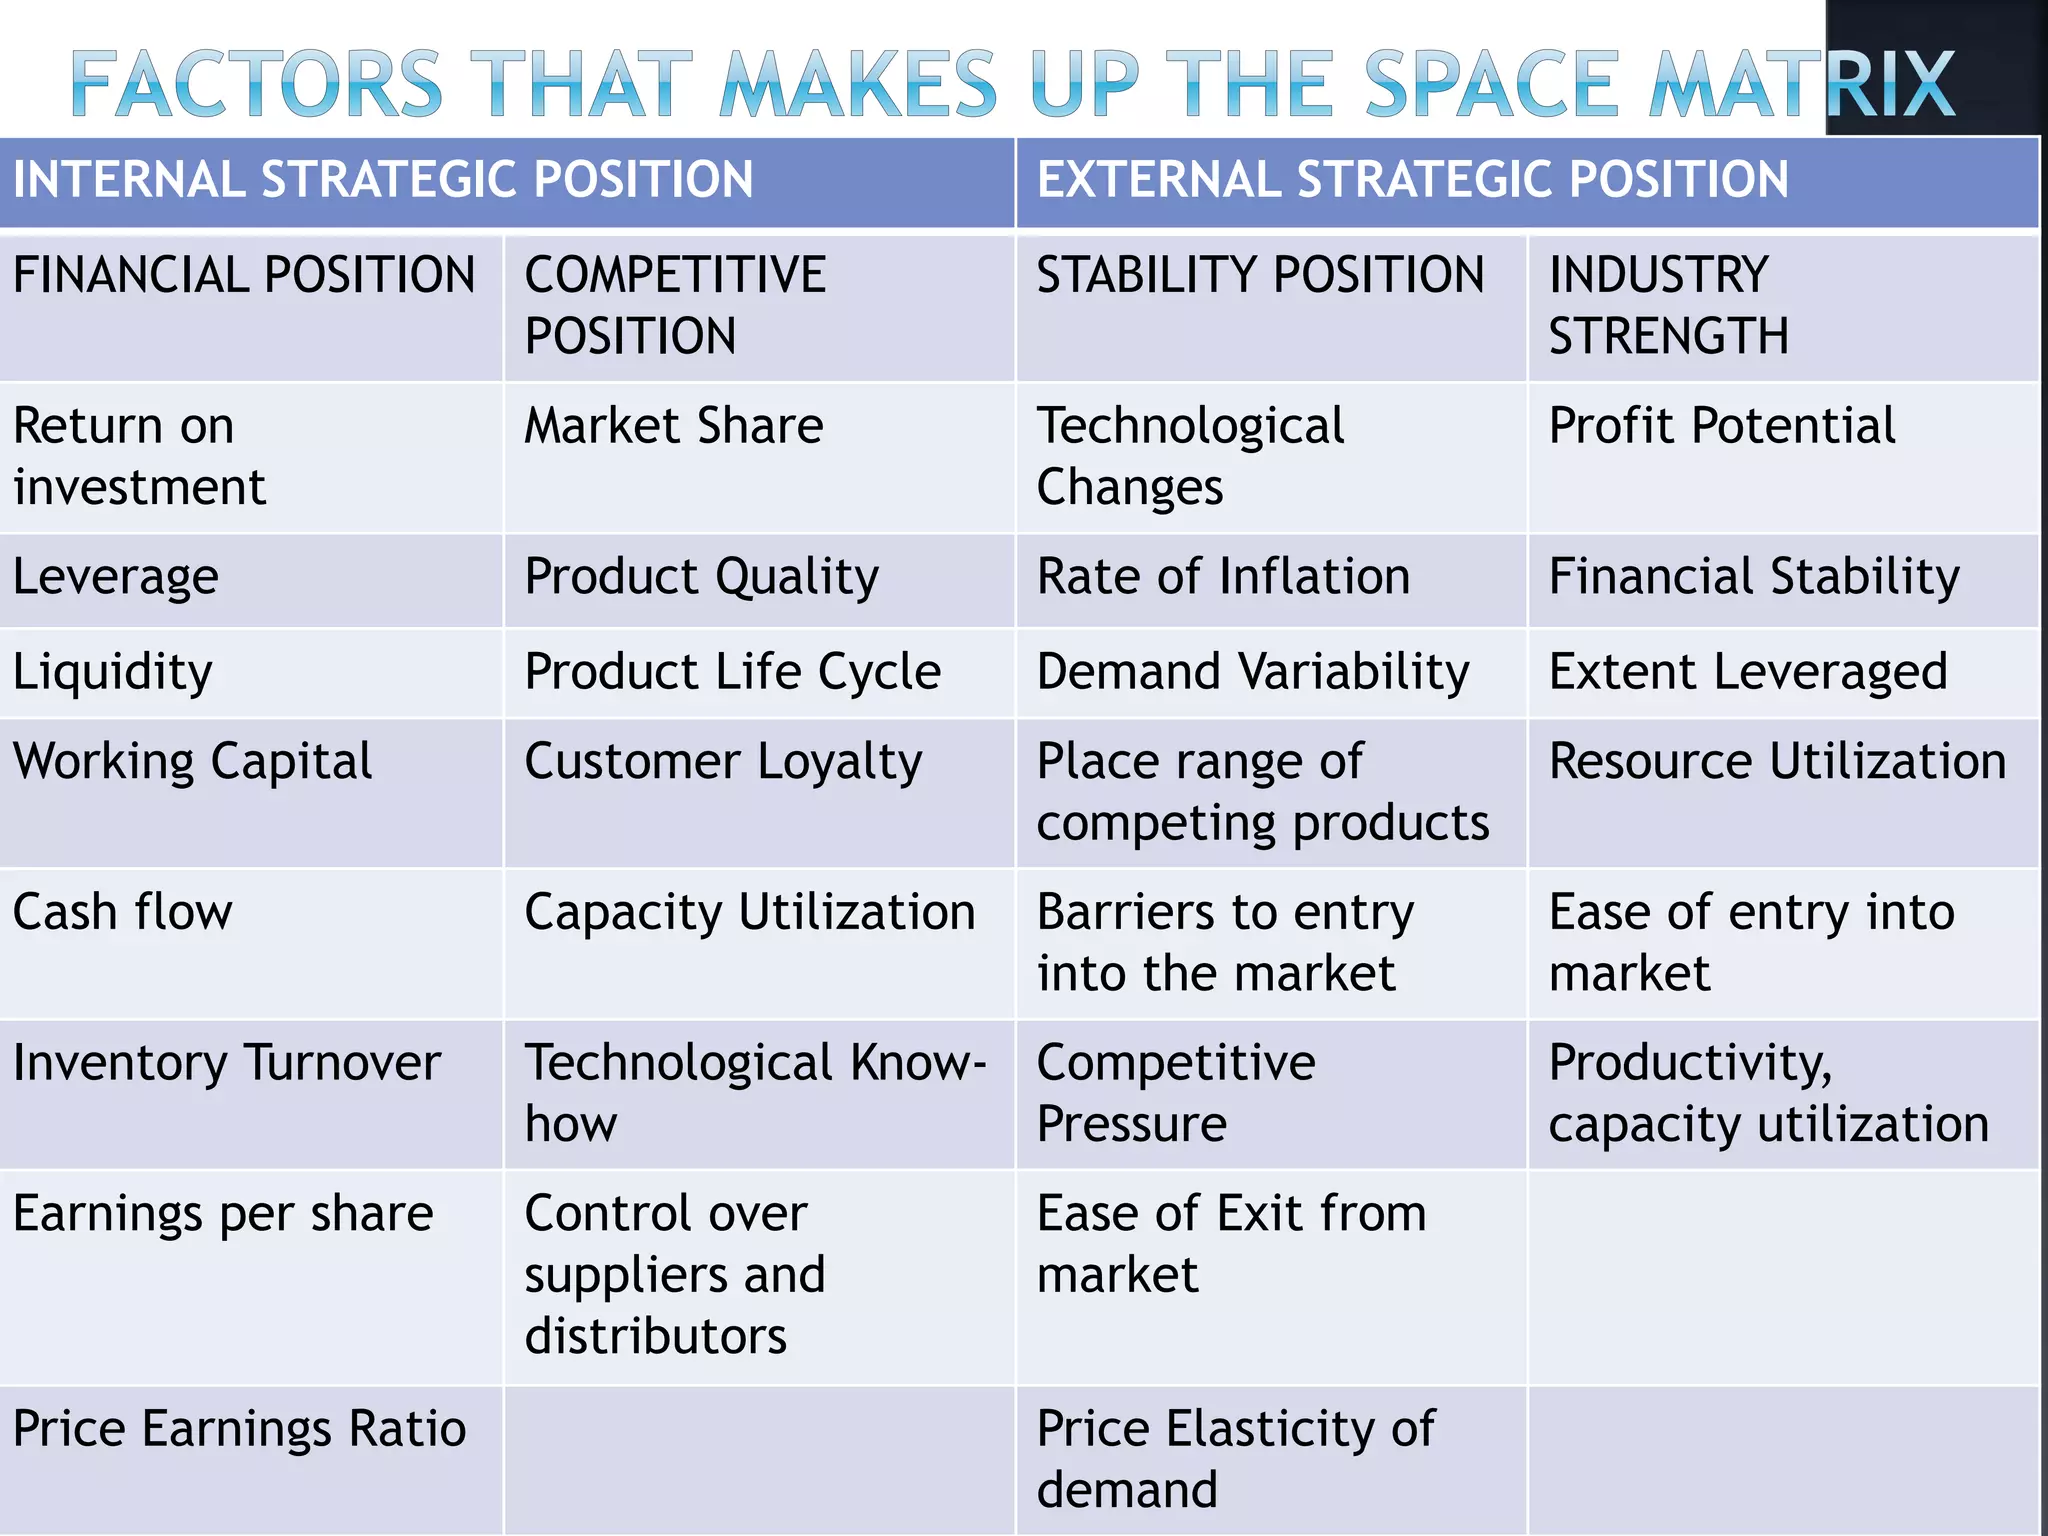
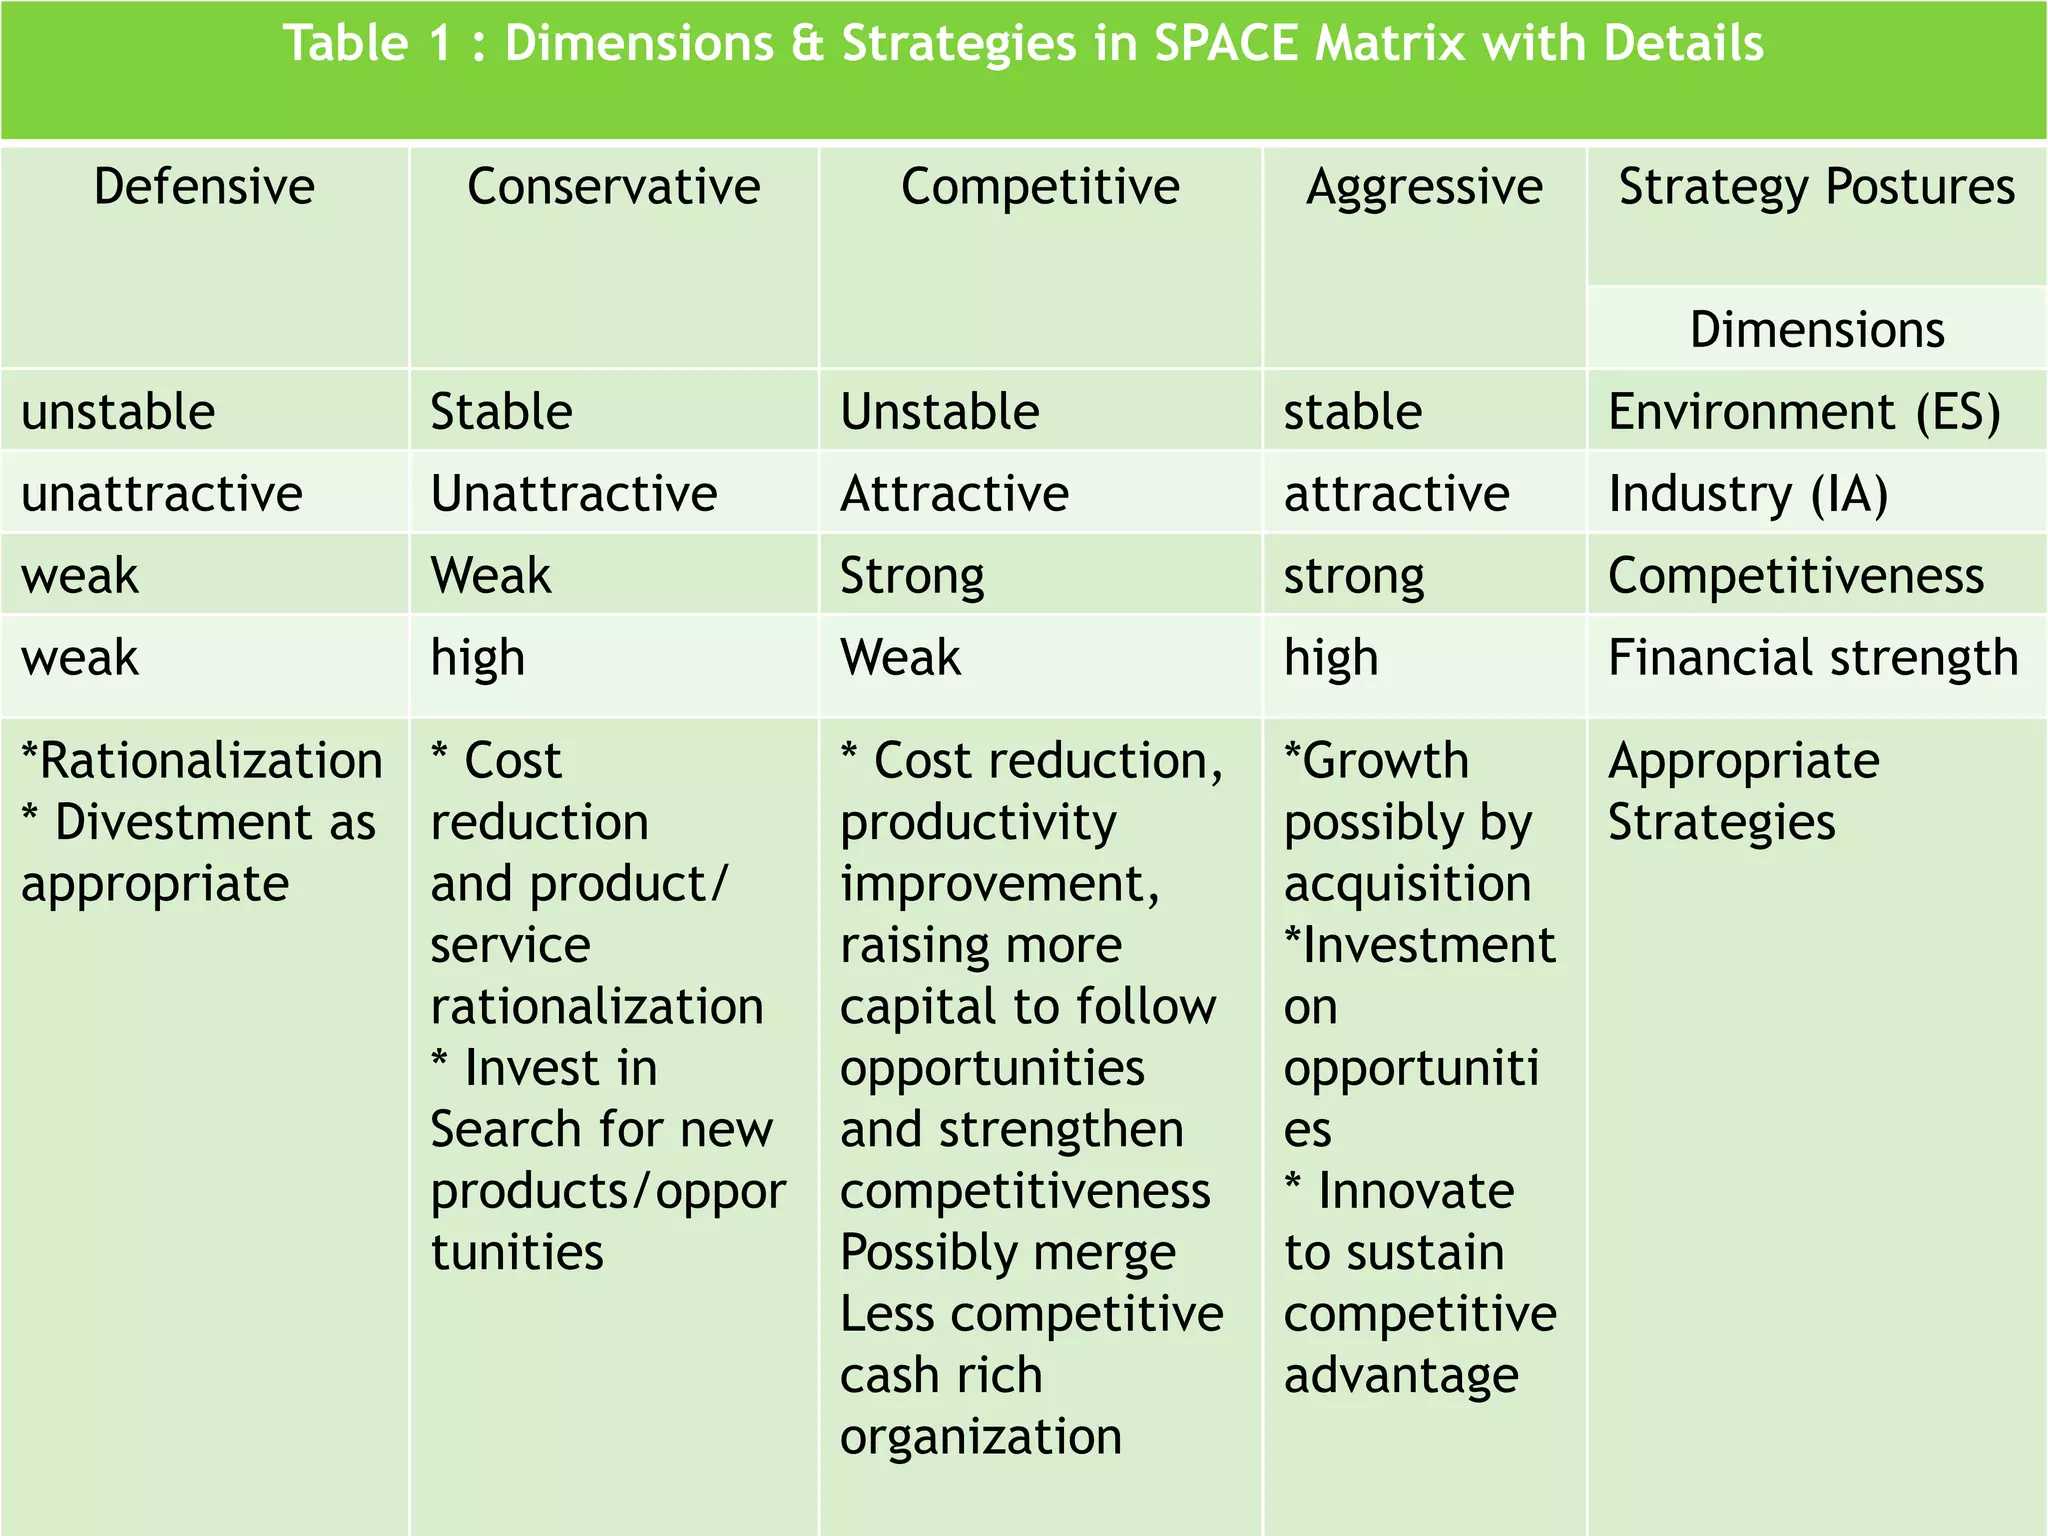
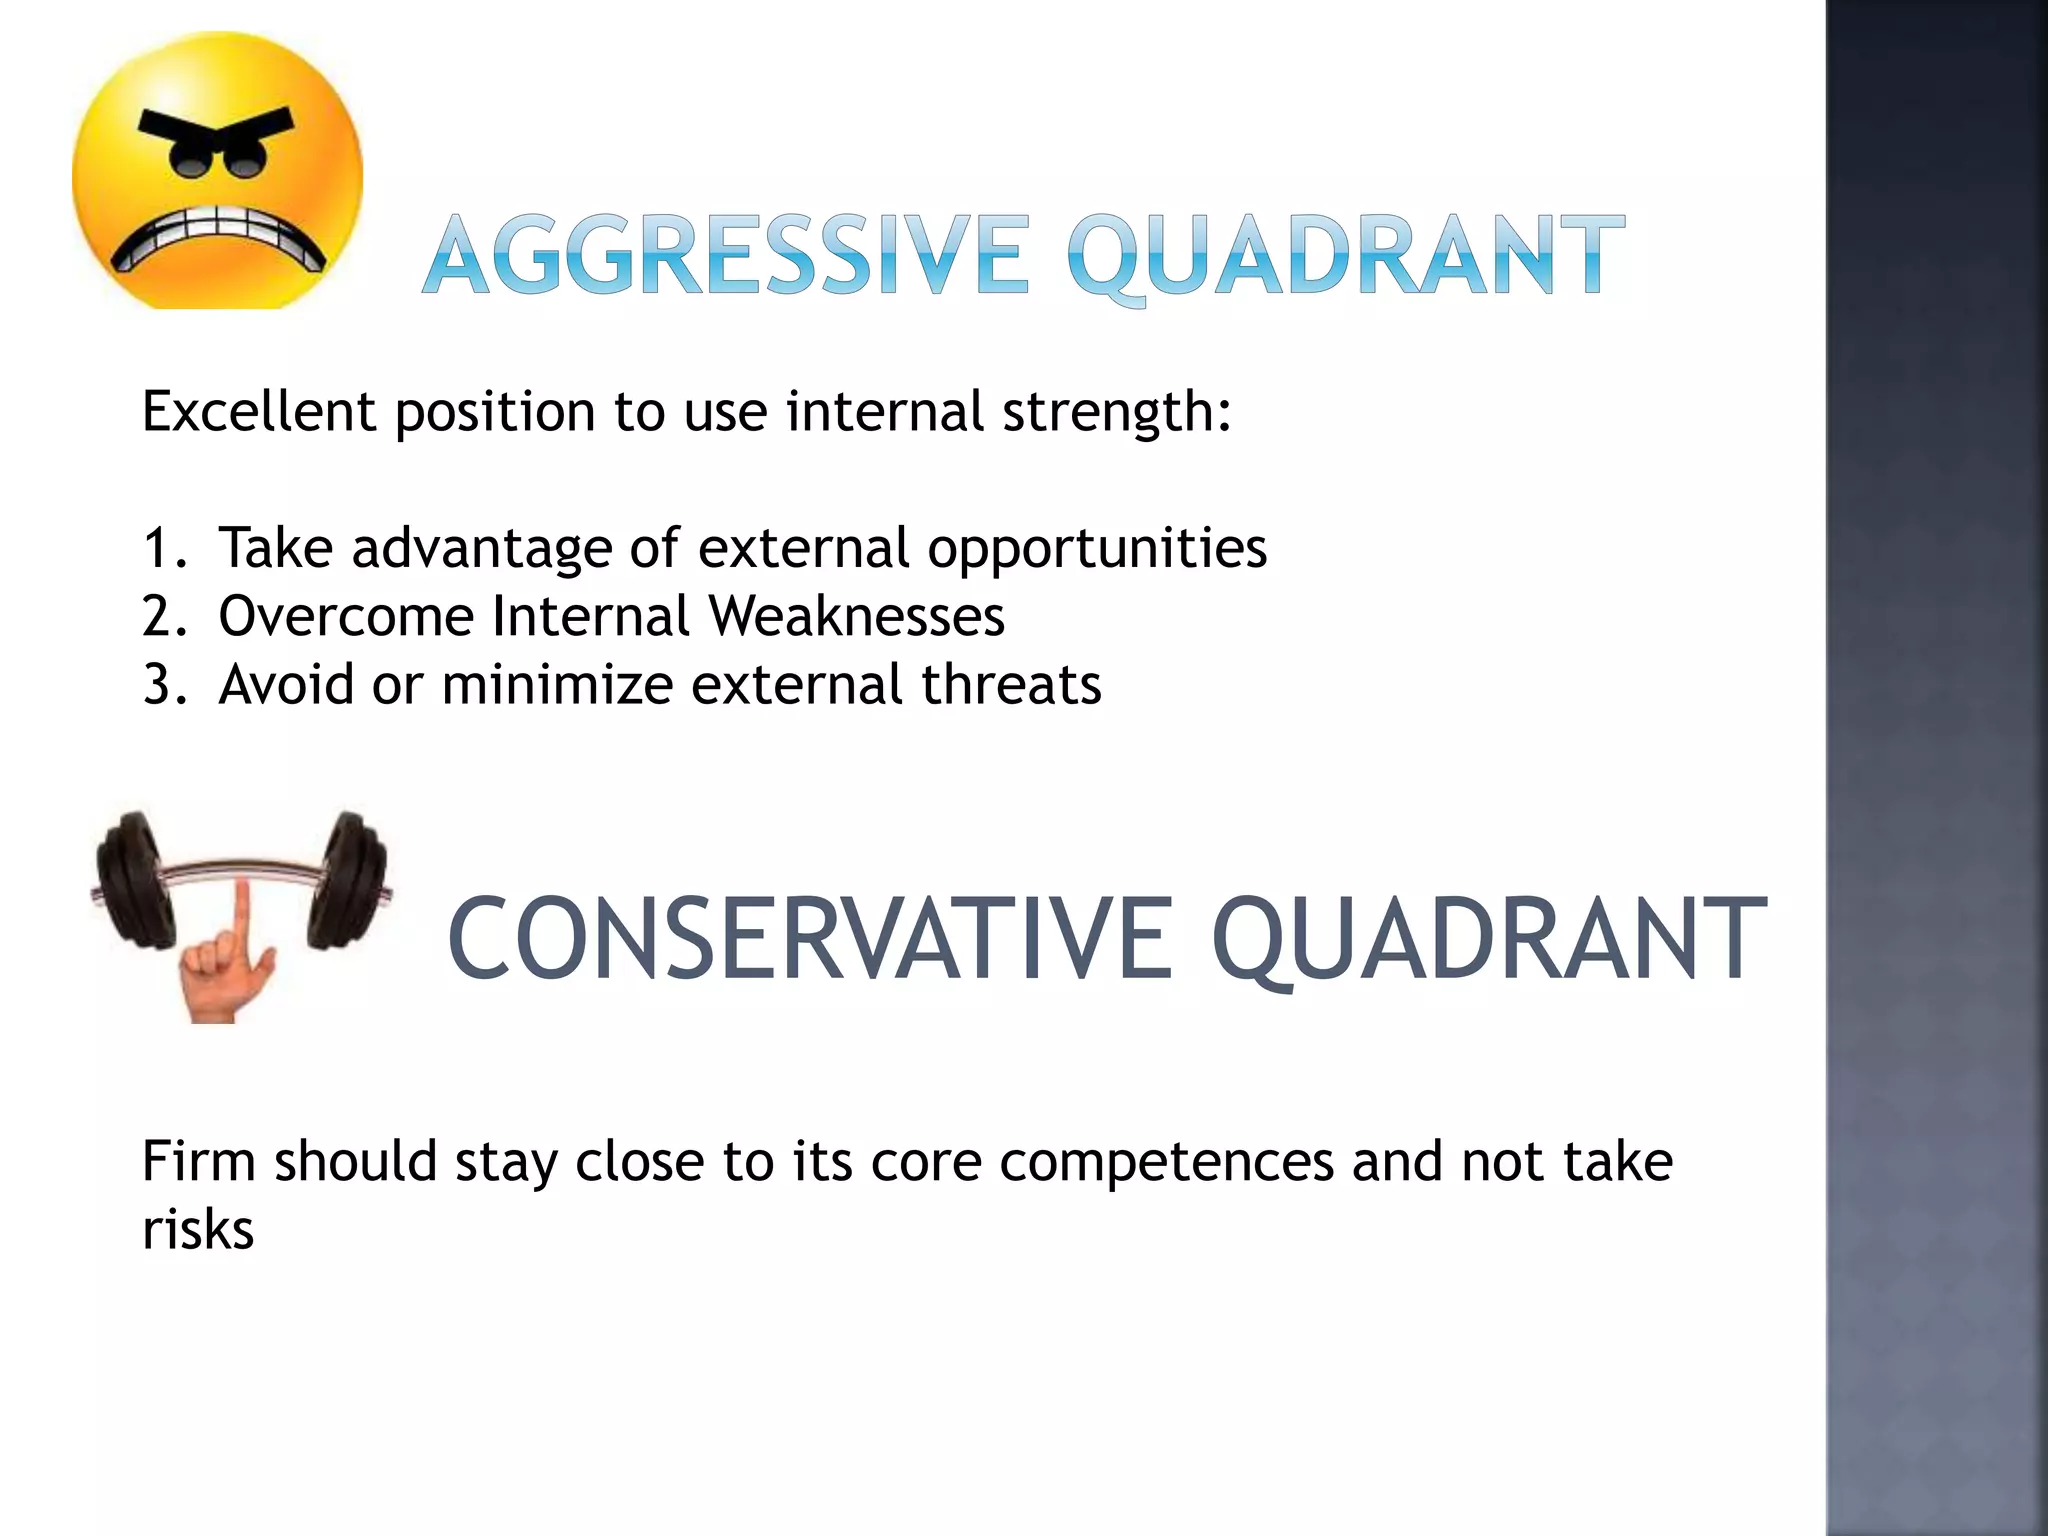
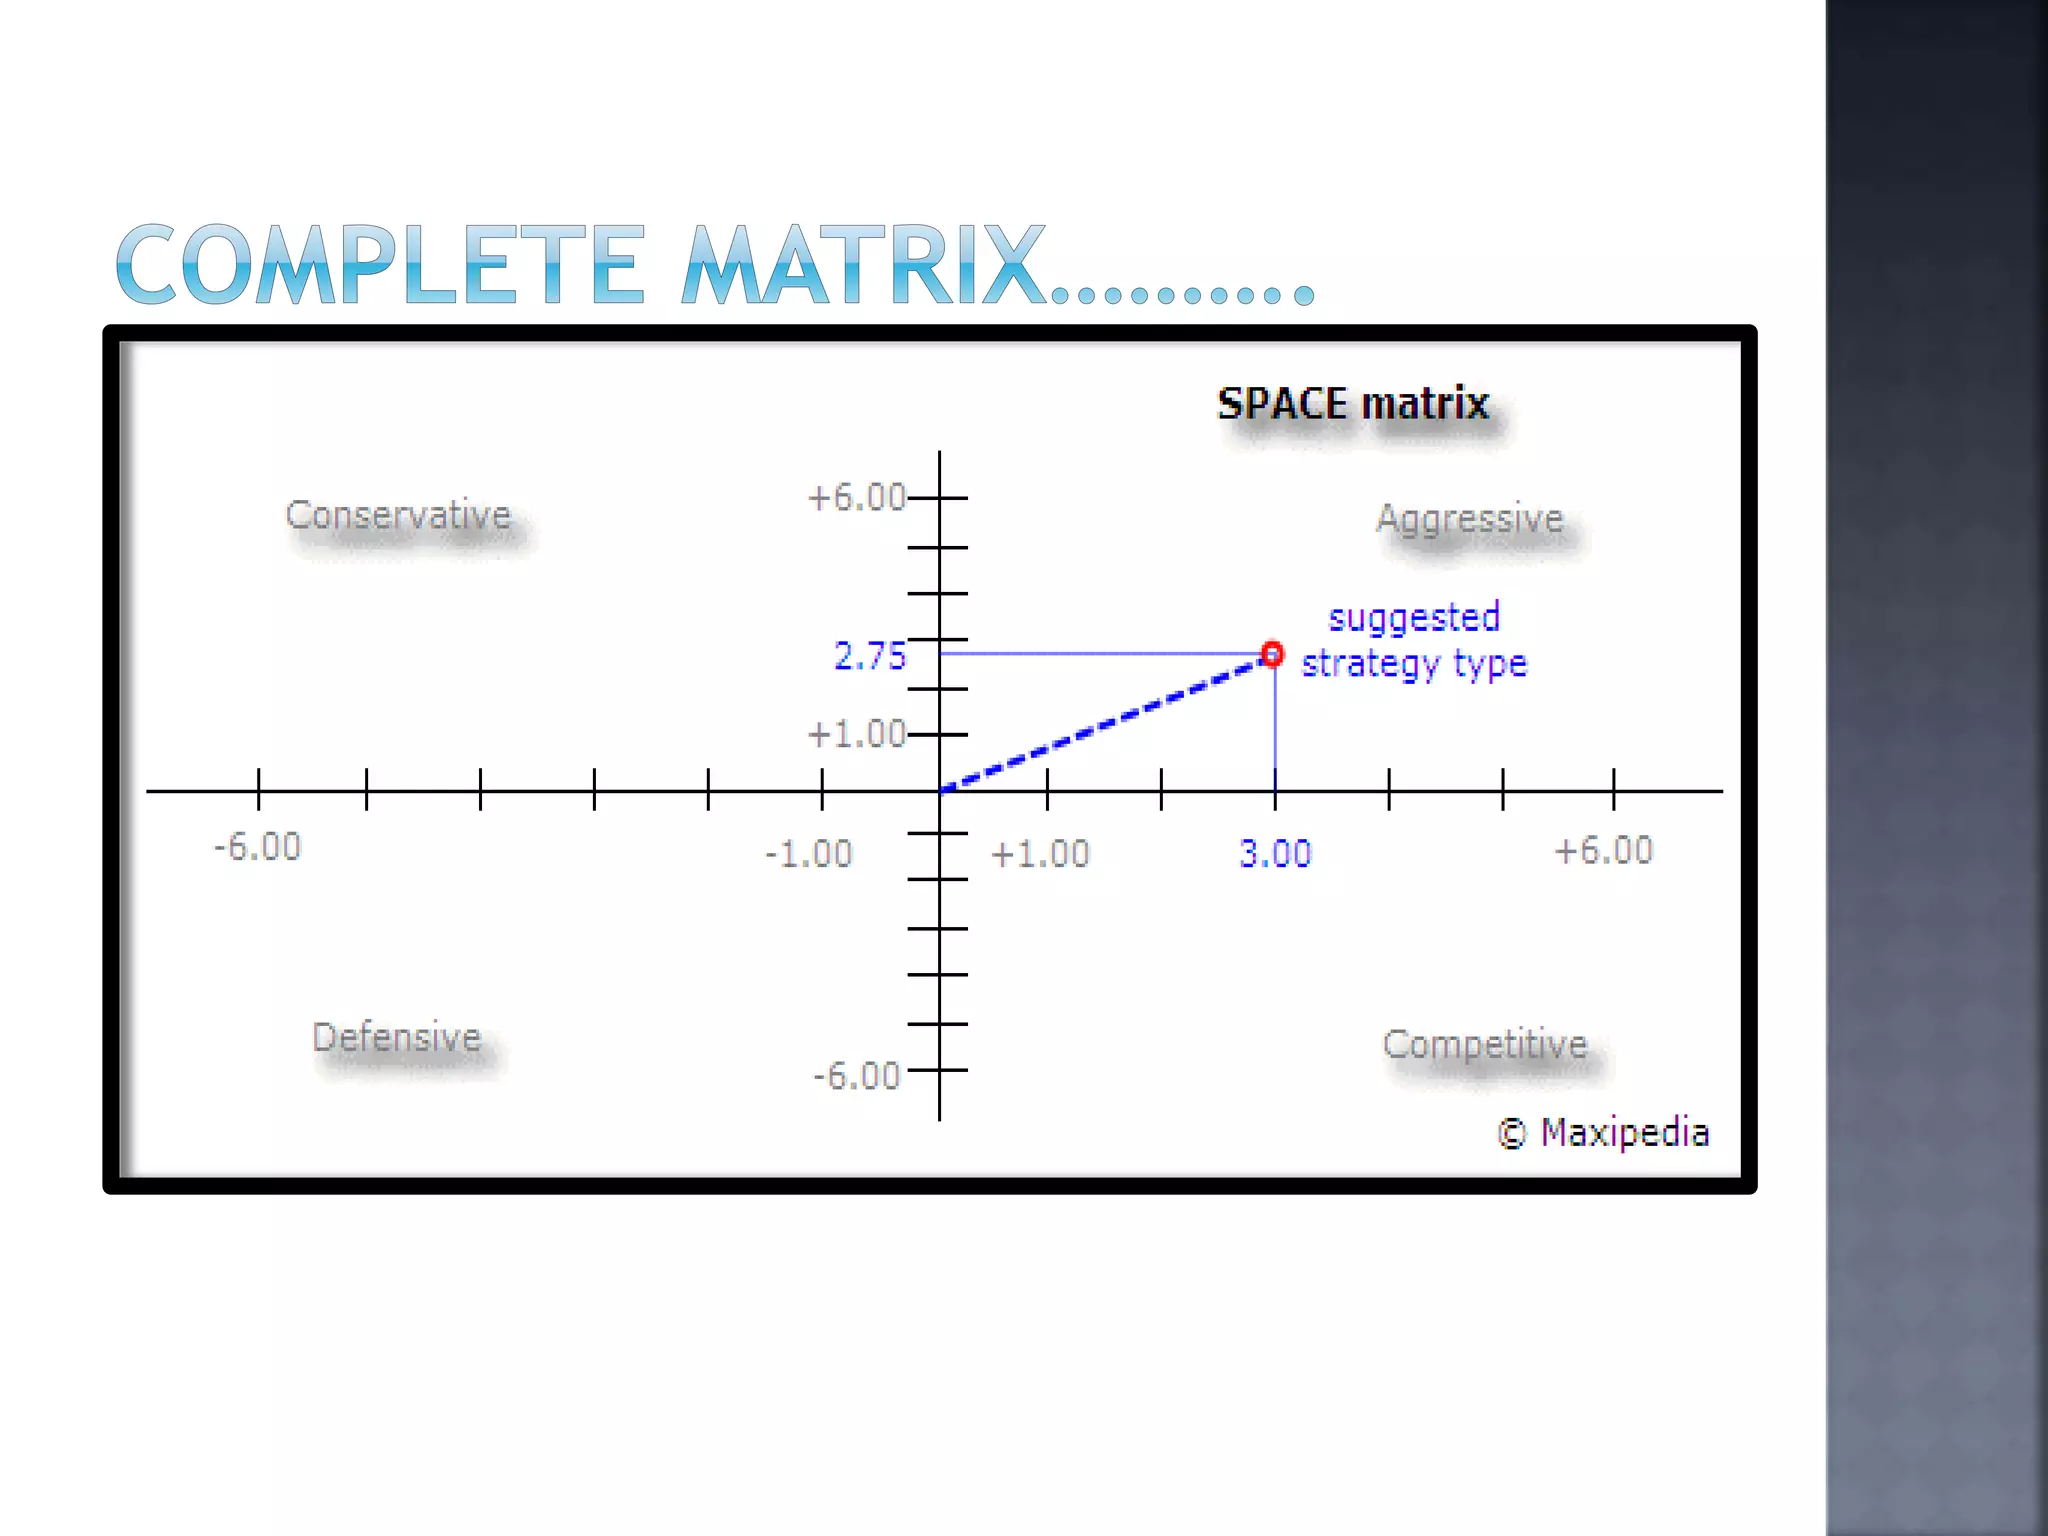
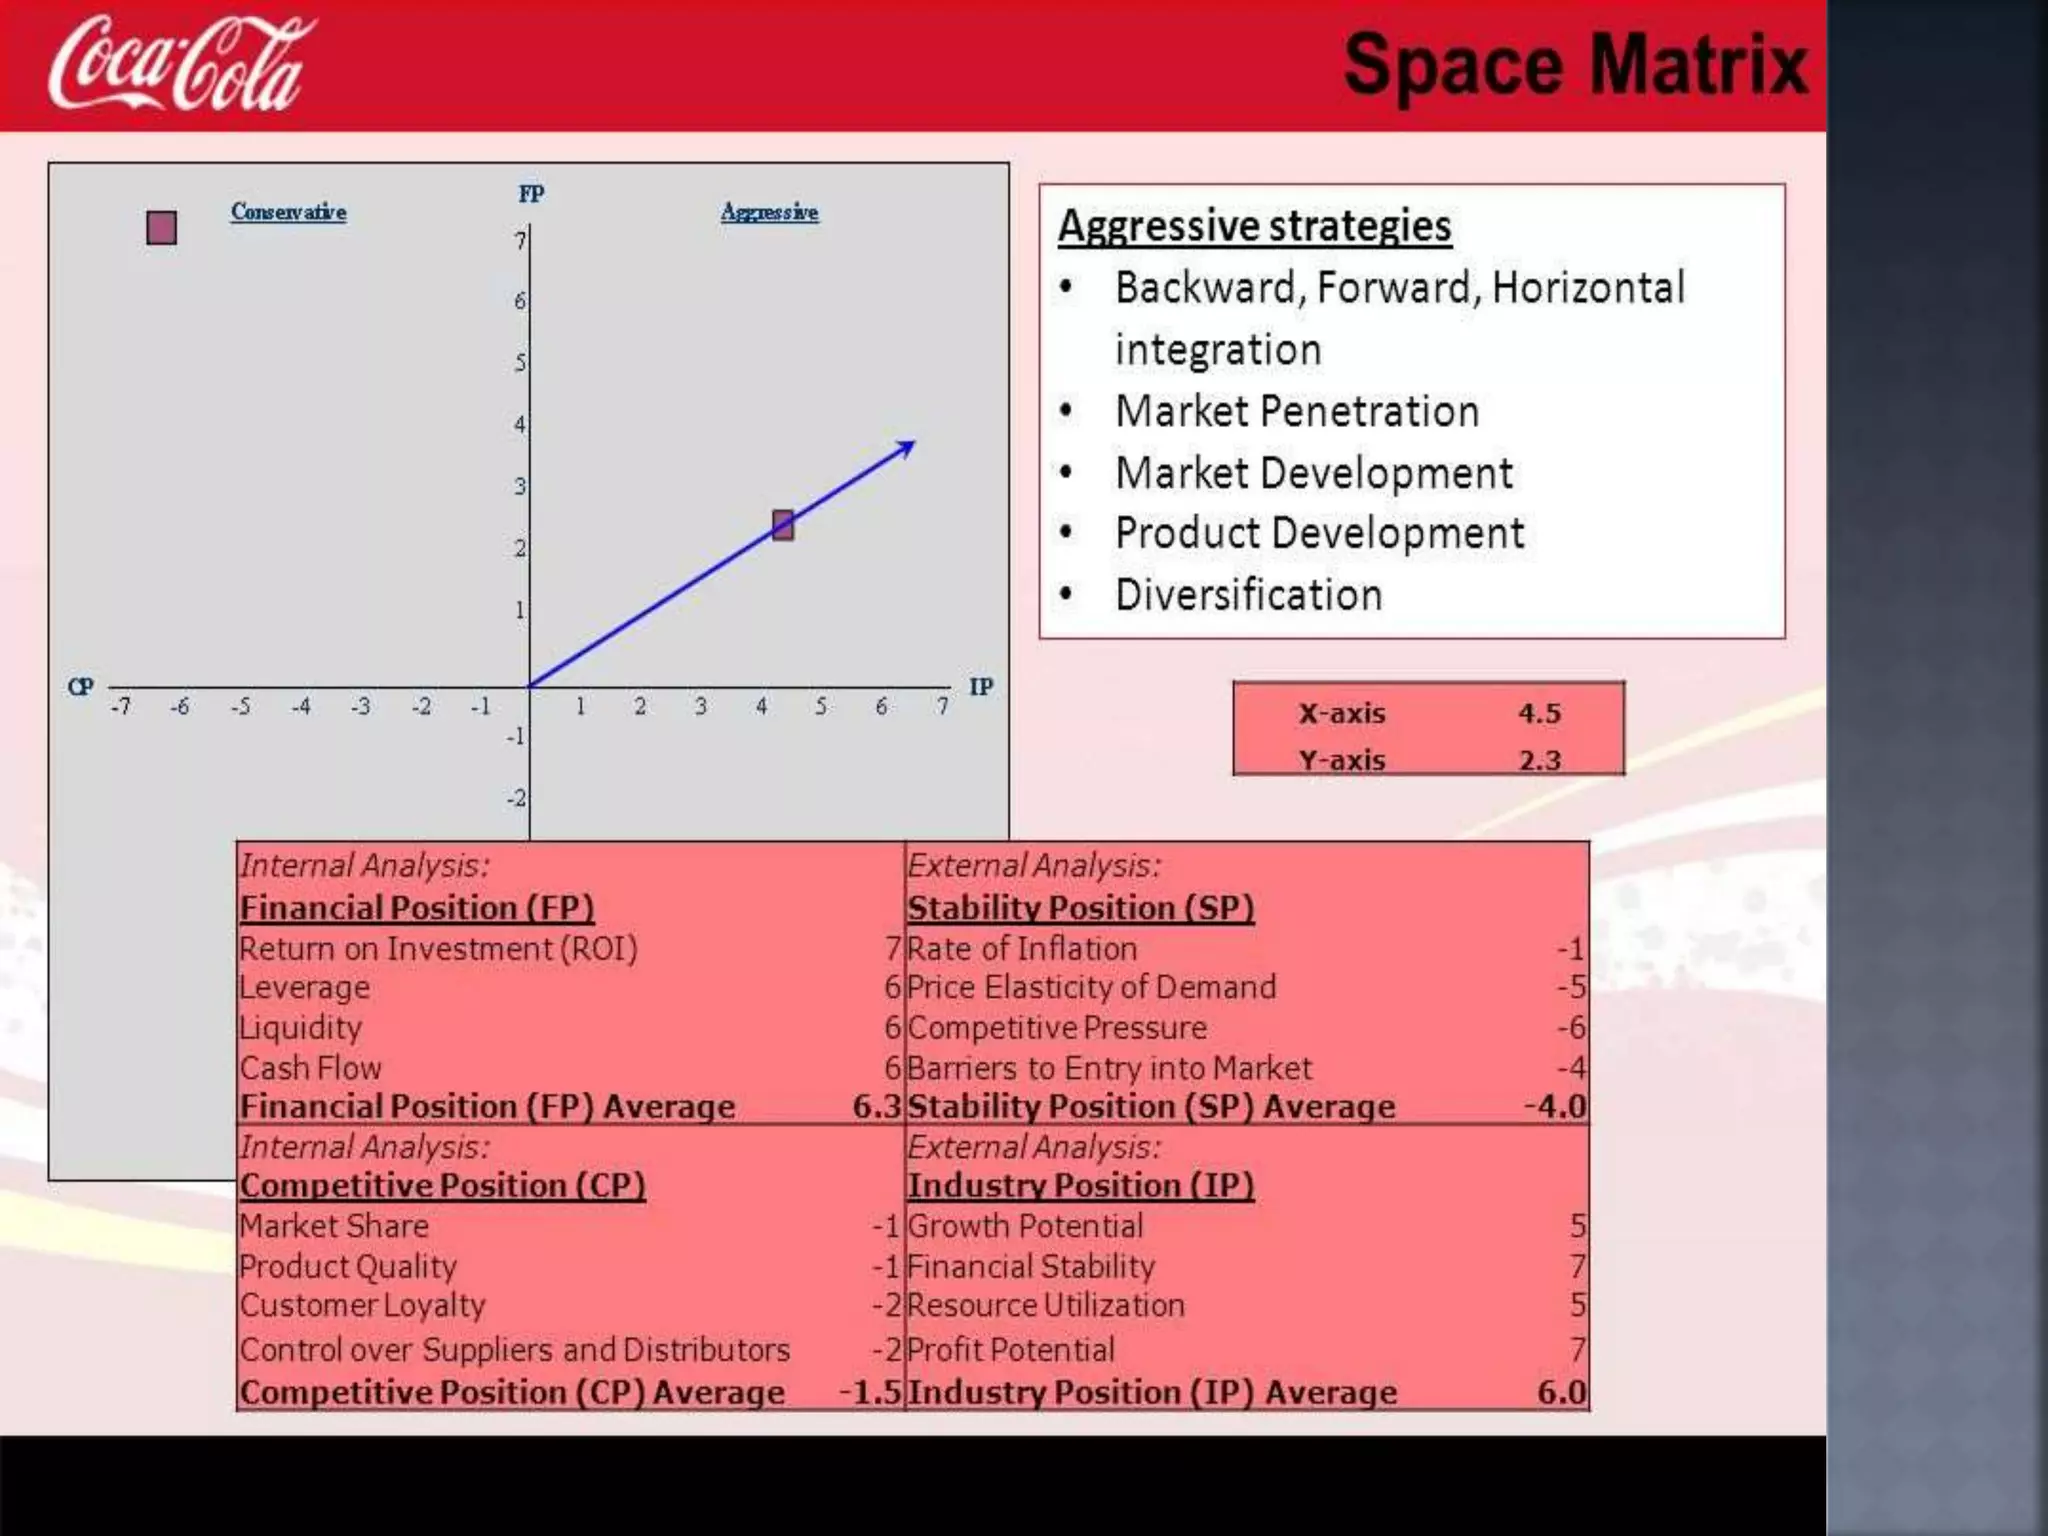
 Strategy models provide a common focus point for
discussion. The best strategies come of from the insight of
applying the strategy tools and the discussions that
happen within the management team and not as a direct
result of using the planning model. Strategy models
provides a common reference point. we can see a set of
conditions or even a particular symptom and you can
relate it back to the rest of the strategy model to
understand more about what is happening at the moment,
what is happening and perhaps what will happen.
 The most important thing in this it tries to answer how
can we determine our position in the competitive
environment to find a rational strategy based on this
method is strategic position and action
evaluation matrix.
 Any organization having its activity in an oligopoly
market, have to take into account the competition
existing in that market in order to survive.
 Competitive strategy is the search of favorable,
profitable and sustainable competitive position in a
market against the forces that determine the
competition in that market.
 Various methods have been proposed for that
purpose:
 the Boston Consulting Group (BCG) approach, Profit
Impact of Market Strategy (PIMS), Scenario
Planning, etc.
 Strategic Position and Action Evaluation matrix or
space analysis matrix is a super technique for
evaluating the sense and wisdom in a particular
strategic plan.
 It was developed by strategy academics” Alan
Rowe, Richard Mason, Karl Dickel, Richard Mann
and Robert Mockler”.
 The Strategic Position Evaluation (SPACE) analysis
framework is a very useful but not well known tool
to develop and review company’s strategy.
 The SPACE Matrix is a relatively easy to understand and use
method as a decision aid. It uses two internal dimensions , two
external dimensions

 To determine the organization’s strategic posture in the market
and determine its course of action. Each of these four dimensions
includes several factors assessed individually during the analysis
 - By definition, the CA and IS values in the
SPACE matrix are plotted on the X axis.
-CA values can range from -1 to -6.
- IS values can take +1 to +6.
 - The FS and ES dimensions of the model are
plotted on the Y axis.
- ES values can be between -1 and -6.
- FS values range from +1 to +6.
INTERNAL STRATEGIC POSITION EXTERNAL STRATEGIC POSITION
FINANCIAL POSITION COMPETITIVE
POSITION
STABILITY POSITION INDUSTRY
STRENGTH
Return on
investment
Market Share Technological
Changes
Profit Potential
Leverage Product Quality Rate of Inflation Financial Stability
Liquidity Product Life Cycle Demand Variability Extent Leveraged
Working Capital Customer Loyalty Place range of
competing products
Resource Utilization
Cash flow Capacity Utilization Barriers to entry
into the market
Ease of entry into
market
Inventory Turnover Technological Know-
how
Competitive
Pressure
Productivity,
capacity utilization
Earnings per share Control over
suppliers and
distributors
Ease of Exit from
market
Price Earnings Ratio Price Elasticity of
demand
Table 1 : Dimensions & Strategies in SPACE Matrix with Details
Defensive Conservative Competitive Aggressive Strategy Postures
Dimensions
unstable Stable Unstable stable Environment (ES)
unattractive Unattractive Attractive attractive Industry (IA)
weak Weak Strong strong Competitiveness
weak high Weak high Financial strength
*Rationalization
* Divestment as
appropriate
* Cost
reduction
and product/
service
rationalization
* Invest in
Search for new
products/oppor
tunities
* Cost reduction,
productivity
improvement,
raising more
capital to follow
opportunities
and strengthen
competitiveness
Possibly merge
Less competitive
cash rich
organization
*Growth
possibly by
acquisition
*Investment
on
opportuniti
es
* Innovate
to sustain
competitive
advantage
Appropriate
Strategies
Excellent position to use internal strength:
1. Take advantage of external opportunities
2. Overcome Internal Weaknesses
3. Avoid or minimize external threats
CONSERVATIVE QUADRANT
Firm should stay close to its core competences and not take
risks
Focus on rectifying internal weakness and external
threats
COMPETITIVE QUADRANT
Use Competitive strategies
 The SPACE matrix is constructed by plotting calculated
values for the competitive advantage (CA) and industry
strength (IS) dimensions on the X axis. The Y axis is based
on the environmental stability (ES) and financial strength
(FS) dimensions. The SPACE matrix can be created using the
following seven steps:
 Step 1: Choose a set of variables to be used to gauge the
competitive advantage (CA), industry strength (IS),
environmental stability (ES), and financial strength (FS).
 Step 2: Rate individual factors using rating system specific to
each dimension. Rate competitive advantage (CA) and
environmental stability (ES) using rating scale from -6
(worst) to -1 (best). Rate industry strength (IS) and financial
strength (FS) using rating scale from +1 (worst) to +6 (best).
 Step 3: Find the average scores for competitive advantage
(CA), industry strength (IS), environmental stability (ES),
and financial strength (FS).
 Step 4: Plot values from step 3 for each dimension
on the SPACE matrix on the appropriate axis.
 Step 5: Add the average score for the competitive
advantage (CA) and industry strength (IS)
dimensions. This will be your final point on axis X
on the SPACE matrix.
 Step 6: Add the average score for the SPACE matrix
environmental stability (ES) and financial strength
(FS) dimensions to find your final point on the axis
Y.
 Step 7: Find intersection of your X and Y points.
Draw a line from the center of the SPACE matrix to
your point. This line reveals the type of strategy
the company should pursue.
Prsentation on space matrix

Prsentation on space matrix

  • 2.
     Strategy modelsprovide a common focus point for discussion. The best strategies come of from the insight of applying the strategy tools and the discussions that happen within the management team and not as a direct result of using the planning model. Strategy models provides a common reference point. we can see a set of conditions or even a particular symptom and you can relate it back to the rest of the strategy model to understand more about what is happening at the moment, what is happening and perhaps what will happen.
  • 3.
     The mostimportant thing in this it tries to answer how can we determine our position in the competitive environment to find a rational strategy based on this method is strategic position and action evaluation matrix.
  • 4.
     Any organizationhaving its activity in an oligopoly market, have to take into account the competition existing in that market in order to survive.  Competitive strategy is the search of favorable, profitable and sustainable competitive position in a market against the forces that determine the competition in that market.  Various methods have been proposed for that purpose:  the Boston Consulting Group (BCG) approach, Profit Impact of Market Strategy (PIMS), Scenario Planning, etc.
  • 5.
     Strategic Positionand Action Evaluation matrix or space analysis matrix is a super technique for evaluating the sense and wisdom in a particular strategic plan.  It was developed by strategy academics” Alan Rowe, Richard Mason, Karl Dickel, Richard Mann and Robert Mockler”.  The Strategic Position Evaluation (SPACE) analysis framework is a very useful but not well known tool to develop and review company’s strategy.
  • 6.
     The SPACEMatrix is a relatively easy to understand and use method as a decision aid. It uses two internal dimensions , two external dimensions   To determine the organization’s strategic posture in the market and determine its course of action. Each of these four dimensions includes several factors assessed individually during the analysis
  • 7.
     - Bydefinition, the CA and IS values in the SPACE matrix are plotted on the X axis. -CA values can range from -1 to -6. - IS values can take +1 to +6.  - The FS and ES dimensions of the model are plotted on the Y axis. - ES values can be between -1 and -6. - FS values range from +1 to +6.
  • 10.
    INTERNAL STRATEGIC POSITIONEXTERNAL STRATEGIC POSITION FINANCIAL POSITION COMPETITIVE POSITION STABILITY POSITION INDUSTRY STRENGTH Return on investment Market Share Technological Changes Profit Potential Leverage Product Quality Rate of Inflation Financial Stability Liquidity Product Life Cycle Demand Variability Extent Leveraged Working Capital Customer Loyalty Place range of competing products Resource Utilization Cash flow Capacity Utilization Barriers to entry into the market Ease of entry into market Inventory Turnover Technological Know- how Competitive Pressure Productivity, capacity utilization Earnings per share Control over suppliers and distributors Ease of Exit from market Price Earnings Ratio Price Elasticity of demand
  • 11.
    Table 1 :Dimensions & Strategies in SPACE Matrix with Details Defensive Conservative Competitive Aggressive Strategy Postures Dimensions unstable Stable Unstable stable Environment (ES) unattractive Unattractive Attractive attractive Industry (IA) weak Weak Strong strong Competitiveness weak high Weak high Financial strength *Rationalization * Divestment as appropriate * Cost reduction and product/ service rationalization * Invest in Search for new products/oppor tunities * Cost reduction, productivity improvement, raising more capital to follow opportunities and strengthen competitiveness Possibly merge Less competitive cash rich organization *Growth possibly by acquisition *Investment on opportuniti es * Innovate to sustain competitive advantage Appropriate Strategies
  • 13.
    Excellent position touse internal strength: 1. Take advantage of external opportunities 2. Overcome Internal Weaknesses 3. Avoid or minimize external threats CONSERVATIVE QUADRANT Firm should stay close to its core competences and not take risks
  • 14.
    Focus on rectifyinginternal weakness and external threats COMPETITIVE QUADRANT Use Competitive strategies
  • 15.
     The SPACEmatrix is constructed by plotting calculated values for the competitive advantage (CA) and industry strength (IS) dimensions on the X axis. The Y axis is based on the environmental stability (ES) and financial strength (FS) dimensions. The SPACE matrix can be created using the following seven steps:  Step 1: Choose a set of variables to be used to gauge the competitive advantage (CA), industry strength (IS), environmental stability (ES), and financial strength (FS).  Step 2: Rate individual factors using rating system specific to each dimension. Rate competitive advantage (CA) and environmental stability (ES) using rating scale from -6 (worst) to -1 (best). Rate industry strength (IS) and financial strength (FS) using rating scale from +1 (worst) to +6 (best).  Step 3: Find the average scores for competitive advantage (CA), industry strength (IS), environmental stability (ES), and financial strength (FS).
  • 16.
     Step 4:Plot values from step 3 for each dimension on the SPACE matrix on the appropriate axis.  Step 5: Add the average score for the competitive advantage (CA) and industry strength (IS) dimensions. This will be your final point on axis X on the SPACE matrix.  Step 6: Add the average score for the SPACE matrix environmental stability (ES) and financial strength (FS) dimensions to find your final point on the axis Y.  Step 7: Find intersection of your X and Y points. Draw a line from the center of the SPACE matrix to your point. This line reveals the type of strategy the company should pursue.