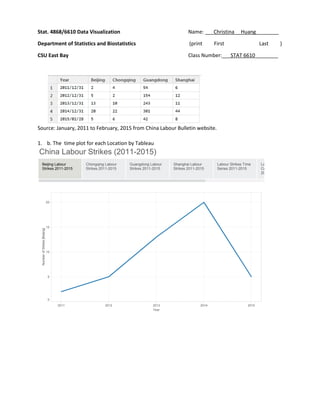
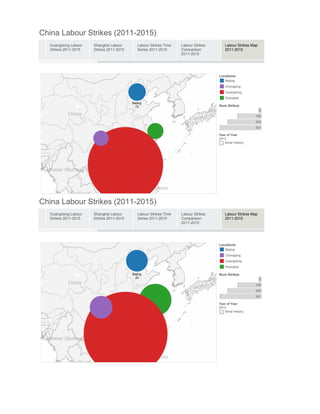
Stat. 4868/6610 Data Visualization Name: ___Christina Huang________
Department of Statistics and Biostatistics (print First Last )
CSU East Bay Class Number:___STAT 6610________
Source: January, 2011 to February, 2015 from China Labour Bulletin website.
1. b. The time plot for each Location by Tableau
China Labour Strikes (2011-2015)
Beijing Labour
Strikes 2011-2015
Chongqing Labour
Strikes 2011-2015
Guangdong Labour
Strikes 2011-2015
Shanghai Labour
Strikes 2011-2015
Labour Strikes Time
Series 2011-2015
Labour Strikes
Comparison
2011-2015
2011 2012 2013 2014 2015
Year
0
5
10
15
20
China Labour Strikes (2011-2015)
Beijing Labour
Strikes 2011-2015
Chongqing Labour
Strikes 2011-2015
Guangdong Labour
Strikes 2011-2015
Shanghai Labour
Strikes 2011-2015
Labour Strikes Time
Series 2011-2015
Labour Strikes
Comparison
2011-2015
2011 2012 2013 2014 2015
Year
0
5
10
15
20
China Labour Strikes (2011-2015)
Beijing Labour
Strikes 2011-2015
Chongqing Labour
Strikes 2011-2015
Guangdong Labour
Strikes 2011-2015
Shanghai Labour
Strikes 2011-2015
Labour Strikes Time
Series 2011-2015
Labour Strikes
Comparison
2011-2015
2011 2012 2013 2014 2015
Year
0
50
100
150
200
250
300
1. c. Nne plot with all four Locations on the time plot in different colors by Tableau
China Labour Strikes (2011-2015)
Chongqing Labour
Strikes 2011-2015
Guangdong Labour
Strikes 2011-2015
Shanghai Labour
Strikes 2011-2015
Labour Strikes Time
Series 2011-2015
Labour Strikes
Comparison
2011-2015
Labour Strikes Map
2011-2015
2011 2012 2013 2014 2015
Year
0
10
20
30
40
China Labour Strikes (2011-2015)
Guangdong Labour
Strikes 2011-2015
Shanghai Labour
Strikes 2011-2015
Labour Strikes Time
Series 2011-2015
Labour Strikes
Comparison
2011-2015
Labour Strikes Map
2011-2015
2011 2012 2013 2014 2015
Year
0
50
100
150
200
250
300
Shanghai
Guangdong
Locations
Beijing
Chongqing
Guangdong
Shanghai
1. d. The clustered bar graph for the data by Tableau.
Optional stacked up bar graph:
China Labour Strikes (2011-2015)
Guangdong Labour
Strikes 2011-2015
Shanghai Labour
Strikes 2011-2015
Labour Strikes Time
Series 2011-2015
Labour Strikes
Comparison
2011-2015
Labour Strikes Map
2011-2015
Year
2011 2012 2013 2014 2015
0
50
100
150
200
250
300
54
642
154
12
5 2
243
13 10 11
301
20
44
22
42
5 86
Measure Names
Beijing
Chongqing
Guangdong
Shanghai
1. e. The screen shots of each year from the dynamic bubble graph by Tableau are show below:
China Labour Strikes (2011-2015)
Guangdong Labour
Strikes 2011-2015
Shanghai Labour
Strikes 2011-2015
Labour Strikes Time
Series 2011-2015
Labour Strikes
Comparison
2011-2015
Labour Strikes Map
2011-2015
Guangdong
54
Shanghai
6
Beijing
2
Locations
Beijing
Chongqing
Guangdong
Shanghai
Num Strikes
2
100
200
301
Year of Year
2011
Show History
China Labour Strikes (2011-2015)
Guangdong Labour
Strikes 2011-2015
Shanghai Labour
Strikes 2011-2015
Labour Strikes Time
Series 2011-2015
Labour Strikes
Comparison
2011-2015
Labour Strikes Map
2011-2015
Beijing
5
Locations
Beijing
Chongqing
Guangdong
Shanghai
Num Strikes
2
100
200
301
Year of Year
2012
Show History
China Labour Strikes (2011-2015)
Guangdong Labour
Strikes 2011-2015
Shanghai Labour
Strikes 2011-2015
Labour Strikes Time
Series 2011-2015
Labour Strikes
Comparison
2011-2015
Labour Strikes Map
2011-2015
Beijing
13
Locations
Beijing
Chongqing
Guangdong
Shanghai
Num Strikes
2
100
200
301
Year of Year
2013
Show History
China Labour Strikes (2011-2015)
Guangdong Labour
Strikes 2011-2015
Shanghai Labour
Strikes 2011-2015
Labour Strikes Time
Series 2011-2015
Labour Strikes
Comparison
2011-2015
Labour Strikes Map
2011-2015
Beijing
20
Locations
Beijing
Chongqing
Guangdong
Shanghai
Num Strikes
2
100
200
301
Year of Year
2014
Show History
China Labour Strikes (2011-2015)
Guangdong Labour
Strikes 2011-2015
Shanghai Labour
Strikes 2011-2015
Labour Strikes Time
Series 2011-2015
Labour Strikes
Comparison
2011-2015
Labour Strikes Map
2011-2015
Guangdong
42
Chongqing
6
Shanghai
8
Beijing
5
Locations
Beijing
Chongqing
Guangdong
Shanghai
Num Strikes
2
100
200
301
Year of Year
2015
Show History
2. The screen shots of each year from the dynamic bubble graph using google Chart Tools are shown
below:
Appendix
1. The data were collected from January, 2011 to February, 2015 from China Labour Bulletin
(http://maps.clb.org.hk/strikes/en). Data were recorded as monthly and saved in Excel spreadsheet
format. Two data sets (labour.csv and labour.alt.csv) were then generated by R codes to created plots in
Tableau.
# Project 01
#install.packages("xlsx", dependencies=TRUE)
#install.packages("lubridate", dependencies=TRUE)
#install.packages("zoo")
library(xlsx)
library(lubridate)
library(zoo)
# 1a.
strikes = read.xlsx("I:/STAT6610/Homework/project1/proj01_strikes.xlsx", sheetName="Labour",
as.data.frame=TRUE,header=TRUE)
# calculate strikes by year by locations
# This is to make one plot with all four Locations on the time plot in different colors.
# Also for dynamic bubble graph and stacked up bar graph.
year=rep(c("2011/12/31","2012/12/31","2013/12/31","2014/12/31", "2015/02/28"),4)
locations=rep(c("Beijing","Chongqing","Guangdong","Shanghai"),each=5)
num_strikes=numeric(length(year))
for (i in 1:length(year))
{
num_strikes[i]=sum(strikes$Strikes[which(year(strikes$Date)==year(year[i])
& (strikes$Locations==locations[i]))])
}
labour=data.frame(year, locations, num_strikes)
write.csv(labour, "I:/STAT6610/Homework/project1/labour.csv",row.names=FALSE )
# create another data set for individual bar graph and cluster bar graph
Year=c("2011/12/31","2012/12/31","2013/12/31","2014/12/31", "2015/02/28")
Beijing=num_strikes[1:5]
Chongqing=num_strikes[6:10]
Guangdong=num_strikes[11:15]
Shanghai=num_strikes[16:20]
labour.alt=data.frame(Year,Beijing,Chongqing,Guangdong,Shanghai)
write.csv(labour.alt, "I:/STAT6610/Homework/project1/labour.alt.csv",row.names=FALSE)
labour.csv
2. R code to produce the dynamic bubble graph using google Chart Tools.
install.packages("googleVis")
library(googleVis)
labour=read.csv("I:/STAT6610/Homework/project1/labour.csv",header=TRUE,sep=",")
# create another data set for dynamic bubble graph using google Chart Tools
Year = year(labour$year)
locations=labour$locations
num_strikes=labour$num_strikes
labour.g=data.frame(locations, Year, num_strikes)
M1 <- gvisMotionChart(labour.g, idvar="locations", timevar="Year",
sizevar="num_strikes")
plot(M1)

proj_plots

  • 1.
    Stat. 4868/6610 DataVisualization Name: ___Christina Huang________ Department of Statistics and Biostatistics (print First Last ) CSU East Bay Class Number:___STAT 6610________ Source: January, 2011 to February, 2015 from China Labour Bulletin website. 1. b. The time plot for each Location by Tableau China Labour Strikes (2011-2015) Beijing Labour Strikes 2011-2015 Chongqing Labour Strikes 2011-2015 Guangdong Labour Strikes 2011-2015 Shanghai Labour Strikes 2011-2015 Labour Strikes Time Series 2011-2015 Labour Strikes Comparison 2011-2015 2011 2012 2013 2014 2015 Year 0 5 10 15 20
  • 2.
    China Labour Strikes(2011-2015) Beijing Labour Strikes 2011-2015 Chongqing Labour Strikes 2011-2015 Guangdong Labour Strikes 2011-2015 Shanghai Labour Strikes 2011-2015 Labour Strikes Time Series 2011-2015 Labour Strikes Comparison 2011-2015 2011 2012 2013 2014 2015 Year 0 5 10 15 20 China Labour Strikes (2011-2015) Beijing Labour Strikes 2011-2015 Chongqing Labour Strikes 2011-2015 Guangdong Labour Strikes 2011-2015 Shanghai Labour Strikes 2011-2015 Labour Strikes Time Series 2011-2015 Labour Strikes Comparison 2011-2015 2011 2012 2013 2014 2015 Year 0 50 100 150 200 250 300
  • 3.
    1. c. Nneplot with all four Locations on the time plot in different colors by Tableau China Labour Strikes (2011-2015) Chongqing Labour Strikes 2011-2015 Guangdong Labour Strikes 2011-2015 Shanghai Labour Strikes 2011-2015 Labour Strikes Time Series 2011-2015 Labour Strikes Comparison 2011-2015 Labour Strikes Map 2011-2015 2011 2012 2013 2014 2015 Year 0 10 20 30 40 China Labour Strikes (2011-2015) Guangdong Labour Strikes 2011-2015 Shanghai Labour Strikes 2011-2015 Labour Strikes Time Series 2011-2015 Labour Strikes Comparison 2011-2015 Labour Strikes Map 2011-2015 2011 2012 2013 2014 2015 Year 0 50 100 150 200 250 300 Shanghai Guangdong Locations Beijing Chongqing Guangdong Shanghai
  • 4.
    1. d. Theclustered bar graph for the data by Tableau. Optional stacked up bar graph: China Labour Strikes (2011-2015) Guangdong Labour Strikes 2011-2015 Shanghai Labour Strikes 2011-2015 Labour Strikes Time Series 2011-2015 Labour Strikes Comparison 2011-2015 Labour Strikes Map 2011-2015 Year 2011 2012 2013 2014 2015 0 50 100 150 200 250 300 54 642 154 12 5 2 243 13 10 11 301 20 44 22 42 5 86 Measure Names Beijing Chongqing Guangdong Shanghai
  • 5.
    1. e. Thescreen shots of each year from the dynamic bubble graph by Tableau are show below: China Labour Strikes (2011-2015) Guangdong Labour Strikes 2011-2015 Shanghai Labour Strikes 2011-2015 Labour Strikes Time Series 2011-2015 Labour Strikes Comparison 2011-2015 Labour Strikes Map 2011-2015 Guangdong 54 Shanghai 6 Beijing 2 Locations Beijing Chongqing Guangdong Shanghai Num Strikes 2 100 200 301 Year of Year 2011 Show History China Labour Strikes (2011-2015) Guangdong Labour Strikes 2011-2015 Shanghai Labour Strikes 2011-2015 Labour Strikes Time Series 2011-2015 Labour Strikes Comparison 2011-2015 Labour Strikes Map 2011-2015 Beijing 5 Locations Beijing Chongqing Guangdong Shanghai Num Strikes 2 100 200 301 Year of Year 2012 Show History
  • 6.
    China Labour Strikes(2011-2015) Guangdong Labour Strikes 2011-2015 Shanghai Labour Strikes 2011-2015 Labour Strikes Time Series 2011-2015 Labour Strikes Comparison 2011-2015 Labour Strikes Map 2011-2015 Beijing 13 Locations Beijing Chongqing Guangdong Shanghai Num Strikes 2 100 200 301 Year of Year 2013 Show History China Labour Strikes (2011-2015) Guangdong Labour Strikes 2011-2015 Shanghai Labour Strikes 2011-2015 Labour Strikes Time Series 2011-2015 Labour Strikes Comparison 2011-2015 Labour Strikes Map 2011-2015 Beijing 20 Locations Beijing Chongqing Guangdong Shanghai Num Strikes 2 100 200 301 Year of Year 2014 Show History
  • 7.
    China Labour Strikes(2011-2015) Guangdong Labour Strikes 2011-2015 Shanghai Labour Strikes 2011-2015 Labour Strikes Time Series 2011-2015 Labour Strikes Comparison 2011-2015 Labour Strikes Map 2011-2015 Guangdong 42 Chongqing 6 Shanghai 8 Beijing 5 Locations Beijing Chongqing Guangdong Shanghai Num Strikes 2 100 200 301 Year of Year 2015 Show History
  • 8.
    2. The screenshots of each year from the dynamic bubble graph using google Chart Tools are shown below:
  • 11.
    Appendix 1. The datawere collected from January, 2011 to February, 2015 from China Labour Bulletin (http://maps.clb.org.hk/strikes/en). Data were recorded as monthly and saved in Excel spreadsheet format. Two data sets (labour.csv and labour.alt.csv) were then generated by R codes to created plots in Tableau. # Project 01 #install.packages("xlsx", dependencies=TRUE) #install.packages("lubridate", dependencies=TRUE) #install.packages("zoo") library(xlsx) library(lubridate) library(zoo) # 1a. strikes = read.xlsx("I:/STAT6610/Homework/project1/proj01_strikes.xlsx", sheetName="Labour", as.data.frame=TRUE,header=TRUE) # calculate strikes by year by locations # This is to make one plot with all four Locations on the time plot in different colors. # Also for dynamic bubble graph and stacked up bar graph. year=rep(c("2011/12/31","2012/12/31","2013/12/31","2014/12/31", "2015/02/28"),4) locations=rep(c("Beijing","Chongqing","Guangdong","Shanghai"),each=5) num_strikes=numeric(length(year)) for (i in 1:length(year)) { num_strikes[i]=sum(strikes$Strikes[which(year(strikes$Date)==year(year[i]) & (strikes$Locations==locations[i]))]) } labour=data.frame(year, locations, num_strikes) write.csv(labour, "I:/STAT6610/Homework/project1/labour.csv",row.names=FALSE ) # create another data set for individual bar graph and cluster bar graph Year=c("2011/12/31","2012/12/31","2013/12/31","2014/12/31", "2015/02/28") Beijing=num_strikes[1:5] Chongqing=num_strikes[6:10] Guangdong=num_strikes[11:15] Shanghai=num_strikes[16:20] labour.alt=data.frame(Year,Beijing,Chongqing,Guangdong,Shanghai) write.csv(labour.alt, "I:/STAT6610/Homework/project1/labour.alt.csv",row.names=FALSE)
  • 12.
    labour.csv 2. R codeto produce the dynamic bubble graph using google Chart Tools. install.packages("googleVis") library(googleVis) labour=read.csv("I:/STAT6610/Homework/project1/labour.csv",header=TRUE,sep=",") # create another data set for dynamic bubble graph using google Chart Tools Year = year(labour$year) locations=labour$locations num_strikes=labour$num_strikes labour.g=data.frame(locations, Year, num_strikes) M1 <- gvisMotionChart(labour.g, idvar="locations", timevar="Year", sizevar="num_strikes") plot(M1)