Download as PDF, PPTX


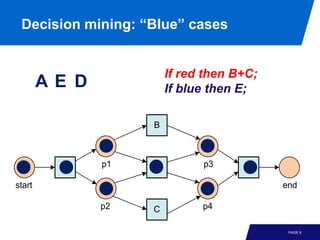

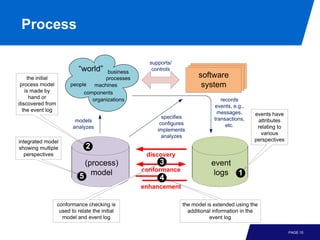


This document discusses mining additional perspectives from event logs beyond the initial process model. It describes how event logs contain attributes relating to various perspectives like resources, time, cases, and costs. These additional attributes can be analyzed and visualized using techniques like social network analysis, resource behavior analysis, and decision mining to gain additional insights into the process. Classification techniques can also be applied to the event data to understand reasons for decisions, delays, or non-conformance in the process.


