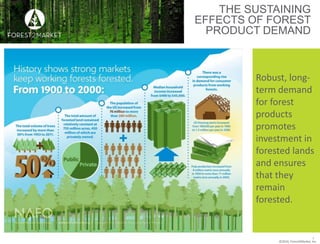
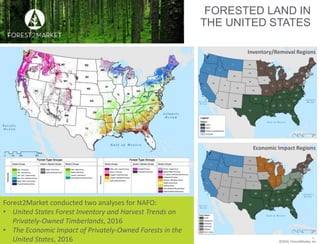
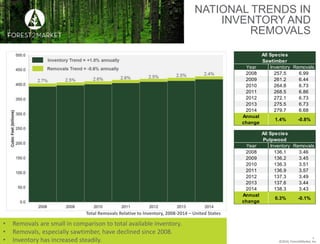
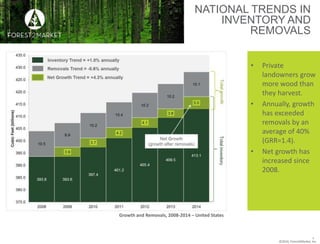
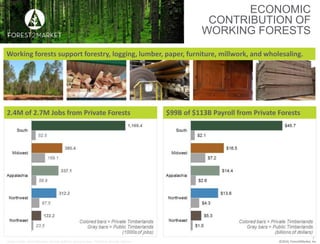
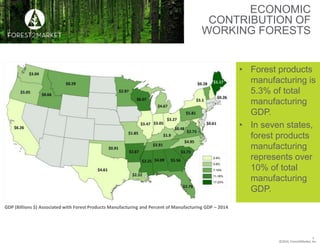
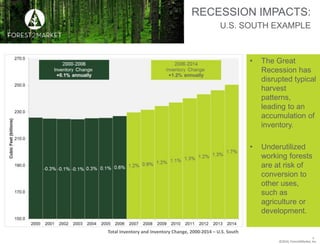
©2016, Forest2Market, Inc.
PRIVATE WORKING FORESTS:
RECENT TRENDS AND ECONOMIC IMPACT
HANNAH M. JEFFERIES
TIMBER AND FIBER MARKET ANALYST
JUNE 28, 2016
©2016, Forest2Market, Inc.
FOREST2MARKET
INTRODUCTION
Forest2Market serves industries
that consume wood raw materials:
• Wood products, pulp and paper
products and lumber manufacturers
• Bioenergy, biofuels and biochemical
producers
2
Forest2Market is a neutral third-party, independent in ownership and structure.
While actively involved in the industries we serve,
we do not buy or sell timberland, timber, lumber or biomass.
©2016, Forest2Market, Inc.
THE SUSTAINING
EFFECTS OF FOREST
PRODUCT DEMAND
3
Robust, long-
term demand
for forest
products
promotes
investment in
forested lands
and ensures
that they
remain
forested.
©2016, Forest2Market, Inc.
FORESTED LAND IN
THE UNITED STATES
4
Forest2Market conducted two analyses for NAFO:
• United States Forest Inventory and Harvest Trends on
Privately-Owned Timberlands, 2016
• The Economic Impact of Privately-Owned Forests in the
United States, 2016
Economic Impact Regions
Inventory/Removal Regions
©2016, Forest2Market, Inc.
NATIONAL TRENDS IN
INVENTORY AND
REMOVALS
5
Total Removals Relative to Inventory, 2008-2014 – United States
Year Inventory Removals
2008 257.5 6.99
2009 261.2 6.44
2010 264.8 6.73
2011 268.5 6.86
2012 272.1 6.73
2013 275.5 6.73
2014 279.7 6.68
Annual
change
1.4% -0.8%
Year Inventory Removals
2008 136.1 3.46
2009 136.2 3.45
2010 136.3 3.51
2011 136.9 3.57
2012 137.3 3.49
2013 137.6 3.44
2014 138.3 3.43
Annual
change
0.3% -0.1%
All Species
Sawtimber
All Species
Pulpwood
• Removals are small in comparison to total available inventory.
• Removals, especially sawtimber, have declined since 2008.
• Inventory has increased steadily.
©2016, Forest2Market, Inc.
NATIONAL TRENDS IN
INVENTORY AND
REMOVALS
• Private
landowners grow
more wood than
they harvest.
• Annually, growth
has exceeded
removals by an
average of 40%
(GRR=1.4).
• Net growth has
increased since
2008.
6
Growth and Removals, 2008-2014 – United States
©2016, Forest2Market, Inc.
Working forests support forestry, logging, lumber, paper, furniture, millwork, and wholesaling.
ECONOMIC
CONTRIBUTION OF
WORKING FORESTS
7
Image credits: Forest2Market, Hannah Jefferies, group2runner, Fletcher6, Hannah Jefferies.
2.4M of 2.7M Jobs from Private Forests $99B of $113B Payroll from Private Forests
©2016, Forest2Market, Inc.
ECONOMIC
CONTRIBUTION OF
WORKING FORESTS
• Forest products
manufacturing is
5.3% of total
manufacturing
GDP.
• In seven states,
forest products
manufacturing
represents over
10% of total
manufacturing
GDP.
8
GDP (Billions $) Associated with Forest Products Manufacturing and Percent of Manufacturing GDP – 2014
©2016, Forest2Market, Inc.
RECESSION IMPACTS:
U.S. SOUTH EXAMPLE
• The Great
Recession has
disrupted typical
harvest
patterns,
leading to an
accumulation of
inventory.
• Underutilized
working forests
are at risk of
conversion to
other uses,
such as
agriculture or
development.
9
Total Inventory and Inventory Change, 2000-2014 – U.S. South
©2016, Forest2Market, Inc.
CONCLUSION
10
• Demand from wood-consuming industries encourages landowners to
maintain healthy and productive working forests.
• Working forests and the industries that rely on them for raw material
inputs are critical to local economies, especially in rural areas.
• Declining demand places working forests at risk of conversion to other
land uses that lack the benefits of working forests.
©2016, Forest2Market, Inc.
CONTACT AND MORE
INFORMATION
Hannah M. Jefferies
Timber and Fiber Market Analyst
+1.980.233.4036
hannah.jefferies@forest2market.com
Forest2Market, Inc.
15720 Brixham Hill Ave
Suite 550
Charlotte, NC 28277
Forest2Market, Inc. 2016. United States Forest Inventory and Harvest Trends on Privately-
Owned Timberlands. Charlotte, NC. Accessible at
http://www.nafoalliance.org/images/issues/carbon/resources/F2M-inventory-harvest-
trends-20160620.pdf
Forest2Market, Inc. 2016. The Economic Impact of Privately-Owned Forests in the United
States. Charlotte, NC. Accessible at http://www.nafoalliance.org/images/documents/task-
groups/communications/Forest2Market_Economic_Impact_of_Privately-
Owned_Forests_April_2016.pdf
11
©2016, Forest2Market, Inc.
TERMINOLOGY
• Timberland: Forest capable of producing 20 cubic feet of wood per acre annually
at culmination of mean annual increment. Excludes reserved forestland.
• Private Owner: Non-industrial private forest (NIPF) landowners, corporate
entities (TIMOs, REITs, and integrated forest products companies), Native
Americans, NGOs and unincorporated local partnerships, associations or clubs
• Inventory: Volume of growing-stock trees
• Removals: Volume of trees that have been removed since the previous
inventory. Includes cut and utilized trees, cut and unutilized trees, and live trees
associated with land-use reclassifications.
• Growth: 𝐺𝑟𝑜𝑤𝑡ℎ 𝑇1 = 𝐼𝑛𝑣𝑒𝑛𝑡𝑜𝑟𝑦 𝑇2 − 𝐼𝑛𝑣𝑒𝑛𝑡𝑜𝑟𝑦 𝑇1 + 𝑅𝑒𝑚𝑜𝑣𝑎𝑙𝑠 𝑇1
• GRR: Growth-to-Removal Ratio 𝐺𝑅𝑅 𝑇1 =
𝐺𝑟𝑜𝑤𝑡ℎ 𝑇1
𝑅𝑒𝑚𝑜𝑣𝑎𝑙𝑠 𝑇1
• Direct Effect: Jobs and payroll at forestry-related businesses.
• Indirect Effect: Jobs and payroll at businesses that supply inputs to forestry-
related businesses.
• Induced Effect: Jobs and payroll that are supported by direct and indirect
industries through consumer spending.
• GDP: The gross output of an industry less its intermediate inputs. 12

Private Working Forests: Recent Trends and Economic Impact

  • 1.
    ©2016, Forest2Market, Inc. PRIVATEWORKING FORESTS: RECENT TRENDS AND ECONOMIC IMPACT HANNAH M. JEFFERIES TIMBER AND FIBER MARKET ANALYST JUNE 28, 2016
  • 2.
    ©2016, Forest2Market, Inc. FOREST2MARKET INTRODUCTION Forest2Marketserves industries that consume wood raw materials: • Wood products, pulp and paper products and lumber manufacturers • Bioenergy, biofuels and biochemical producers 2 Forest2Market is a neutral third-party, independent in ownership and structure. While actively involved in the industries we serve, we do not buy or sell timberland, timber, lumber or biomass.
  • 3.
    ©2016, Forest2Market, Inc. THESUSTAINING EFFECTS OF FOREST PRODUCT DEMAND 3 Robust, long- term demand for forest products promotes investment in forested lands and ensures that they remain forested.
  • 4.
    ©2016, Forest2Market, Inc. FORESTEDLAND IN THE UNITED STATES 4 Forest2Market conducted two analyses for NAFO: • United States Forest Inventory and Harvest Trends on Privately-Owned Timberlands, 2016 • The Economic Impact of Privately-Owned Forests in the United States, 2016 Economic Impact Regions Inventory/Removal Regions
  • 5.
    ©2016, Forest2Market, Inc. NATIONALTRENDS IN INVENTORY AND REMOVALS 5 Total Removals Relative to Inventory, 2008-2014 – United States Year Inventory Removals 2008 257.5 6.99 2009 261.2 6.44 2010 264.8 6.73 2011 268.5 6.86 2012 272.1 6.73 2013 275.5 6.73 2014 279.7 6.68 Annual change 1.4% -0.8% Year Inventory Removals 2008 136.1 3.46 2009 136.2 3.45 2010 136.3 3.51 2011 136.9 3.57 2012 137.3 3.49 2013 137.6 3.44 2014 138.3 3.43 Annual change 0.3% -0.1% All Species Sawtimber All Species Pulpwood • Removals are small in comparison to total available inventory. • Removals, especially sawtimber, have declined since 2008. • Inventory has increased steadily.
  • 6.
    ©2016, Forest2Market, Inc. NATIONALTRENDS IN INVENTORY AND REMOVALS • Private landowners grow more wood than they harvest. • Annually, growth has exceeded removals by an average of 40% (GRR=1.4). • Net growth has increased since 2008. 6 Growth and Removals, 2008-2014 – United States
  • 7.
    ©2016, Forest2Market, Inc. Workingforests support forestry, logging, lumber, paper, furniture, millwork, and wholesaling. ECONOMIC CONTRIBUTION OF WORKING FORESTS 7 Image credits: Forest2Market, Hannah Jefferies, group2runner, Fletcher6, Hannah Jefferies. 2.4M of 2.7M Jobs from Private Forests $99B of $113B Payroll from Private Forests
  • 8.
    ©2016, Forest2Market, Inc. ECONOMIC CONTRIBUTIONOF WORKING FORESTS • Forest products manufacturing is 5.3% of total manufacturing GDP. • In seven states, forest products manufacturing represents over 10% of total manufacturing GDP. 8 GDP (Billions $) Associated with Forest Products Manufacturing and Percent of Manufacturing GDP – 2014
  • 9.
    ©2016, Forest2Market, Inc. RECESSIONIMPACTS: U.S. SOUTH EXAMPLE • The Great Recession has disrupted typical harvest patterns, leading to an accumulation of inventory. • Underutilized working forests are at risk of conversion to other uses, such as agriculture or development. 9 Total Inventory and Inventory Change, 2000-2014 – U.S. South
  • 10.
    ©2016, Forest2Market, Inc. CONCLUSION 10 •Demand from wood-consuming industries encourages landowners to maintain healthy and productive working forests. • Working forests and the industries that rely on them for raw material inputs are critical to local economies, especially in rural areas. • Declining demand places working forests at risk of conversion to other land uses that lack the benefits of working forests.
  • 11.
    ©2016, Forest2Market, Inc. CONTACTAND MORE INFORMATION Hannah M. Jefferies Timber and Fiber Market Analyst +1.980.233.4036 hannah.jefferies@forest2market.com Forest2Market, Inc. 15720 Brixham Hill Ave Suite 550 Charlotte, NC 28277 Forest2Market, Inc. 2016. United States Forest Inventory and Harvest Trends on Privately- Owned Timberlands. Charlotte, NC. Accessible at http://www.nafoalliance.org/images/issues/carbon/resources/F2M-inventory-harvest- trends-20160620.pdf Forest2Market, Inc. 2016. The Economic Impact of Privately-Owned Forests in the United States. Charlotte, NC. Accessible at http://www.nafoalliance.org/images/documents/task- groups/communications/Forest2Market_Economic_Impact_of_Privately- Owned_Forests_April_2016.pdf 11
  • 12.
    ©2016, Forest2Market, Inc. TERMINOLOGY •Timberland: Forest capable of producing 20 cubic feet of wood per acre annually at culmination of mean annual increment. Excludes reserved forestland. • Private Owner: Non-industrial private forest (NIPF) landowners, corporate entities (TIMOs, REITs, and integrated forest products companies), Native Americans, NGOs and unincorporated local partnerships, associations or clubs • Inventory: Volume of growing-stock trees • Removals: Volume of trees that have been removed since the previous inventory. Includes cut and utilized trees, cut and unutilized trees, and live trees associated with land-use reclassifications. • Growth: 𝐺𝑟𝑜𝑤𝑡ℎ 𝑇1 = 𝐼𝑛𝑣𝑒𝑛𝑡𝑜𝑟𝑦 𝑇2 − 𝐼𝑛𝑣𝑒𝑛𝑡𝑜𝑟𝑦 𝑇1 + 𝑅𝑒𝑚𝑜𝑣𝑎𝑙𝑠 𝑇1 • GRR: Growth-to-Removal Ratio 𝐺𝑅𝑅 𝑇1 = 𝐺𝑟𝑜𝑤𝑡ℎ 𝑇1 𝑅𝑒𝑚𝑜𝑣𝑎𝑙𝑠 𝑇1 • Direct Effect: Jobs and payroll at forestry-related businesses. • Indirect Effect: Jobs and payroll at businesses that supply inputs to forestry- related businesses. • Induced Effect: Jobs and payroll that are supported by direct and indirect industries through consumer spending. • GDP: The gross output of an industry less its intermediate inputs. 12

Editor's Notes

  • #3 Forest2Market serves industries that produce or consume wood raw materials. These industries include timber owners and sellers, as well as manufacturers of pulp, paper, lumber, pellets, biofuels, and biochemicals. We are a neutral third-party that provides data and analytical services to companies in the wood product supply chain. We do not buy or sell timberland, timber, lumber, or biomass. The foundation of all Forest2Market products and services is our unique, current and proprietary database of delivered wood raw material transactions.
  • #4 This infographic from NAFO shows trends relevant to working forests between 1900 and 2000. Due to increasing population, higher incomes, and more housing starts, demand for wood-based products like paper and lumber increased over this period. At the same time, the total volume of trees increased over 50% from 1953 to 2011, and the amount of forested land has remained fairly constant at around 755 million acres. These trends indicate that robust, long-term demand for forest products promotes investment in forested lands and ensures that they remain forested.
  • #5 Forest2Market recently conducted two analyses for the National Alliance of Forest Owners (NAFO). These reports focused on the most forested areas of the United States, as shown by the colored areas on the large map. Forested land is concentrated in the Southeast, Northeast, Midwest, and Pacific Northwest. 81% of forested land is productive timberland—or working forest—and 74% of working forests are owned by private entities. The first report analyzed inventory and removal trends on privately-owned timberlands in three regions: The South, North, and Pacific Coast/Northwest as shown to the top right. The second report quantified the economic impact of forestry-related businesses, including forestry and logging, wood product and secondary manufacturing, pulp and paper manufacturing, and wholesaling of wood and paper products. This report analyzed the same 32 states as the inventory and removal report but sliced and diced the regions a little bit differently.
  • #6 Our analysis of inventory and removal trends indicates that: Removals are small in comparison to total inventory. Removals as a percentage of inventory have decreased since 2008: Compared to the total available resource, private landowners remove less now than they did in 2008. Removals, especially sawtimber, have declined since 2008. Sawtimber removals have decreased at a rate of 0.8% annually. Pulpwood removals have remained fairly constant, decreasing just one-tenth of a percent annually. Driven by declining sawtimber removals, inventory has increased steadily. Sawtimber inventory increased at a rate of 1.4%. Pulpwood inventory increased at a rate of 0.3% annually.
  • #7 This chart adds an analysis of growth to the previous slide’s chart and adjusts the axis for better visibility. The fact that inventories are increasing means that private landowners grow more wood than they harvest. On average, growth has exceeded removals by 40% since 2008. Net growth—the net volume of wood added to inventory each year—has increased at a rate of 4.3% annually since 2008.
  • #8 Working forests contribute significantly to the United States economy. Many industries, including pulp, paper lumber, plywood, panel, and bioenergy production, rely on wood from working forests to supply direct raw materials to their manufacturing process. Others, like furniture manufacturers, architectural and millwork manufacturers, and wood and paper merchant wholesalers use outputs of primary wood-using facilities to create their products or conduct their business. These industries—and the timberlands that supply them—support many jobs for Americans across the country. Based on where wood raw material originates, most forest industry jobs are supported by private timberlands—not government lands. Private timberlands support 2.4 million direct, indirect, and induced jobs in the United States. $99 of the $113 billion in direct, indirect, and induced payroll is associated with private timberland.
  • #9 Industries that rely on working forests contribute $93 billion to Gross Domestic Product. That is equivalent to 5.3% of total manufacturing GDP. In seven states, including Maine, Arkansas, Mississippi, Alabama, Georgia, South Carolina, and Wisconsin, industries that rely on working forests represent more than 10% of total state manufacturing GDP. Forest industry jobs are critical to rural economies.
  • #10 The infographic at the beginning of this presentation showed how timberland acres have remained stable and timber inventories have increased as demand for wood raw material increased. In the U.S. South, our analysis shows that since the Great Recession, private timber inventories have been increasing at much higher rates. While some of this increase may be due to the ebb and flow of inventory during normal harvest rotations, we conclude that rapidly increasing inventories are attributable to declining removals—especially sawtimber removals. Because sawtimber is a larger log and takes longer to grow, sawtimber is a higher-value product than pulpwood. In the South, landowners receive much more money for sawtimber than they do for pulpwood. Sawtimber is used most frequently to manufacture lumber and specialty wood products used in home construction. When the housing bubble burst during the Great Recession, demand for sawtimber declined, and 20% of sawmill capacity permanently exited the market between 2006 and 2014. As demand for sawtimber declined, so did sawtimber value. Rather than lose return on their investment—an investment that takes decades to reach maximum value—our data indicate that private landowners delayed sawtimber harvest as they waited for sawtimber demand—and therefore price—to increase. Working forests that are underutilized because private landowners are unable to secure an adequate return on their investment are at risk of conversion to other uses. Weak demand signals and uncertainty over future economic returns increase the likelihood that landowners will choose uses that offer the opportunity for higher or more near-term returns, such as development, or the security of annual returns, like agriculture.
  • #11 Historical data show that demand from wood-consuming industries encourages landowners to maintain healthy and productive working forests. Working forests and the industries that rely on them are an important source of good-paying jobs that promote further spending in local economies, especially in rural areas. Working forests store carbon, clean our water and air, and add beauty to our environment. Forest2Market’s analysis of recent inventory and removals on private timberlands suggests that declining demand for wood fiber places working forests at risk of conversion to other uses that lack the benefits of working forests.