Download to read offline
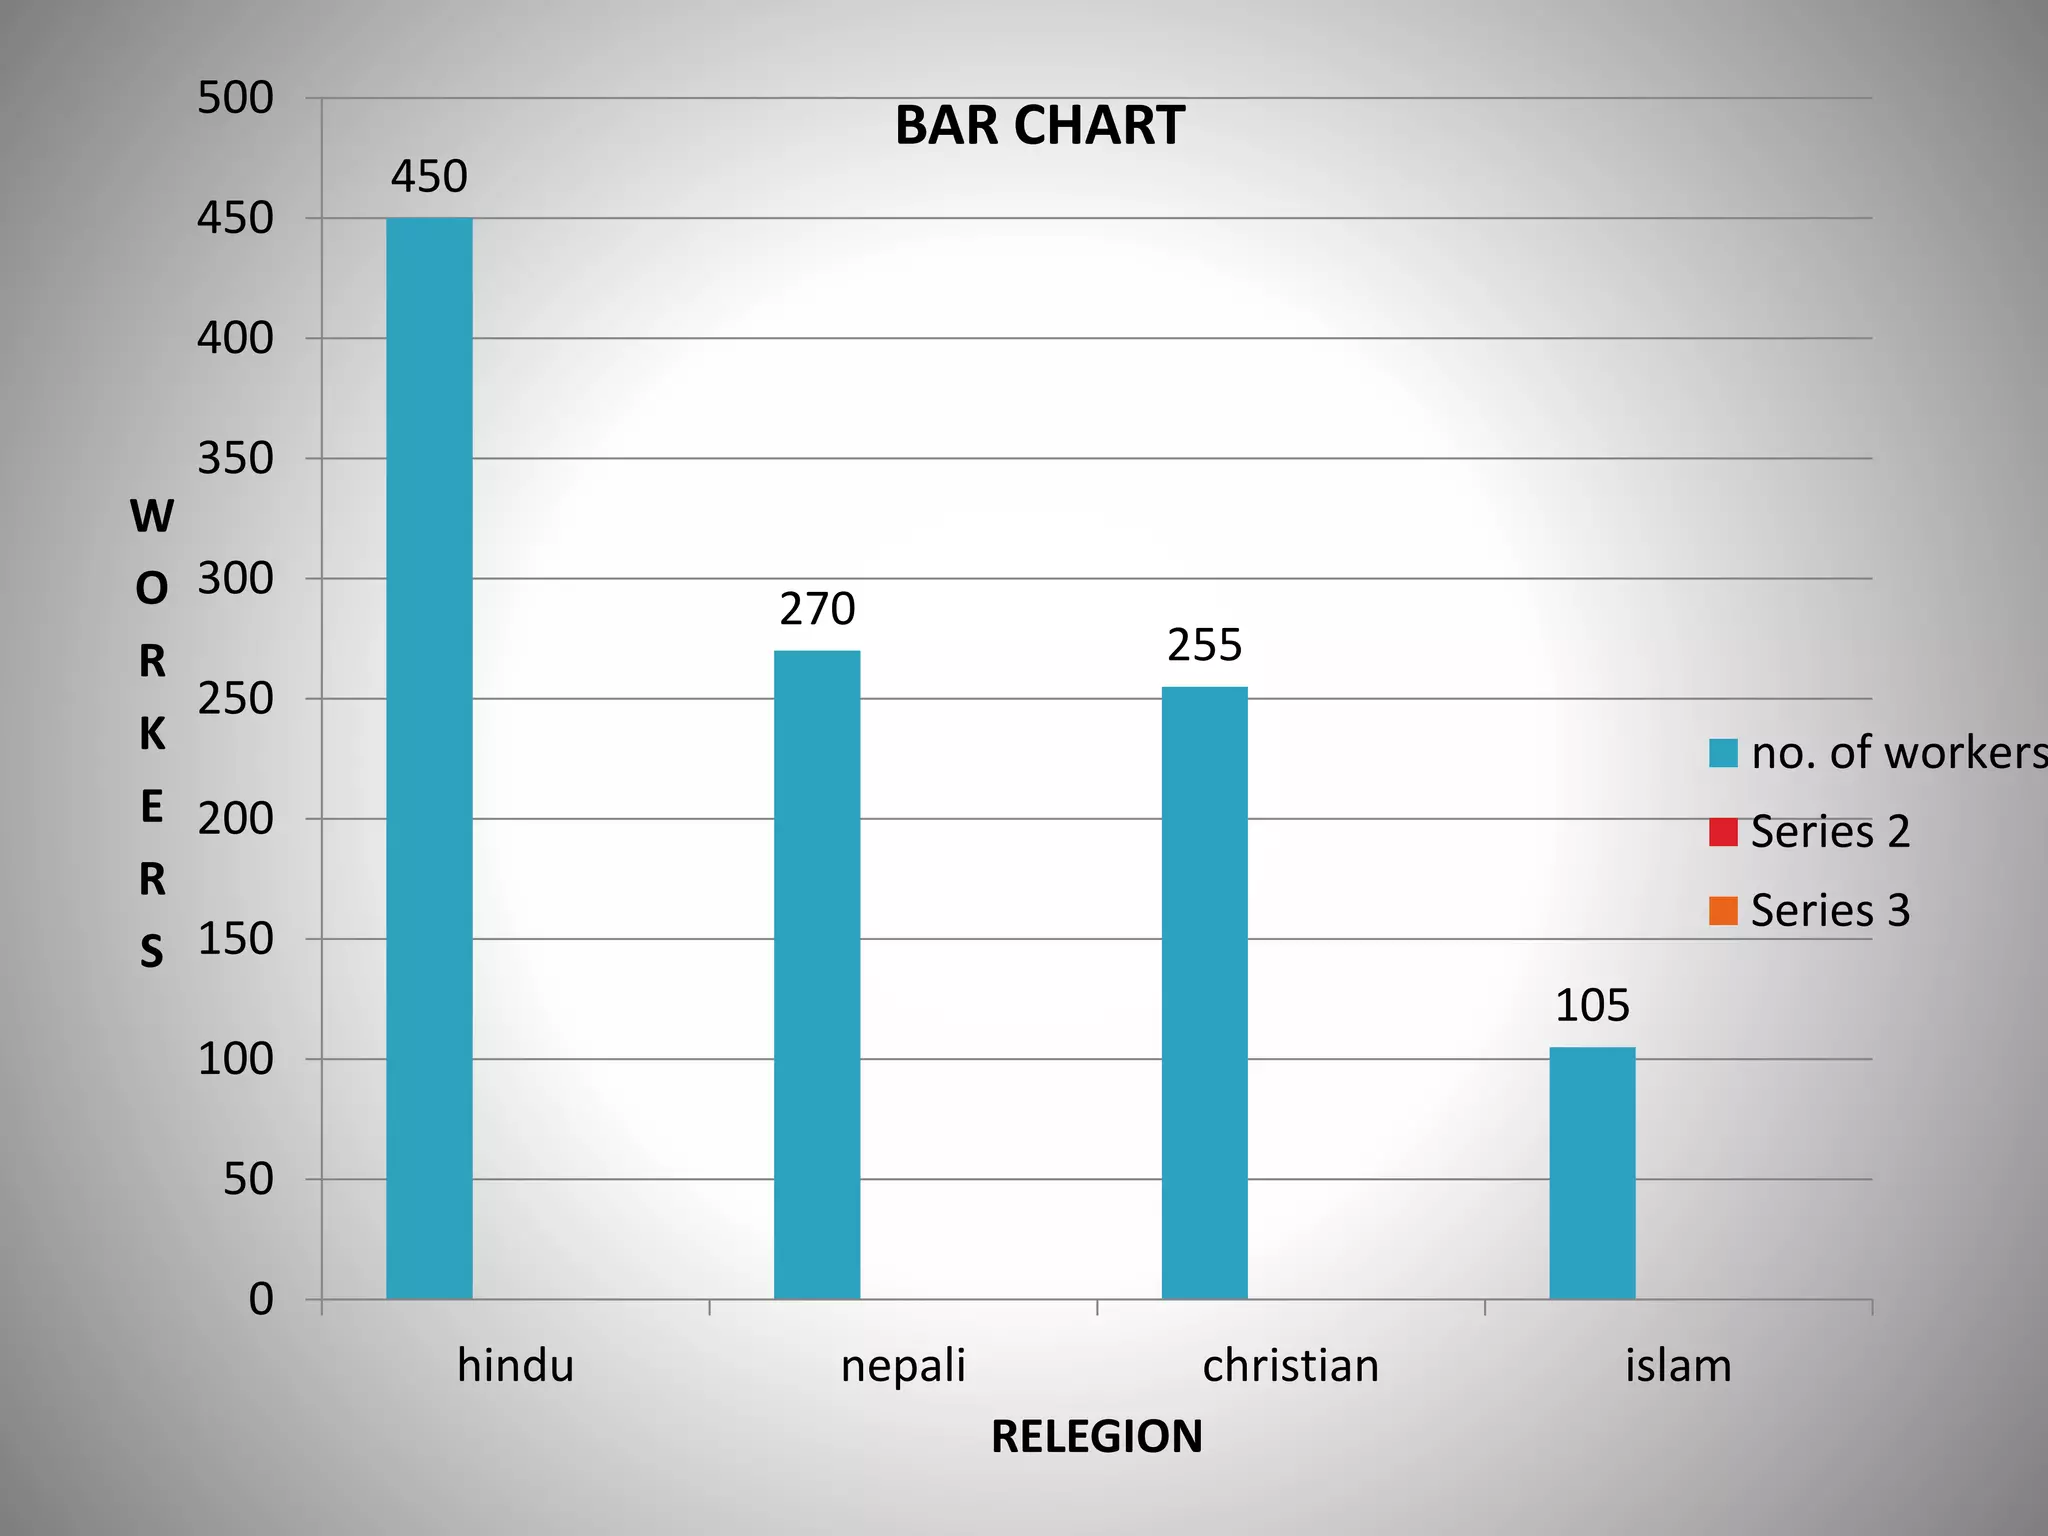
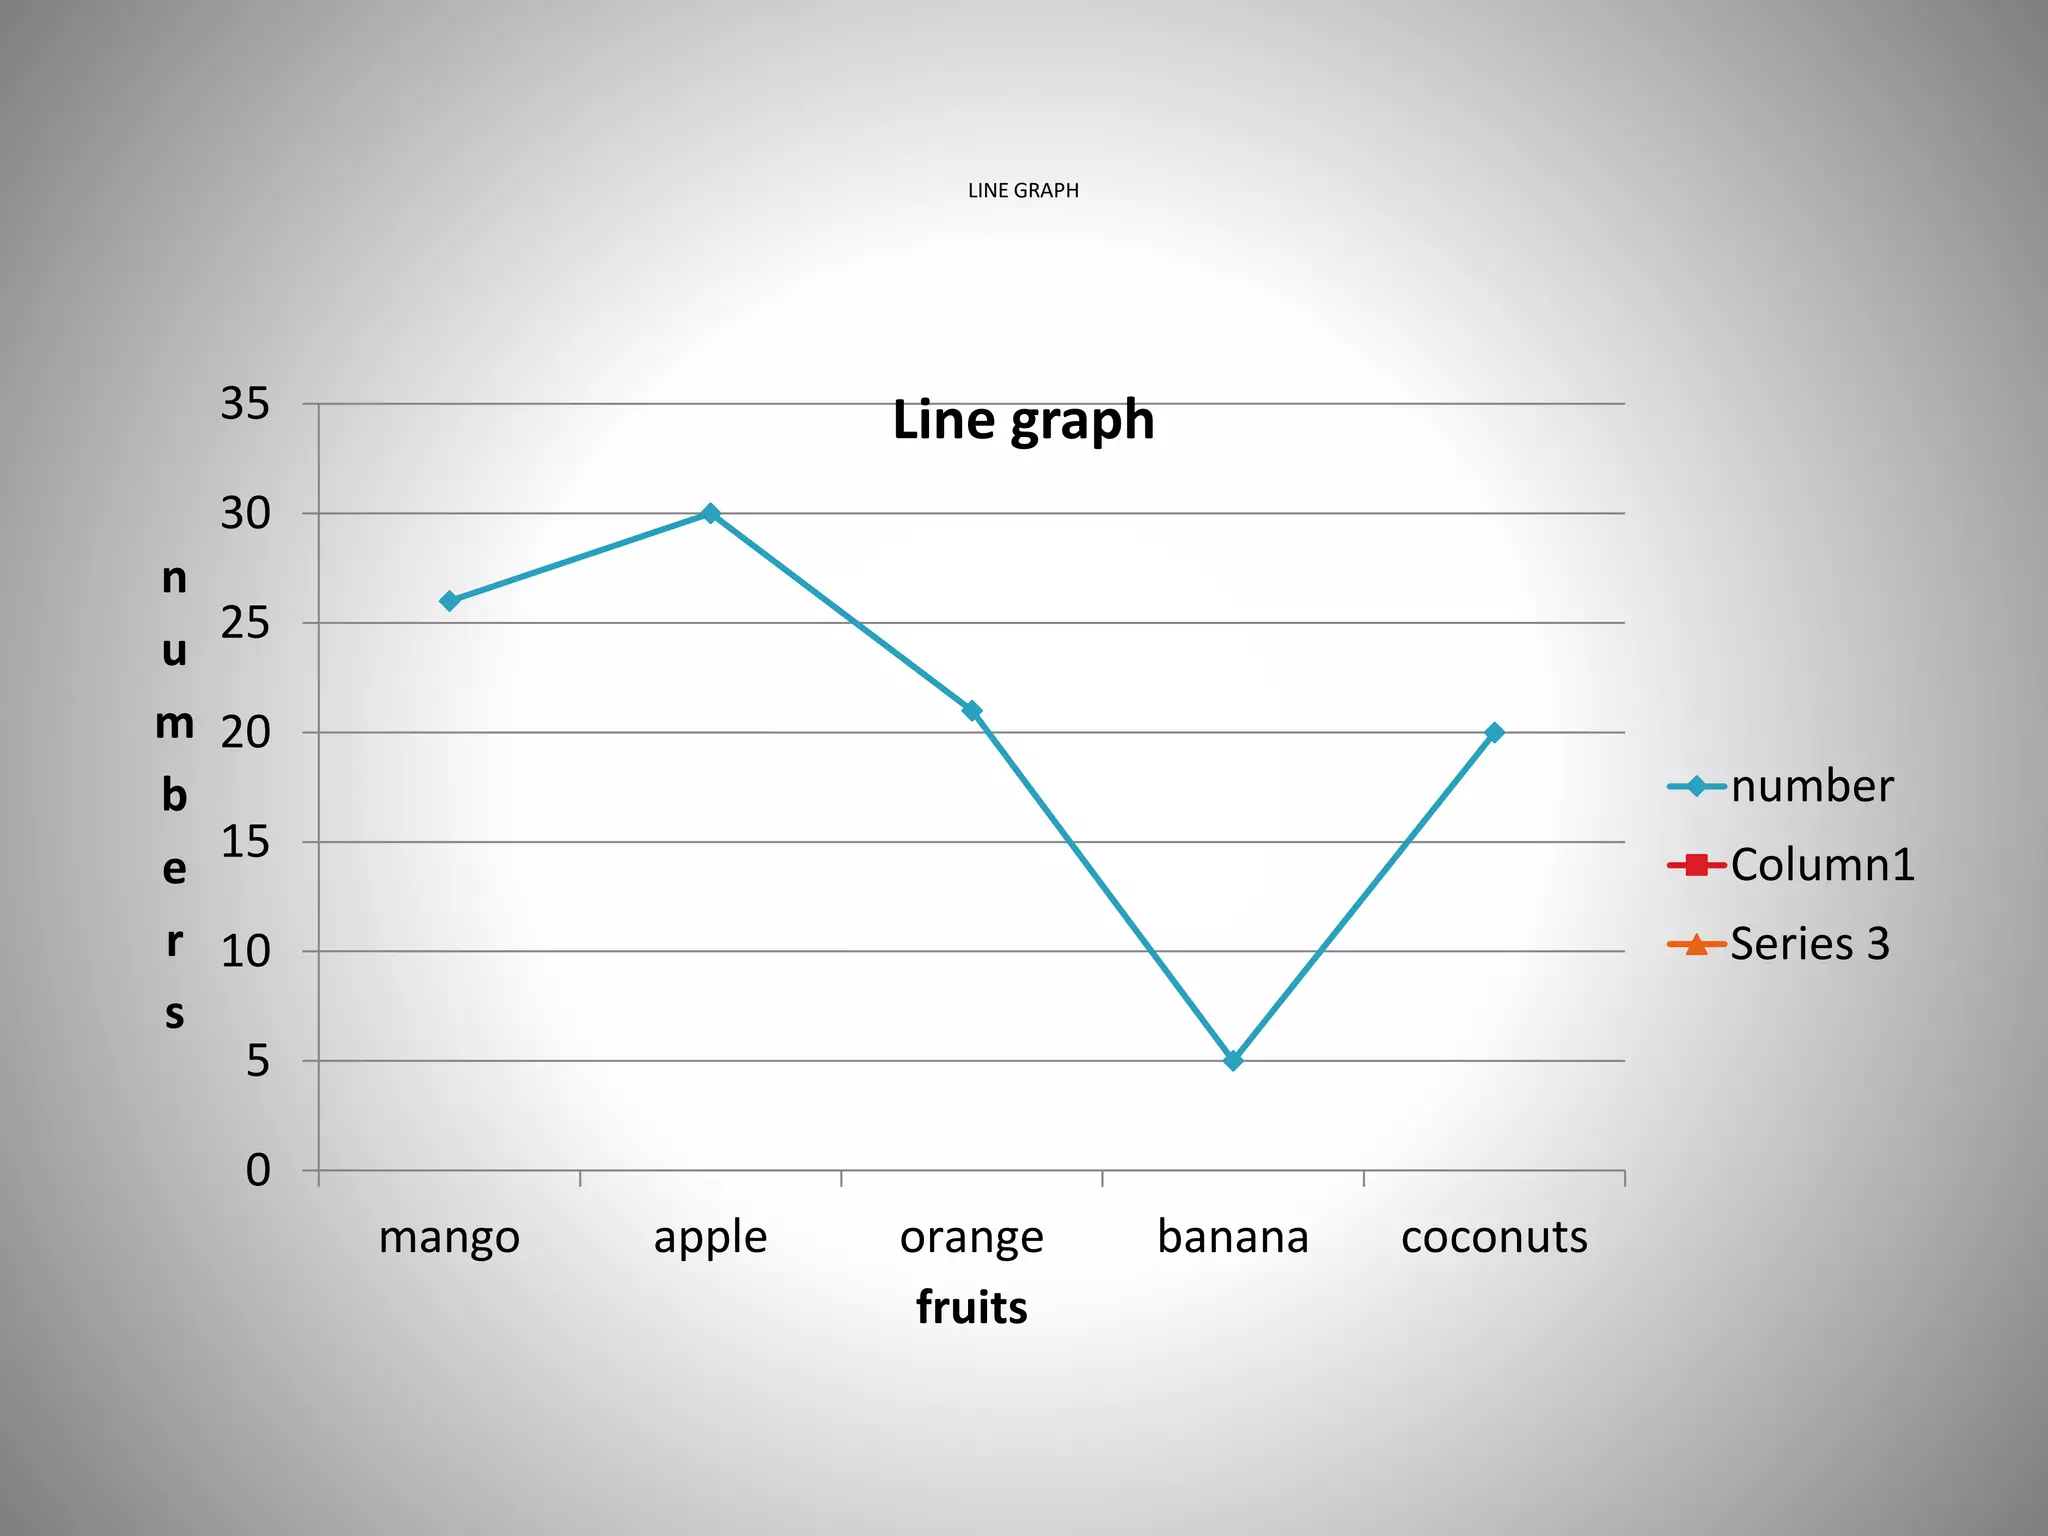
The document contains two graphs. A bar chart shows the number of workers from different religions, with the most being Hindu at 450, and the least being Christian at 105. A line graph plots the number of various fruits, with mangoes the highest at 35, and coconuts the lowest at 5.


![21ELN24 [PROJECT ].pptx](https://cdn.slidesharecdn.com/ss_thumbnails/21eln24project-230716084746-d5eb379d-thumbnail.jpg?width=640&height=640&fit=bounds)


