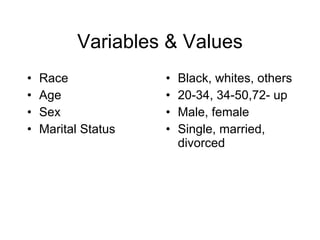
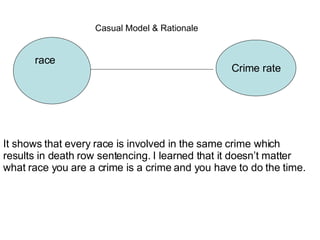
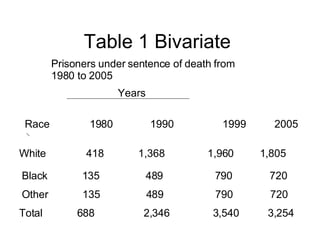
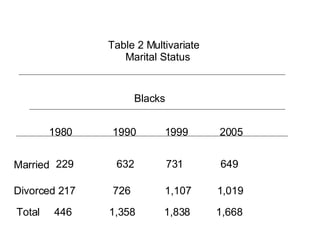
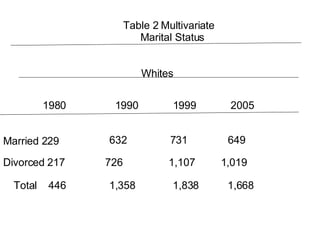
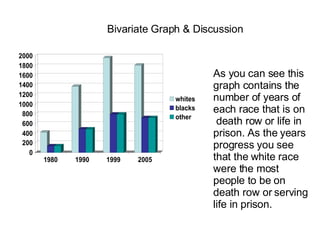
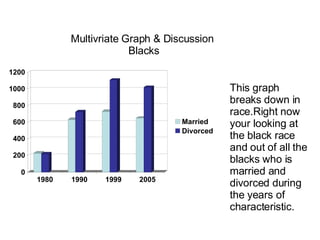
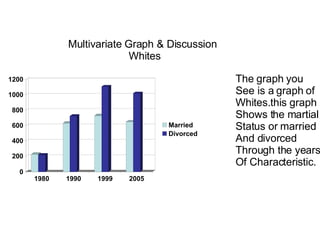
This document analyzes data on death row inmates from 1980 to 2005. It contains tables and graphs showing the numbers of inmates by race, age, sex, marital status, and year. The number of white inmates on death row was highest each year compared to black and other races. Graphs break down marital status for black and white inmates separately over the years, showing numbers for those who were married or divorced. The document examines how crime rates and death row populations have changed over time based on these variables.


![Faceshots [try 1]](https://cdn.slidesharecdn.com/ss_thumbnails/blue-makeup-1225149293383176-9-thumbnail.jpg?width=640&height=640&fit=bounds)


