3
Sub Topics
Sub Topics
Well Completions, Workovers and
Stimulation
Production Logging in Horizontal wellbores
New Technologies
Reservoir Characterization and Simulation
4.
4
General Applications andBenefits
General Applications and Benefits
Improve well and field production
Verify or update reservoir model
Evaluate effectiveness of drilling and
completion processes
Monitor EOR project
Identify and locate production problems
8
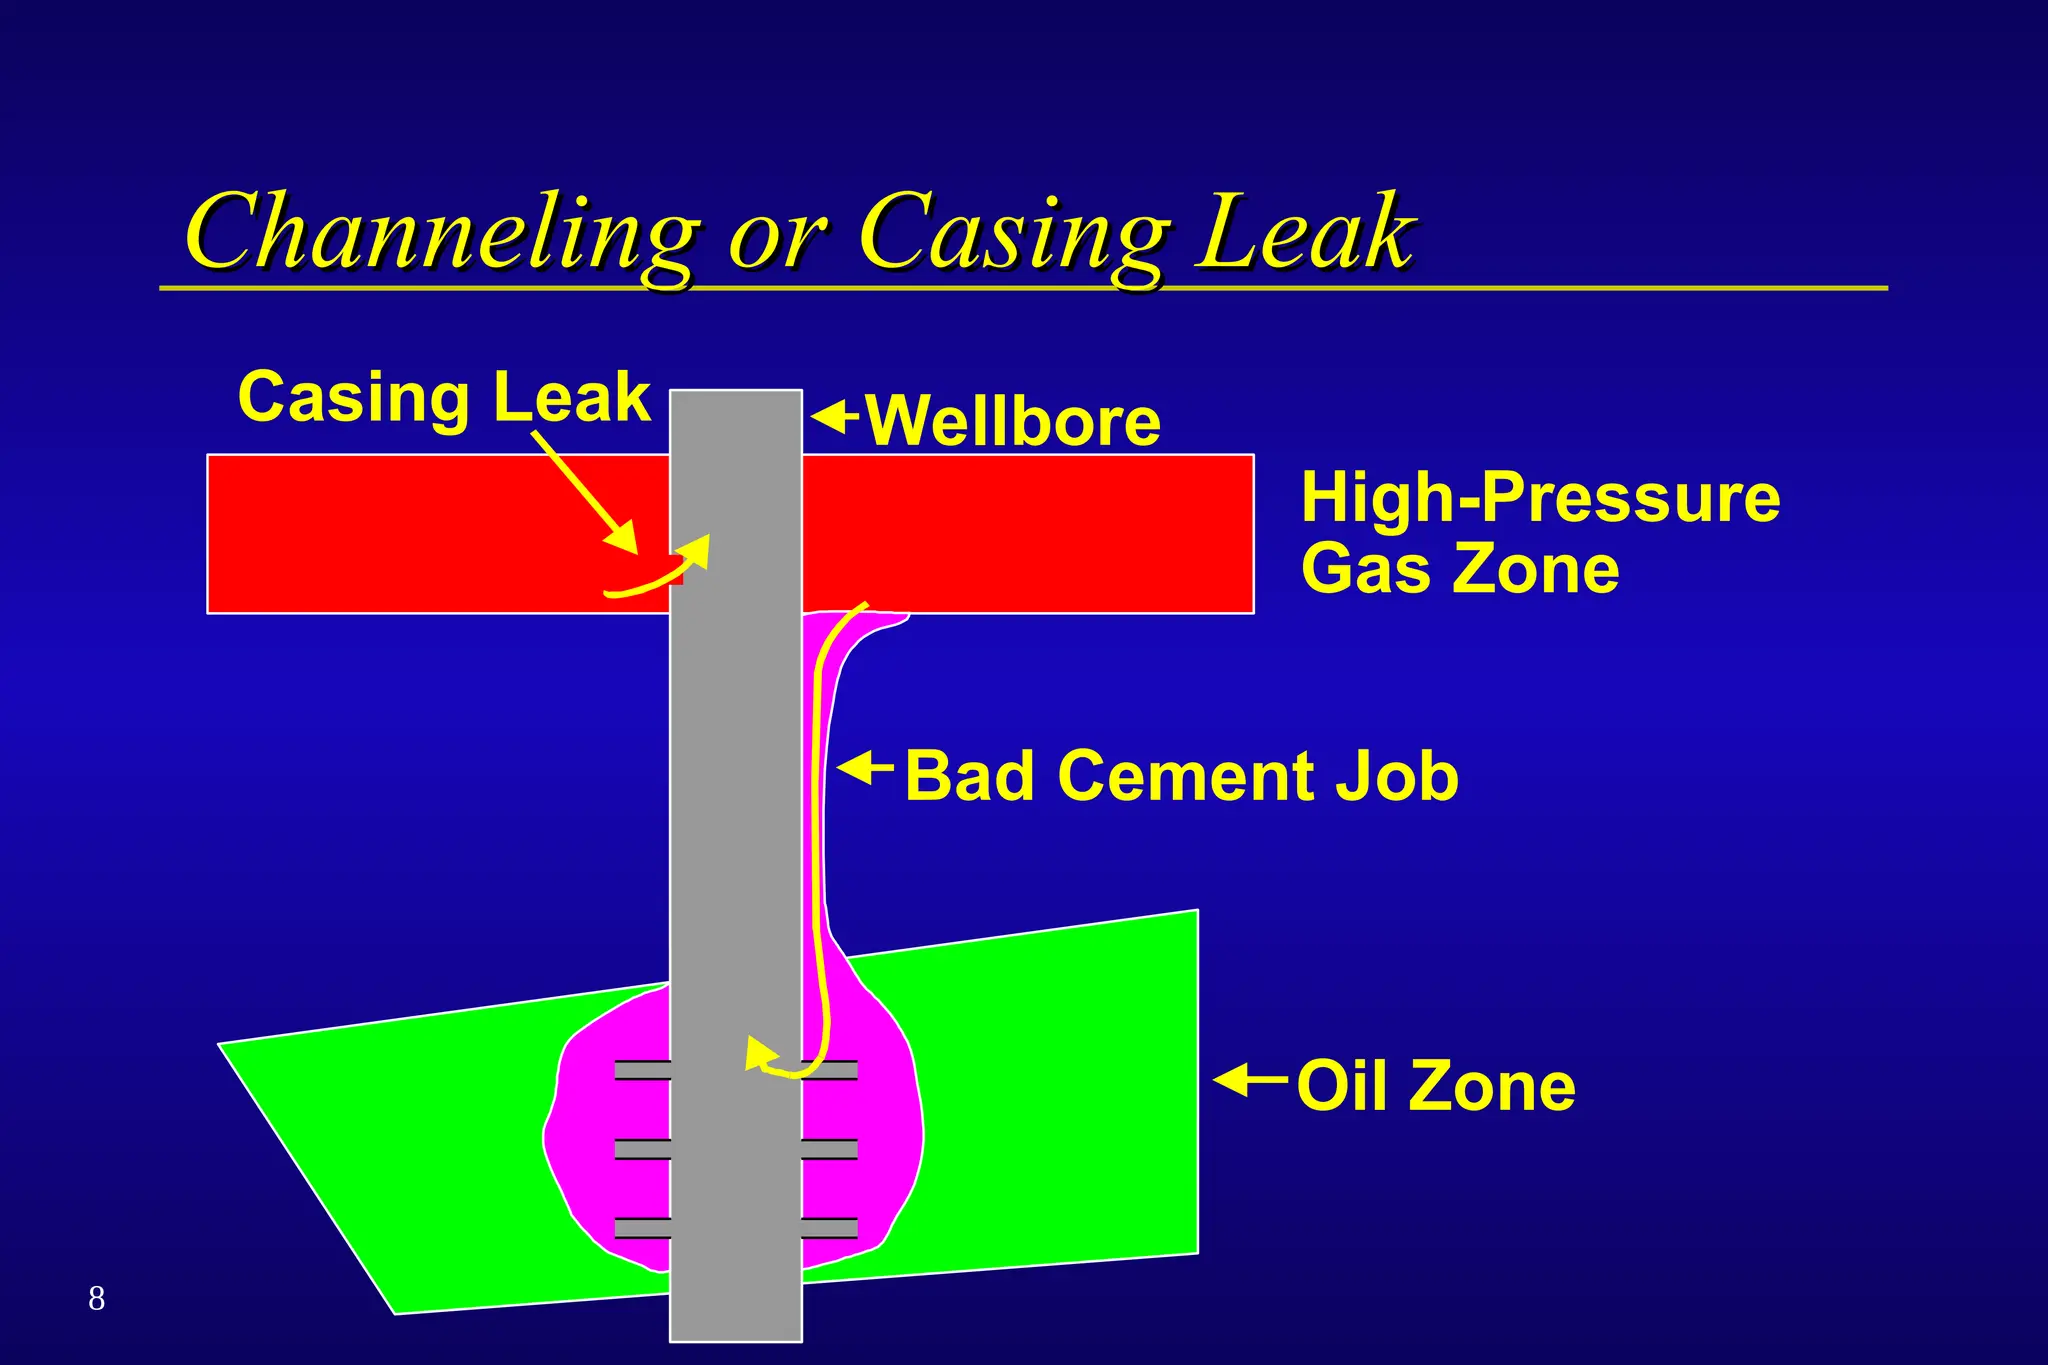
Bad Cement Job
OilZone
Casing Leak Wellbore
High-Pressure
Gas Zone
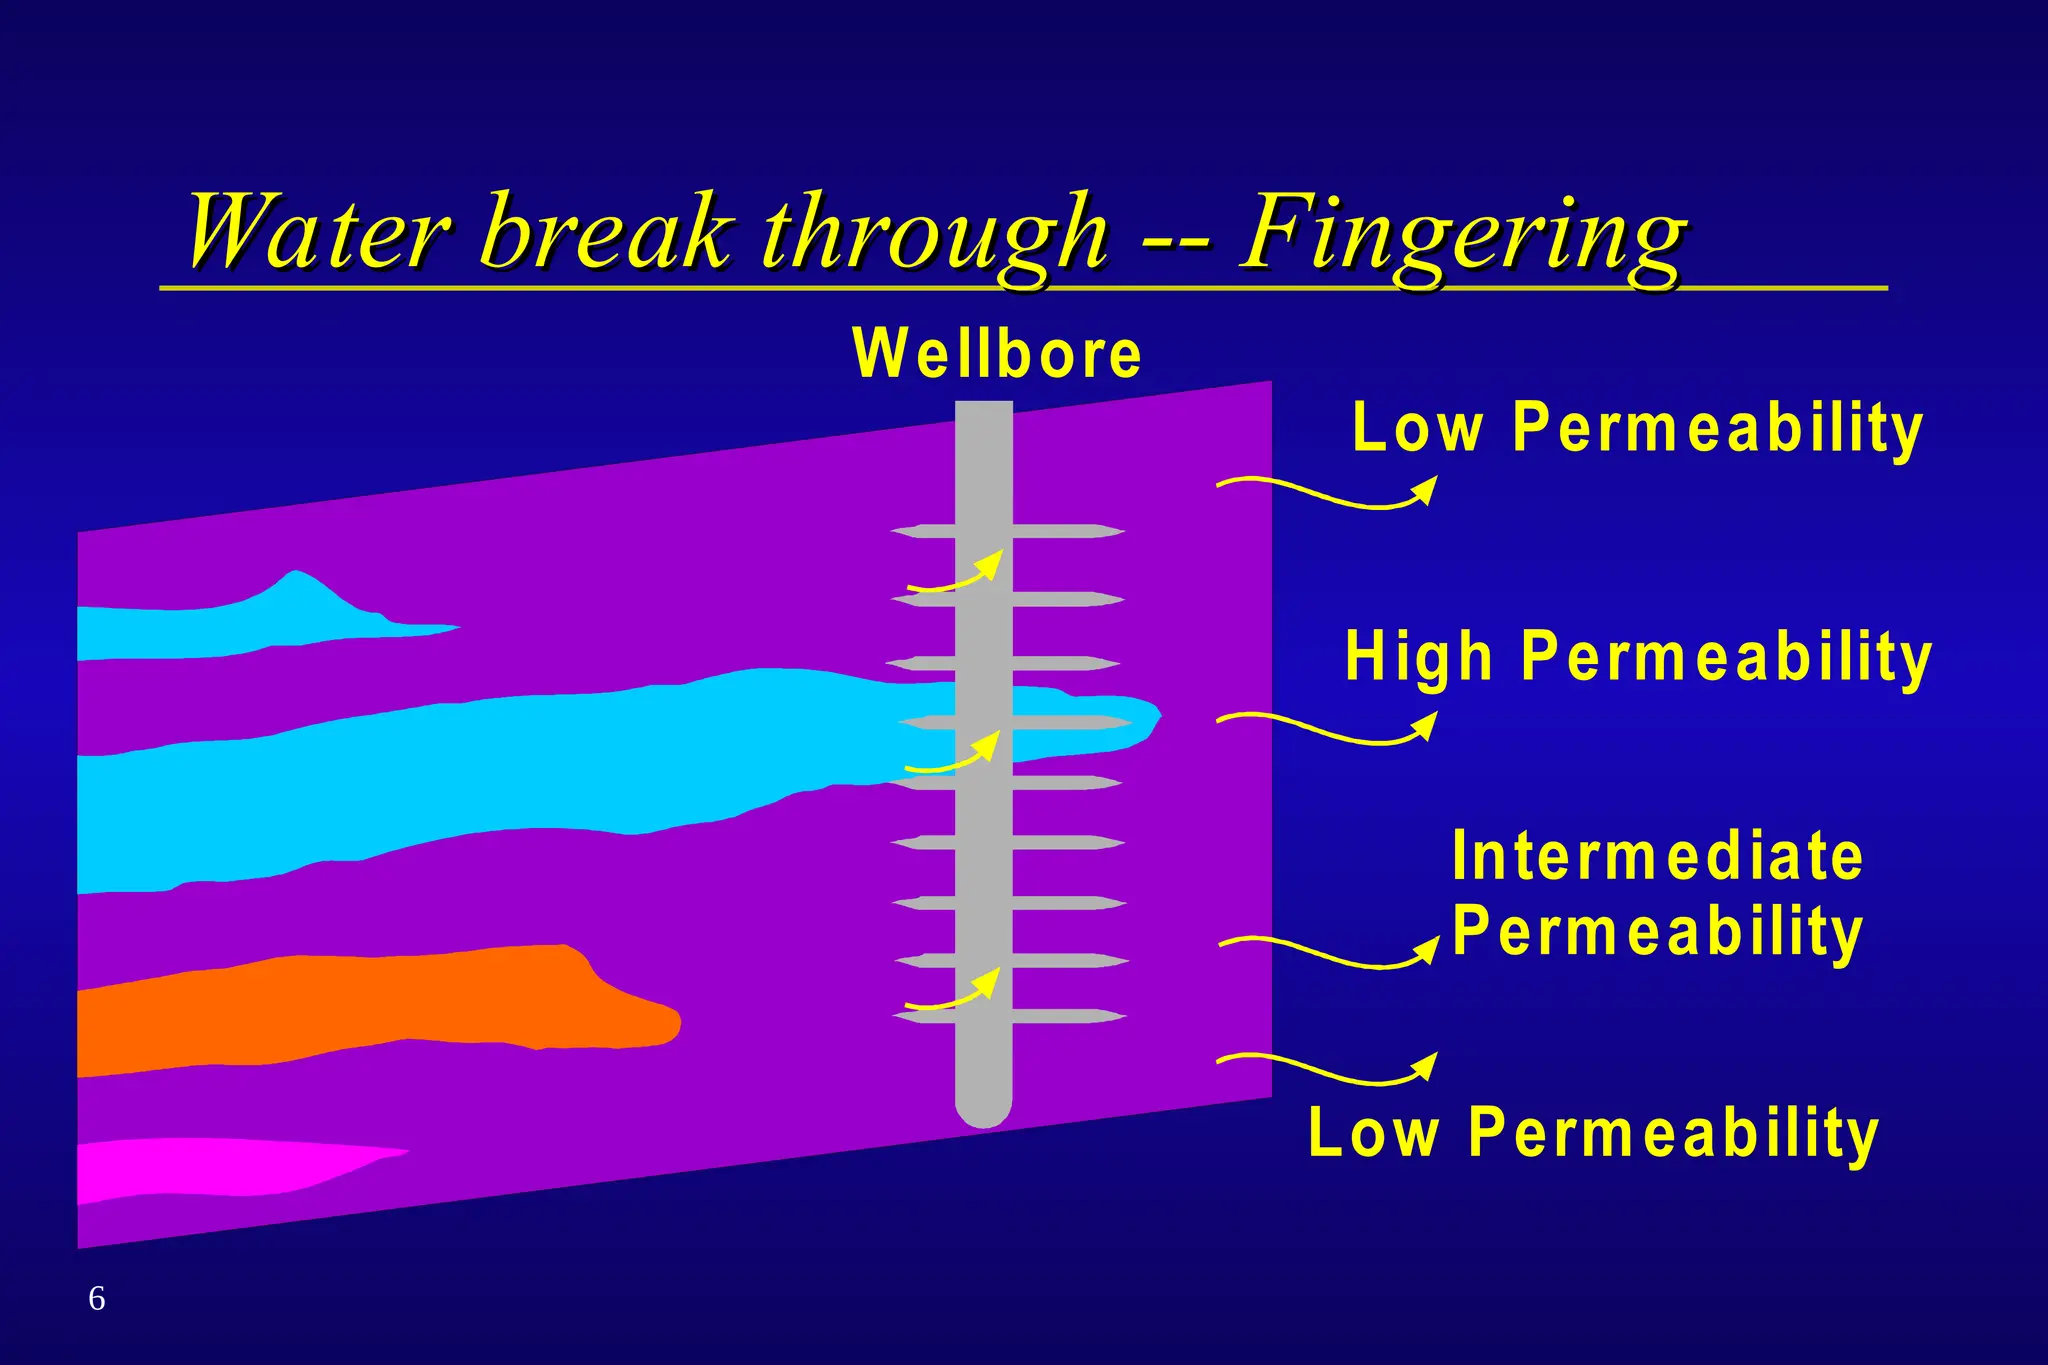
Channeling or Casing Leak
Channeling or Casing Leak
9.
9
Reservoir Monitoring
Reservoir Monitoring
Production Profiling
Oil, Water and Gas production rates at each entry
Identify actual formation intervals producing desired
products.
Identify formation intervals that are under performing
Identify formation intervals producing unwanted
products
Locate thief zones
14
Holdup
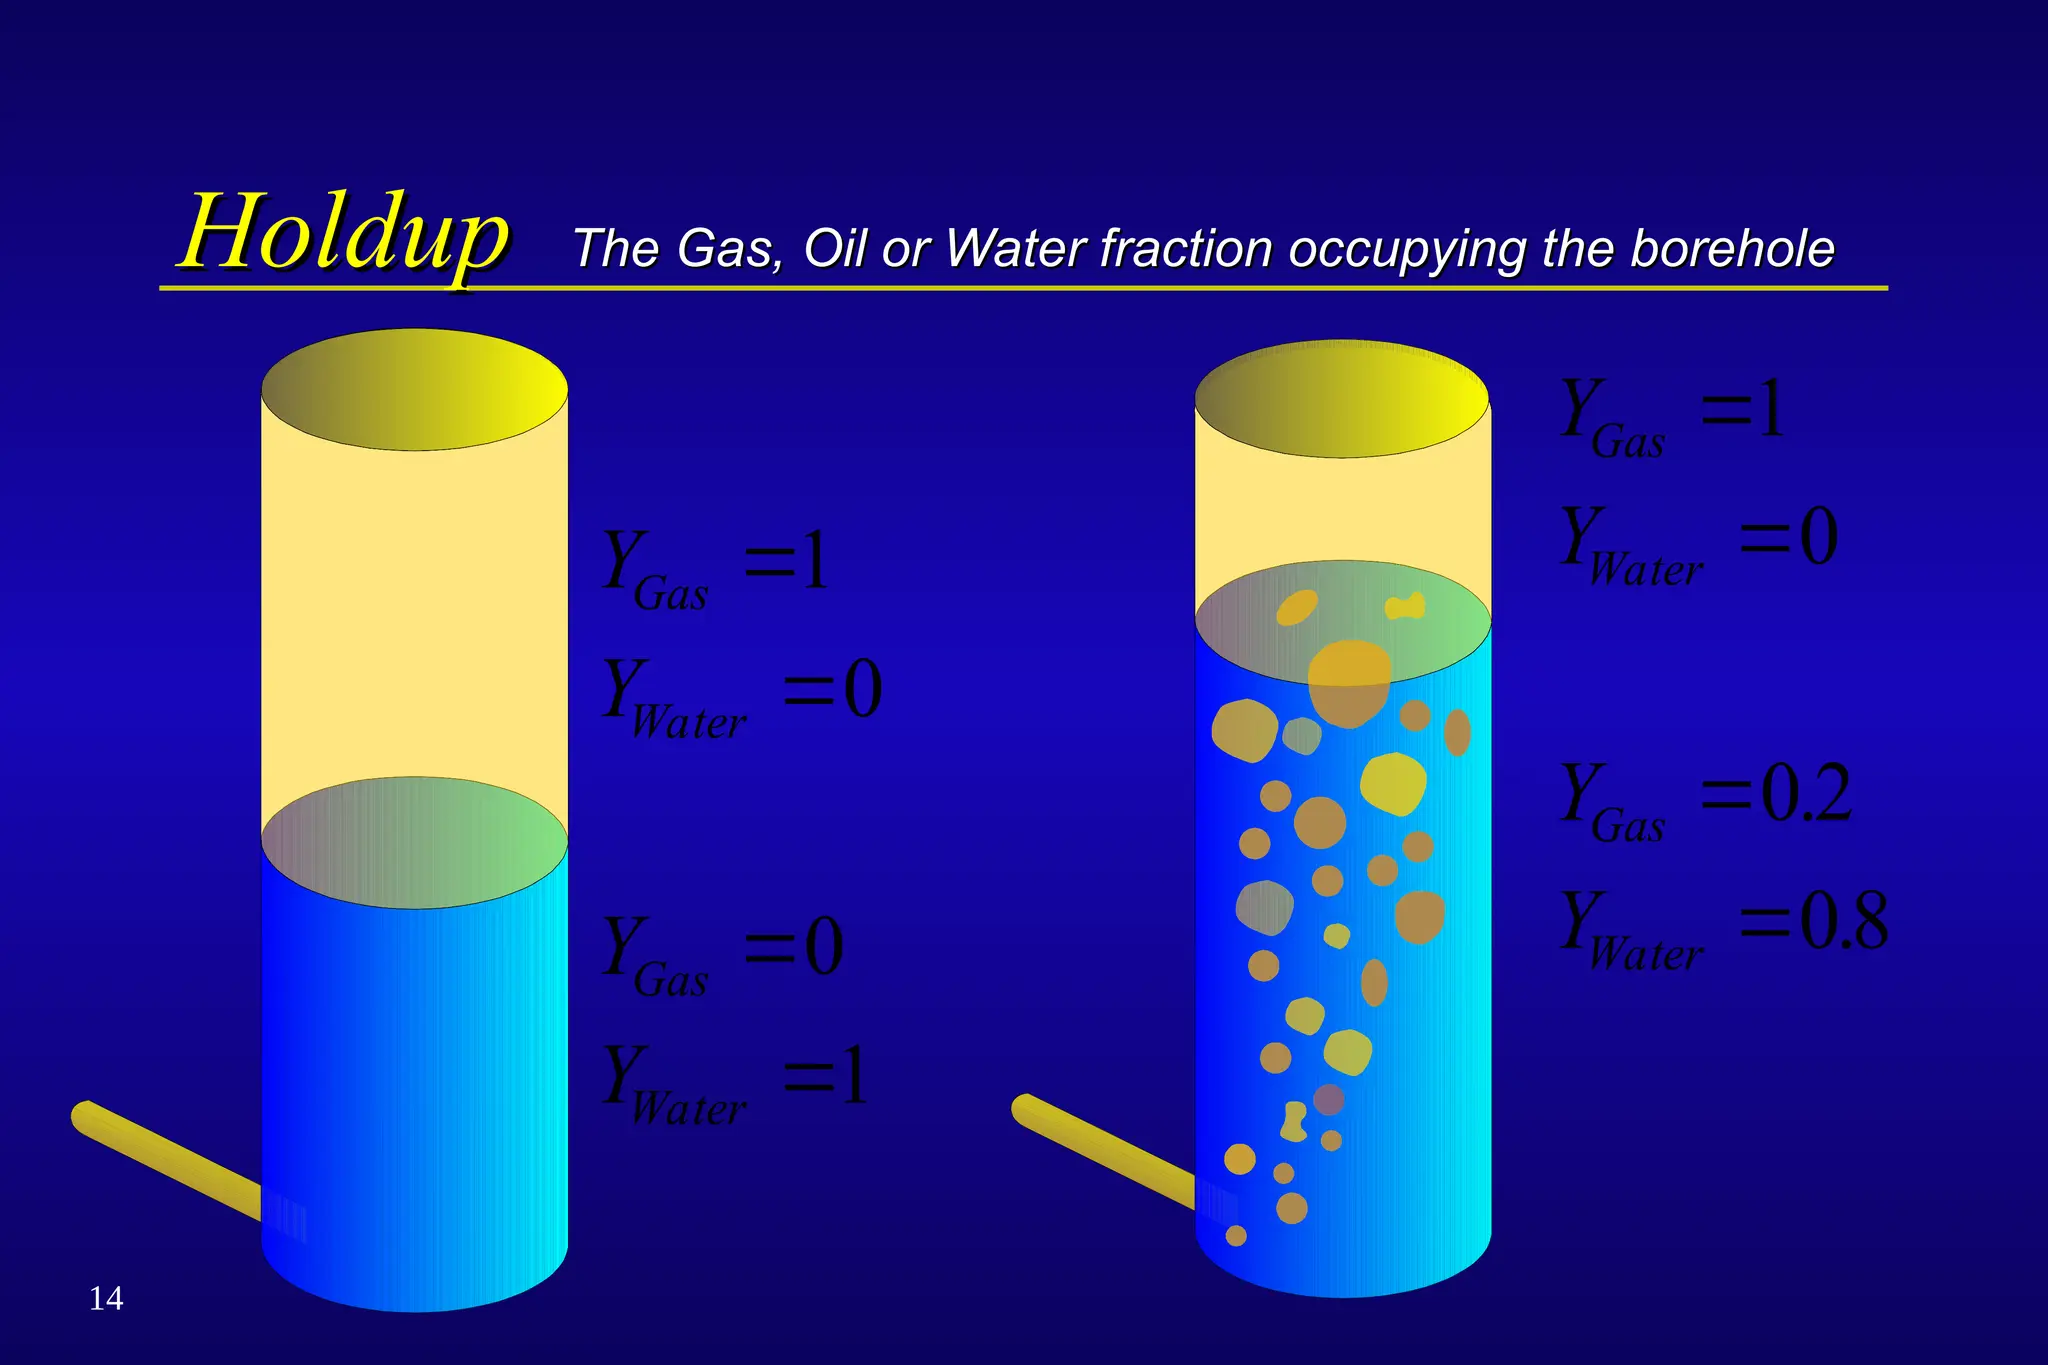
Holdup The Gas,Oil or Water fraction occupying the borehole
The Gas, Oil or Water fraction occupying the borehole
Y
Y
Y
Y
Gas
Water
Gas
Water
1
0
02
08
.
.
Y
Y
Y
Y
Gas
Water
Gas
Water
1
0
0
1
15.
15
Cut
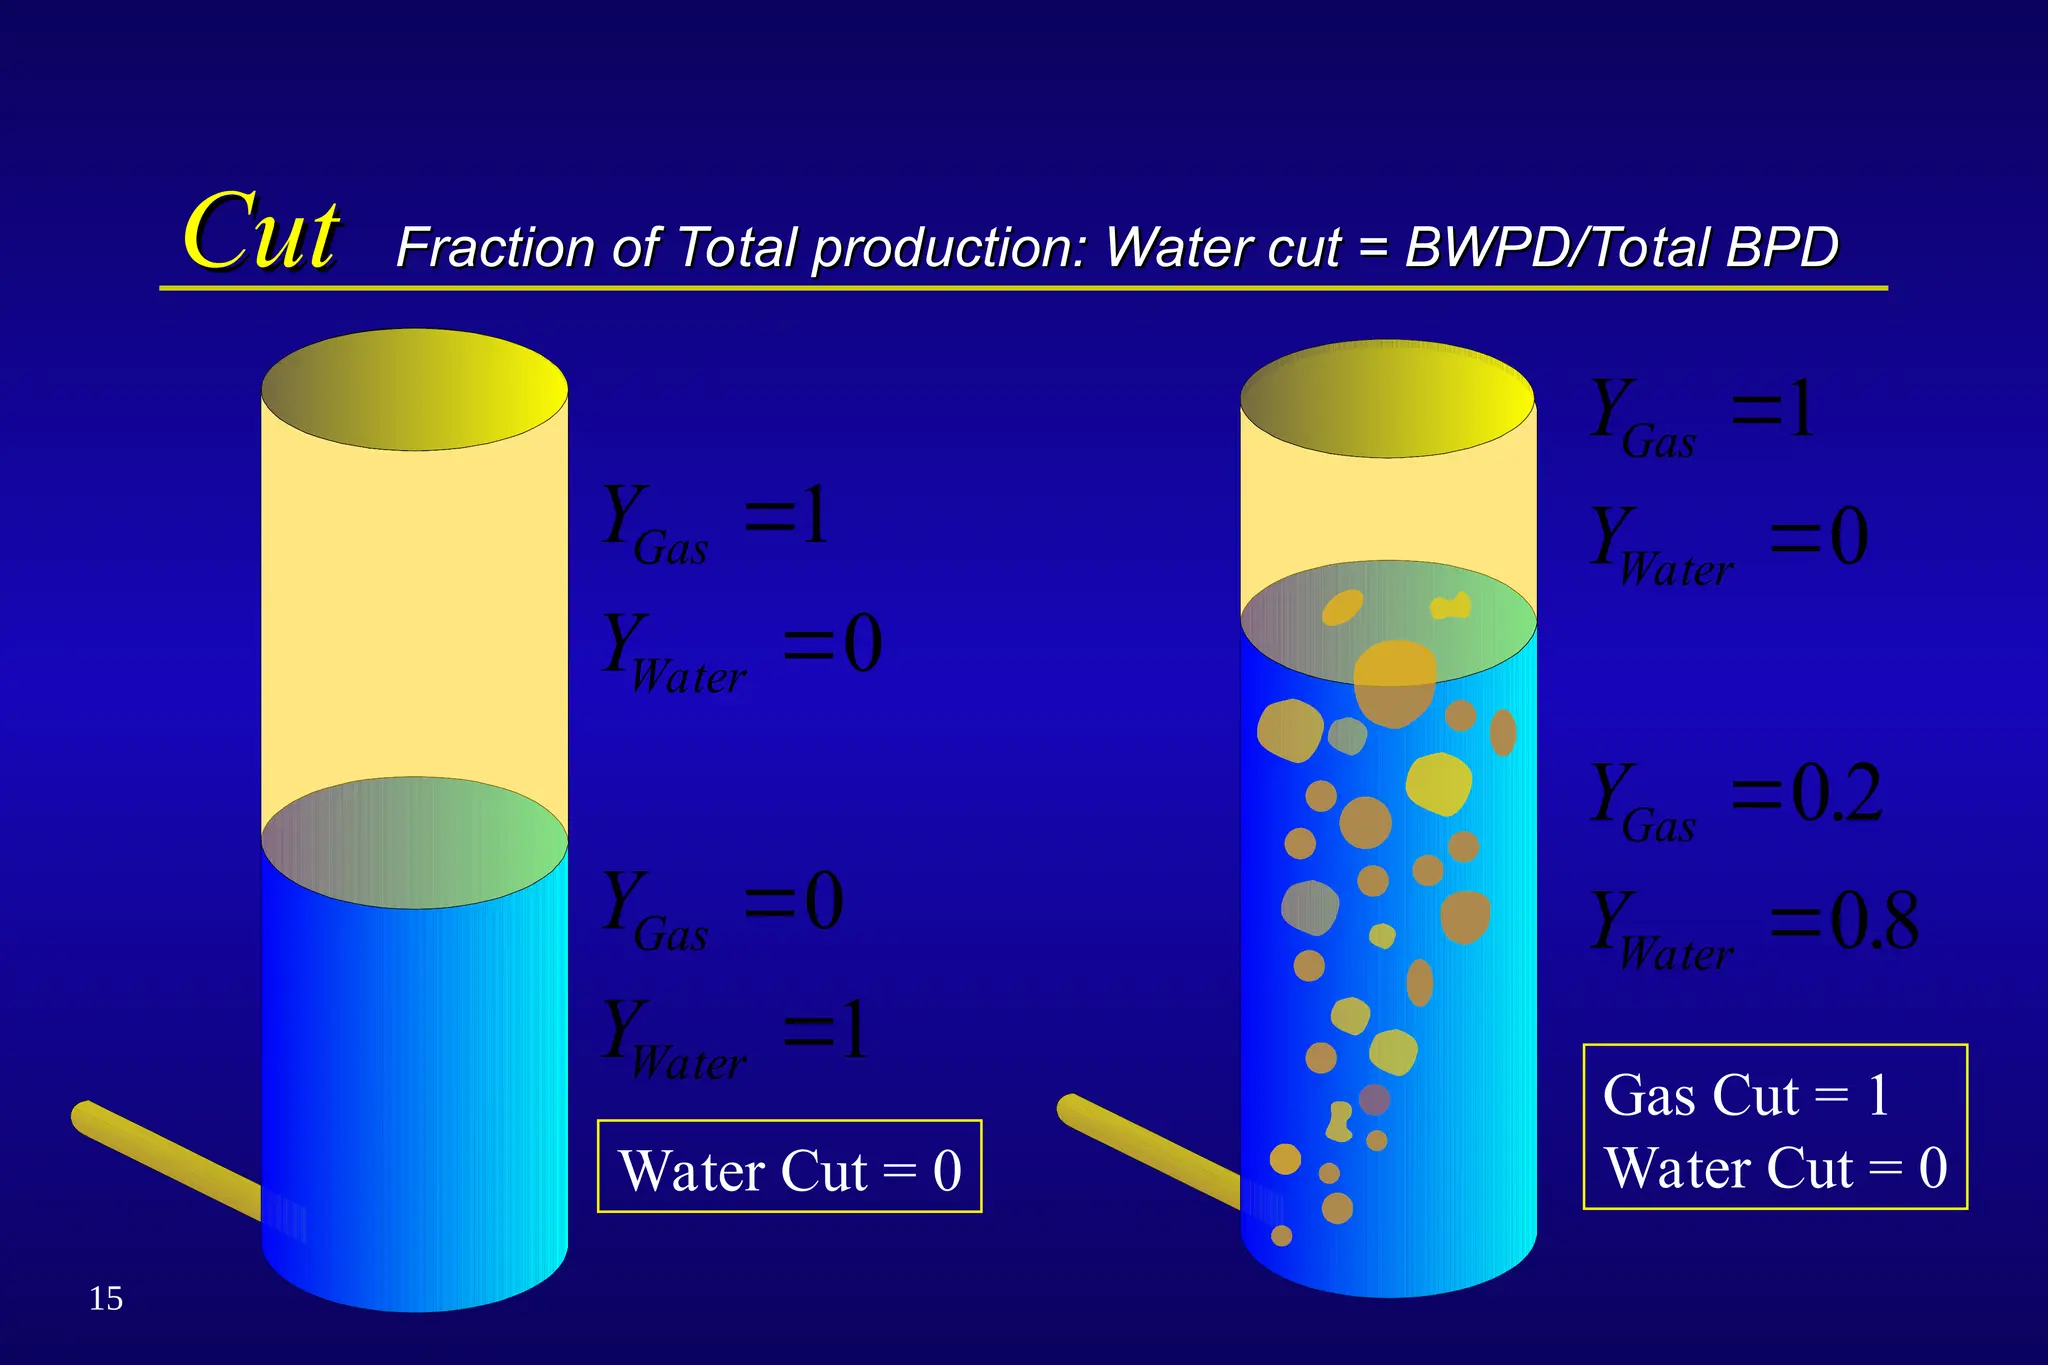
Cut Fraction ofTotal production: Water cut = BWPD/Total BPD
Fraction of Total production: Water cut = BWPD/Total BPD
Y
Y
Y
Y
Gas
Water
Gas
Water
1
0
02
08
.
.
Y
Y
Y
Y
Gas
Water
Gas
Water
1
0
0
1
Gas Cut = 1
Water Cut = 0
Water Cut = 0
16.
16
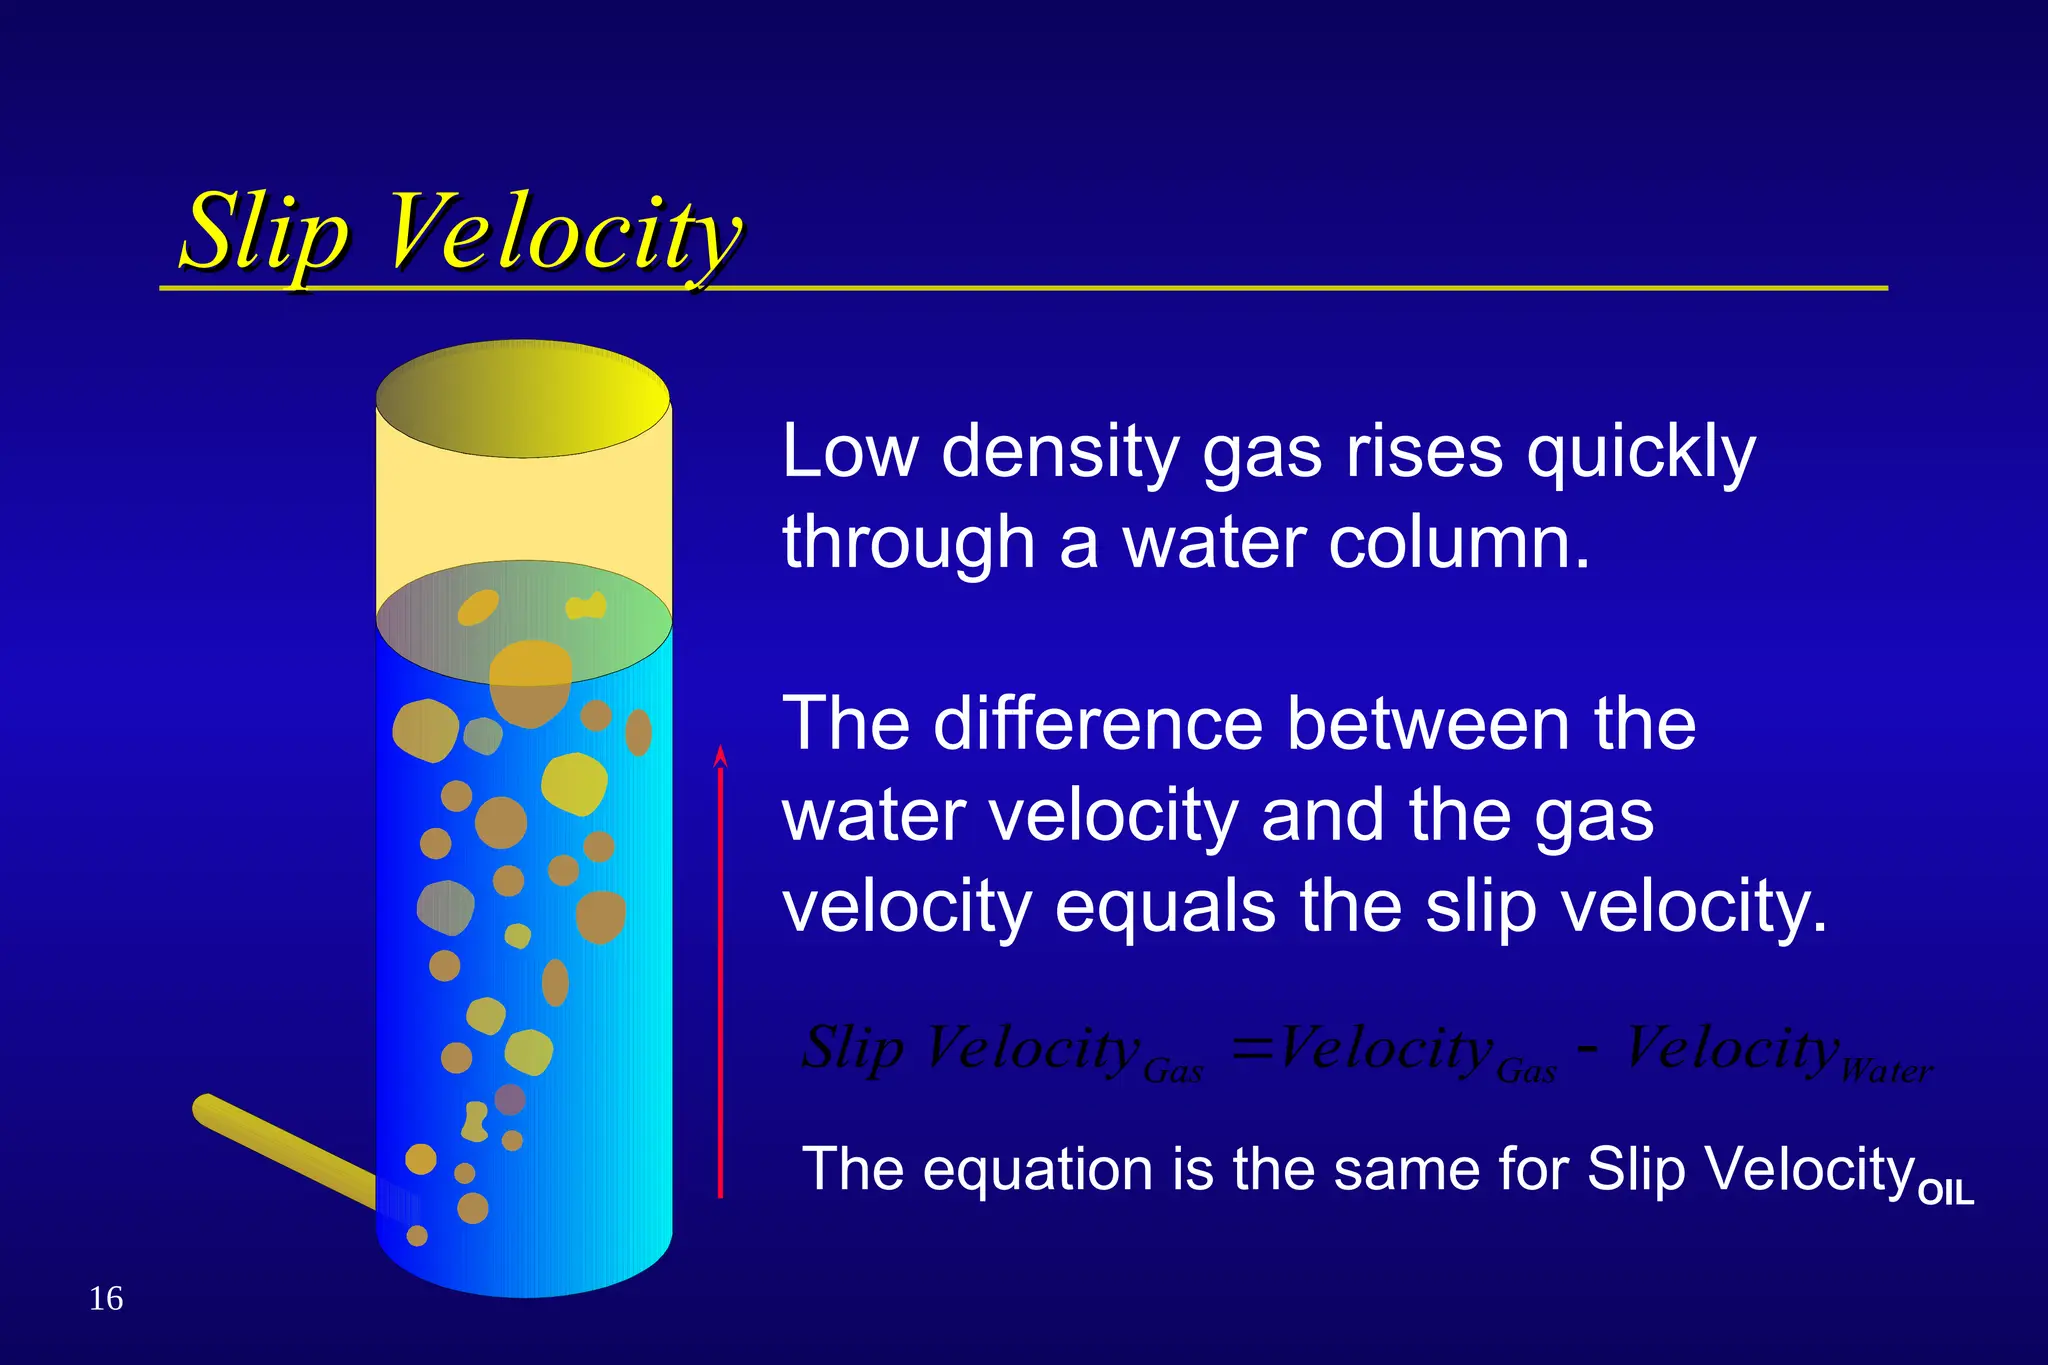
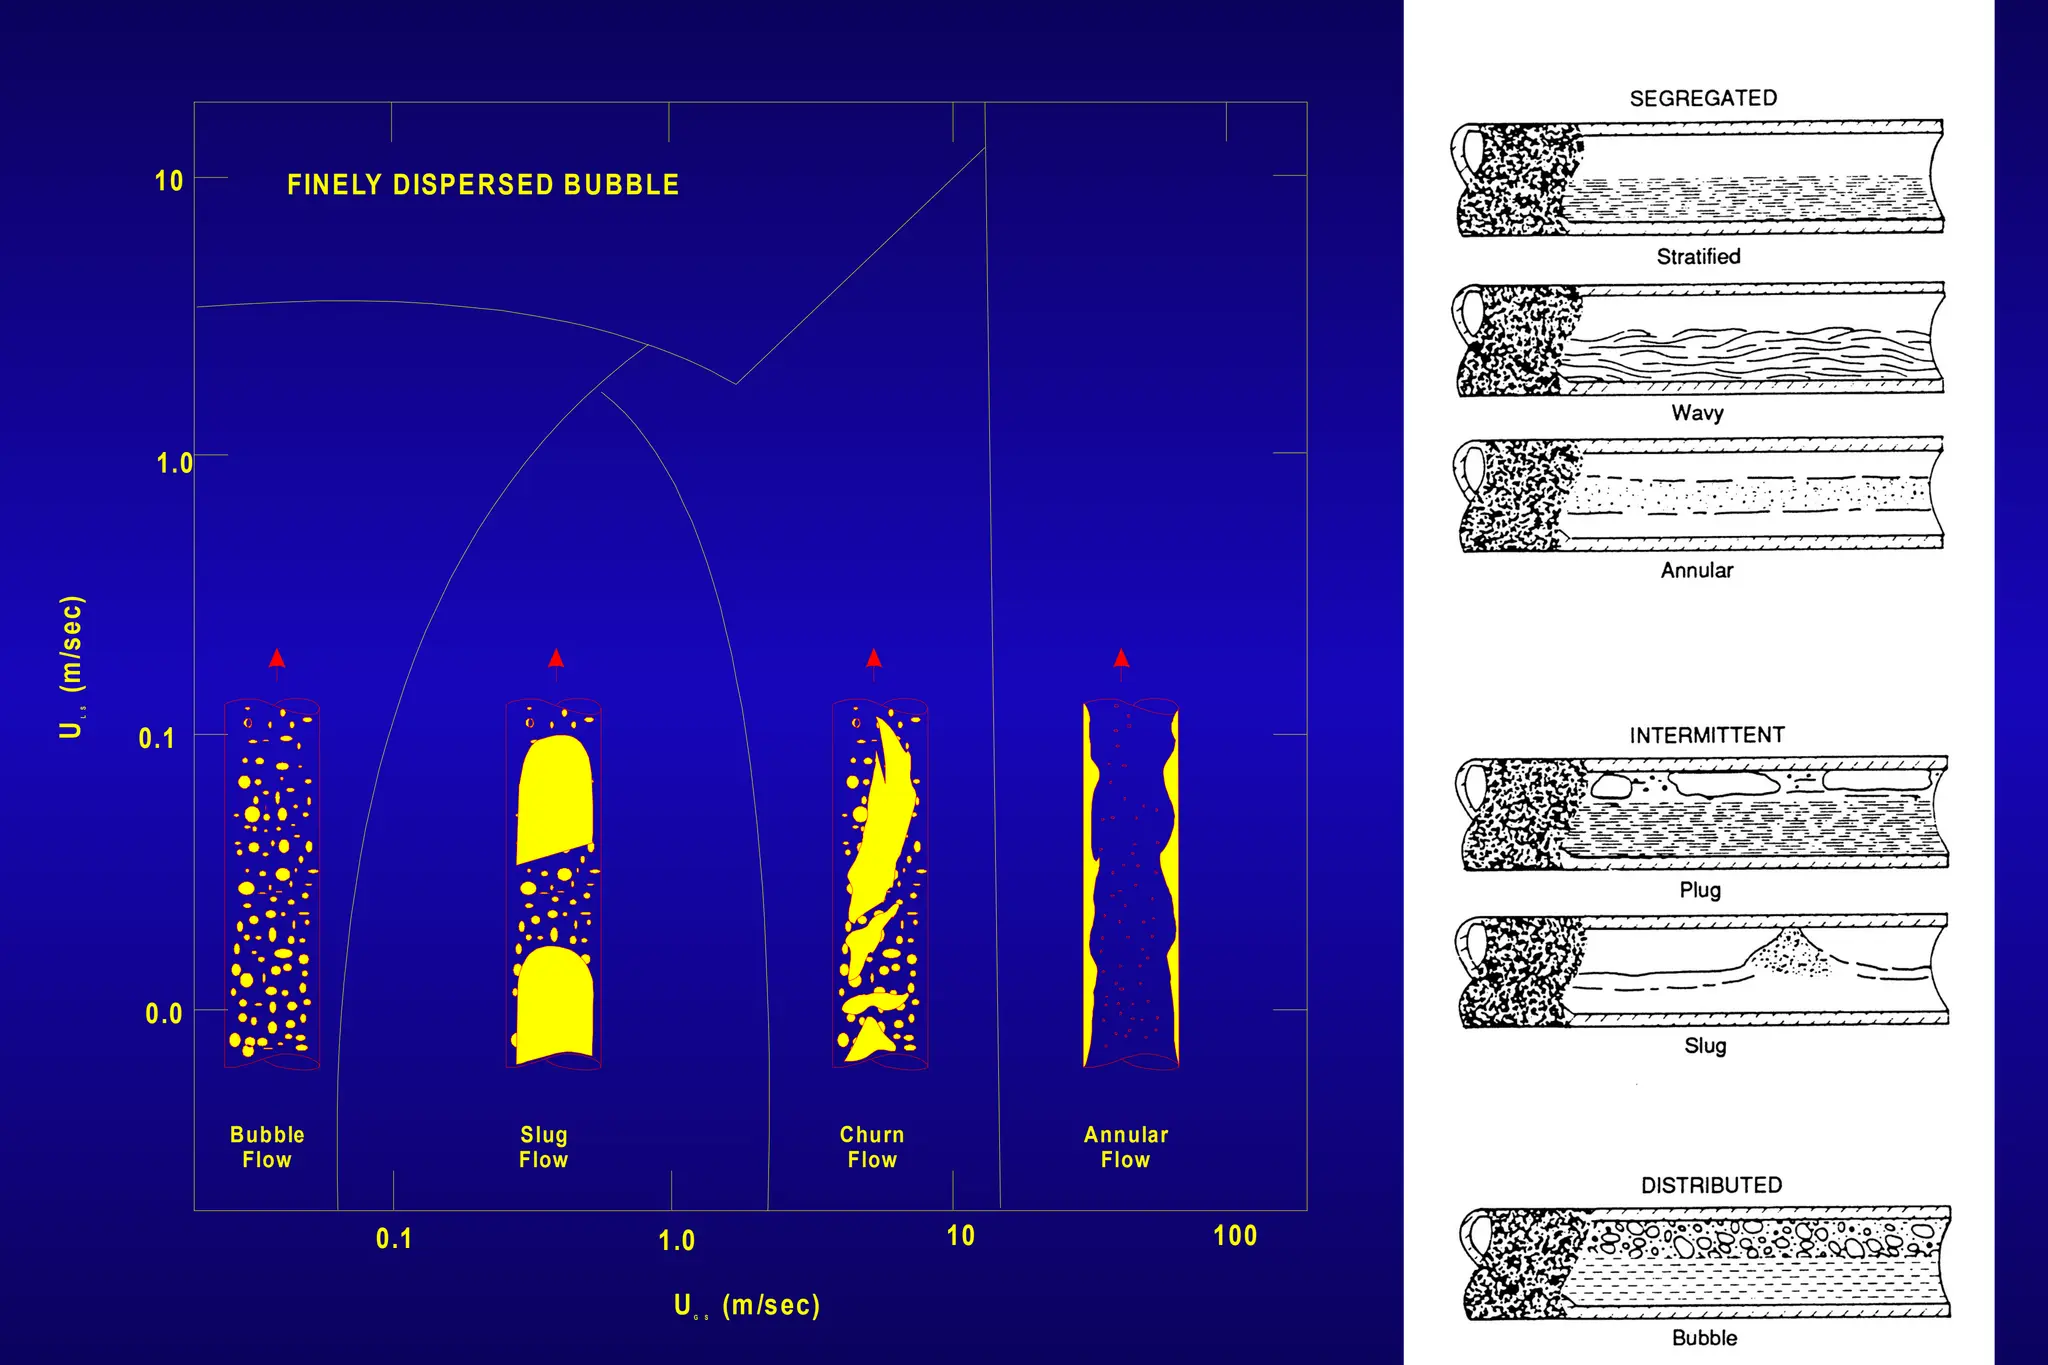
Slip Velocity
Slip Velocity
Lowdensity gas rises quickly
through a water column.
The difference between the
water velocity and the gas
velocity equals the slip velocity.
Slip Velocity Velocity Velocity
Gas Gas Water
The equation is the same for Slip VelocityOIL
20
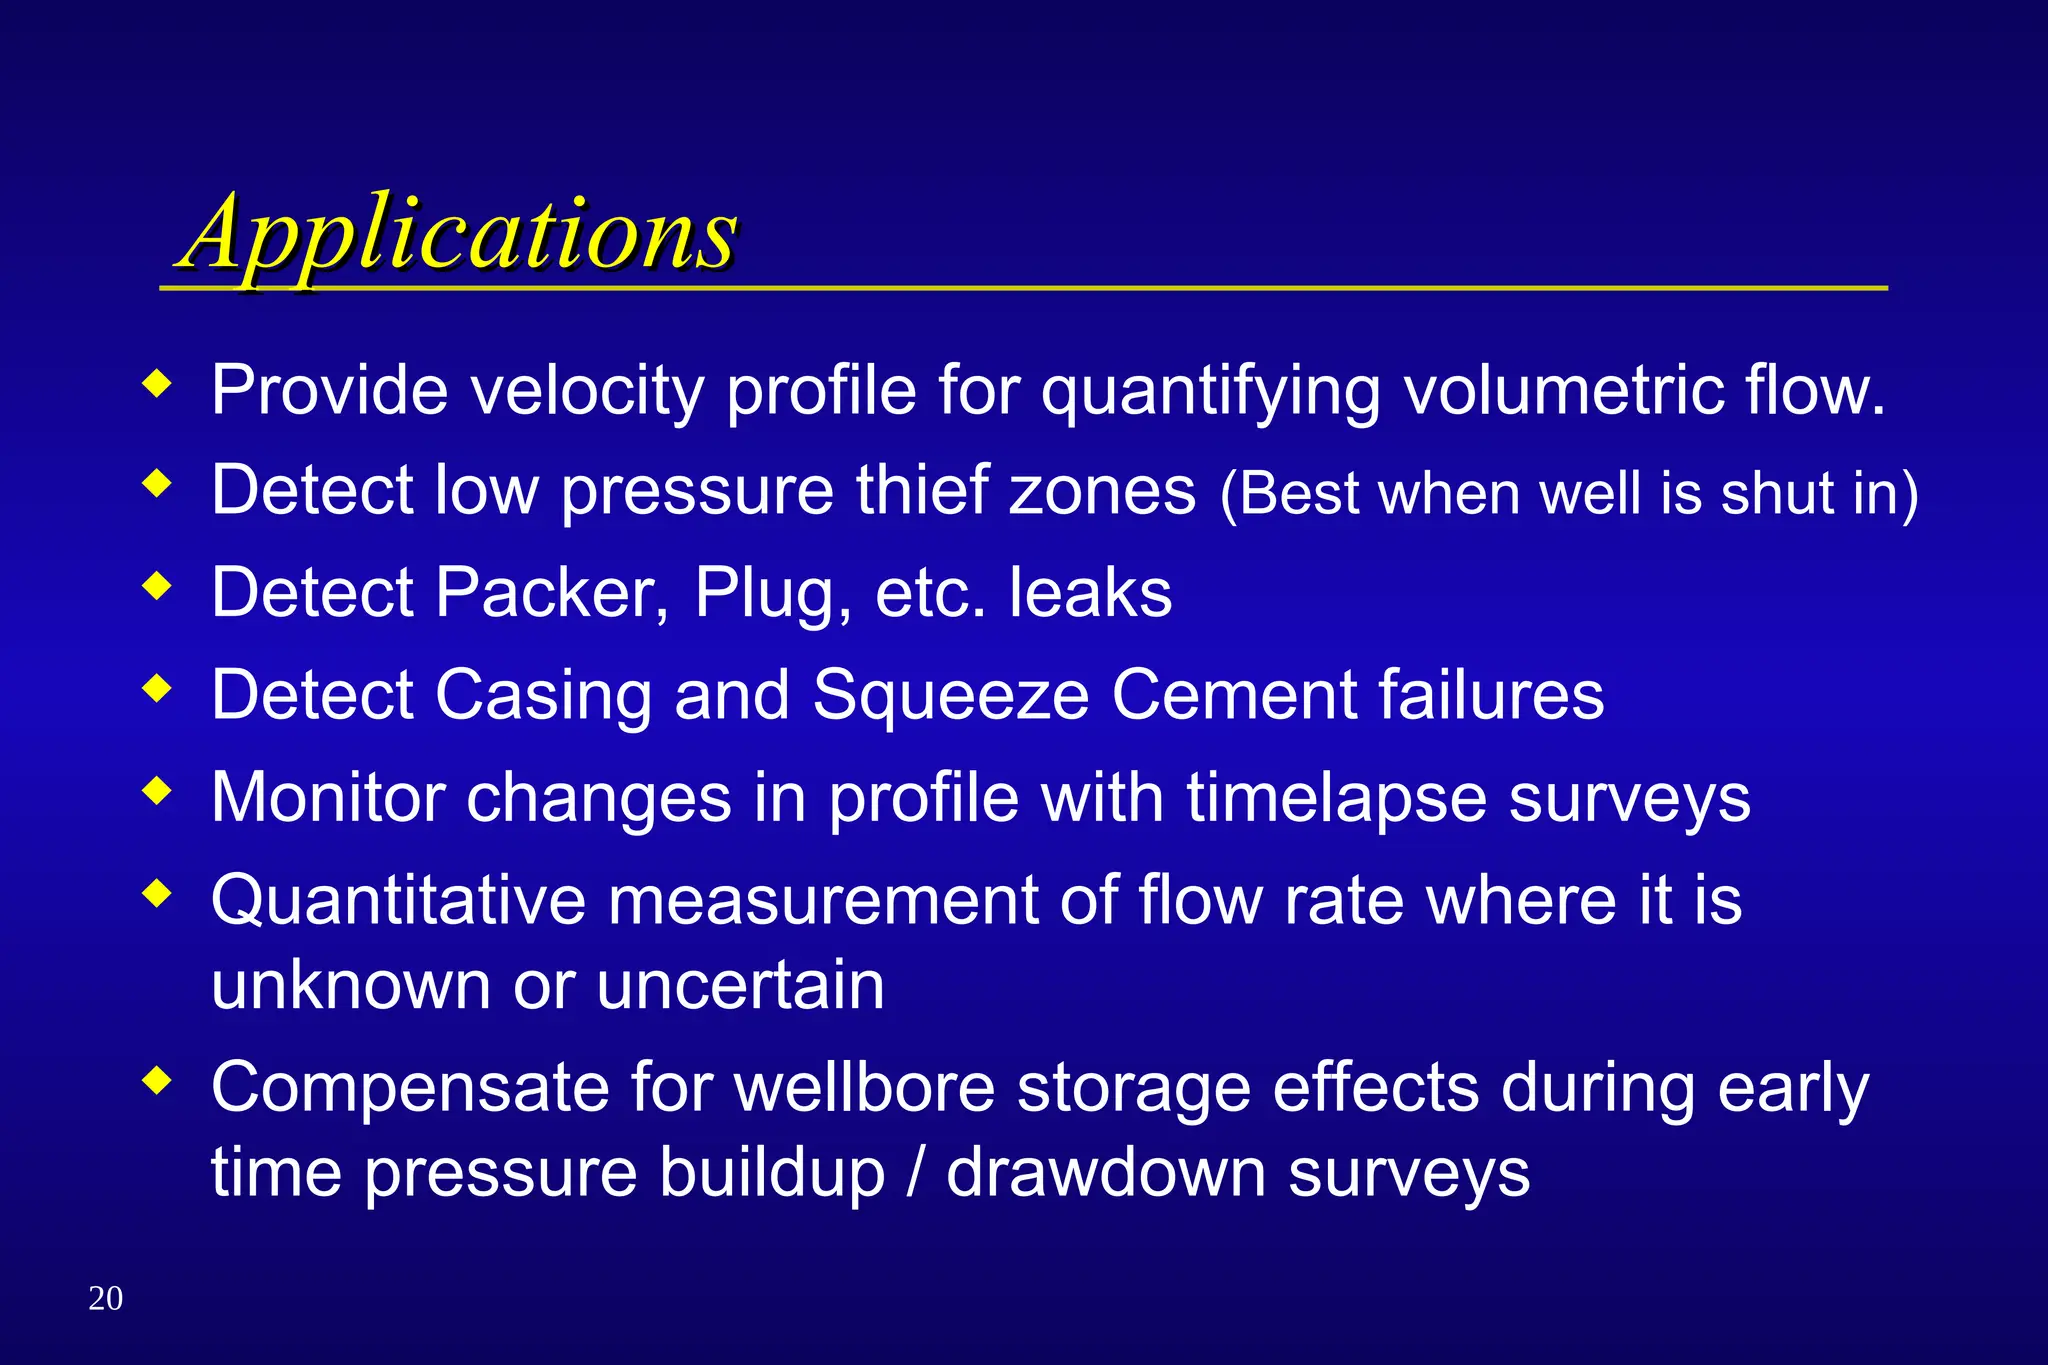
Applications
Applications
Provide velocityprofile for quantifying volumetric flow.
Detect low pressure thief zones (Best when well is shut in)
Detect Packer, Plug, etc. leaks
Detect Casing and Squeeze Cement failures
Monitor changes in profile with timelapse surveys
Quantitative measurement of flow rate where it is
unknown or uncertain
Compensate for wellbore storage effects during early
time pressure buildup / drawdown surveys
21.
21
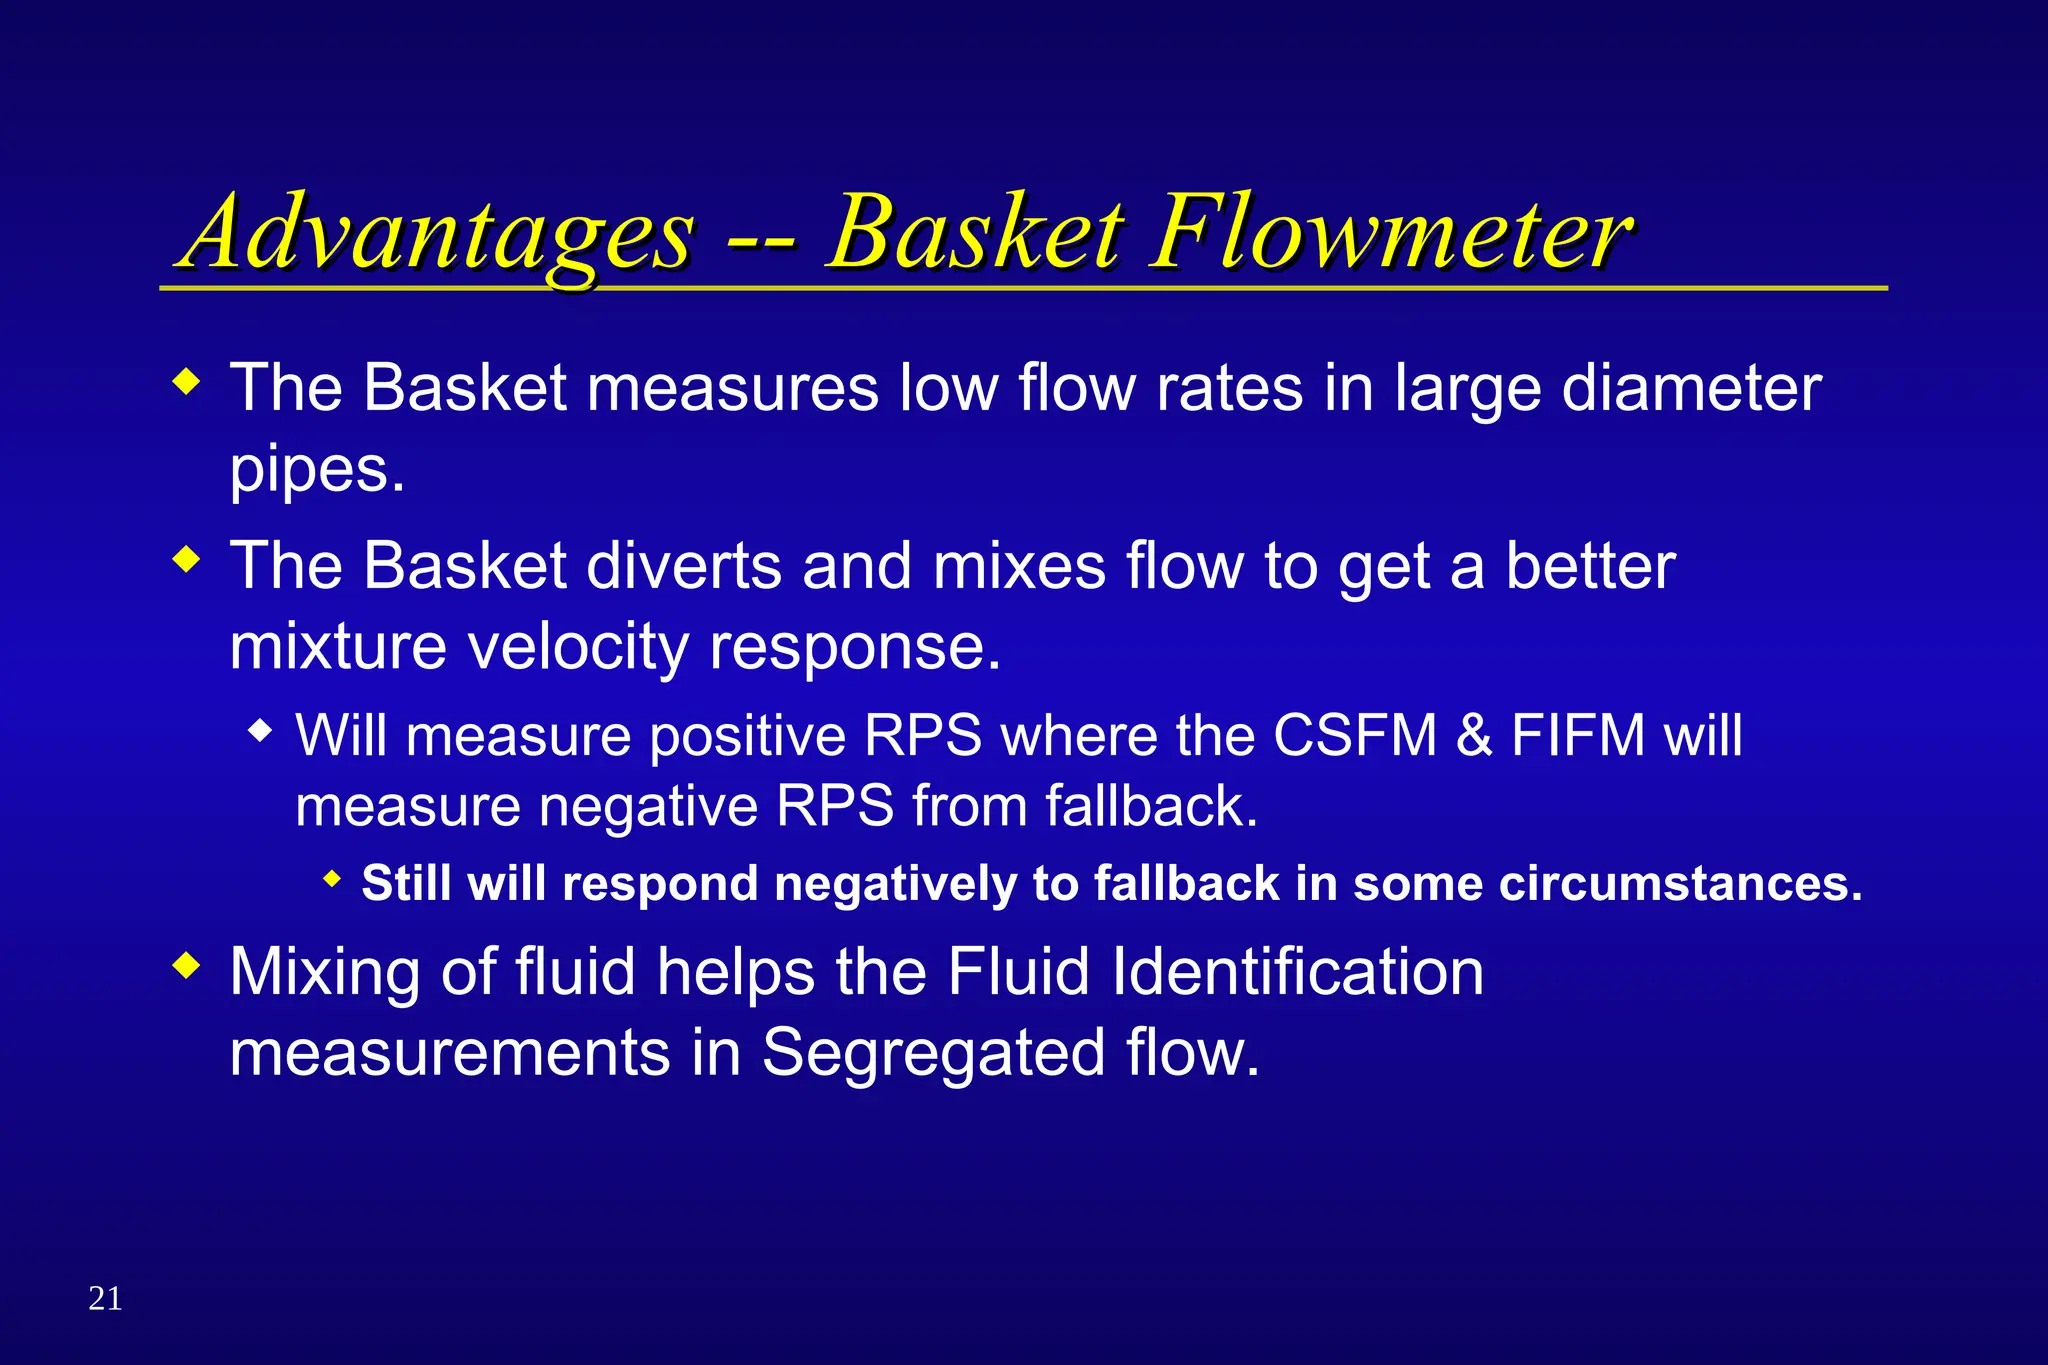
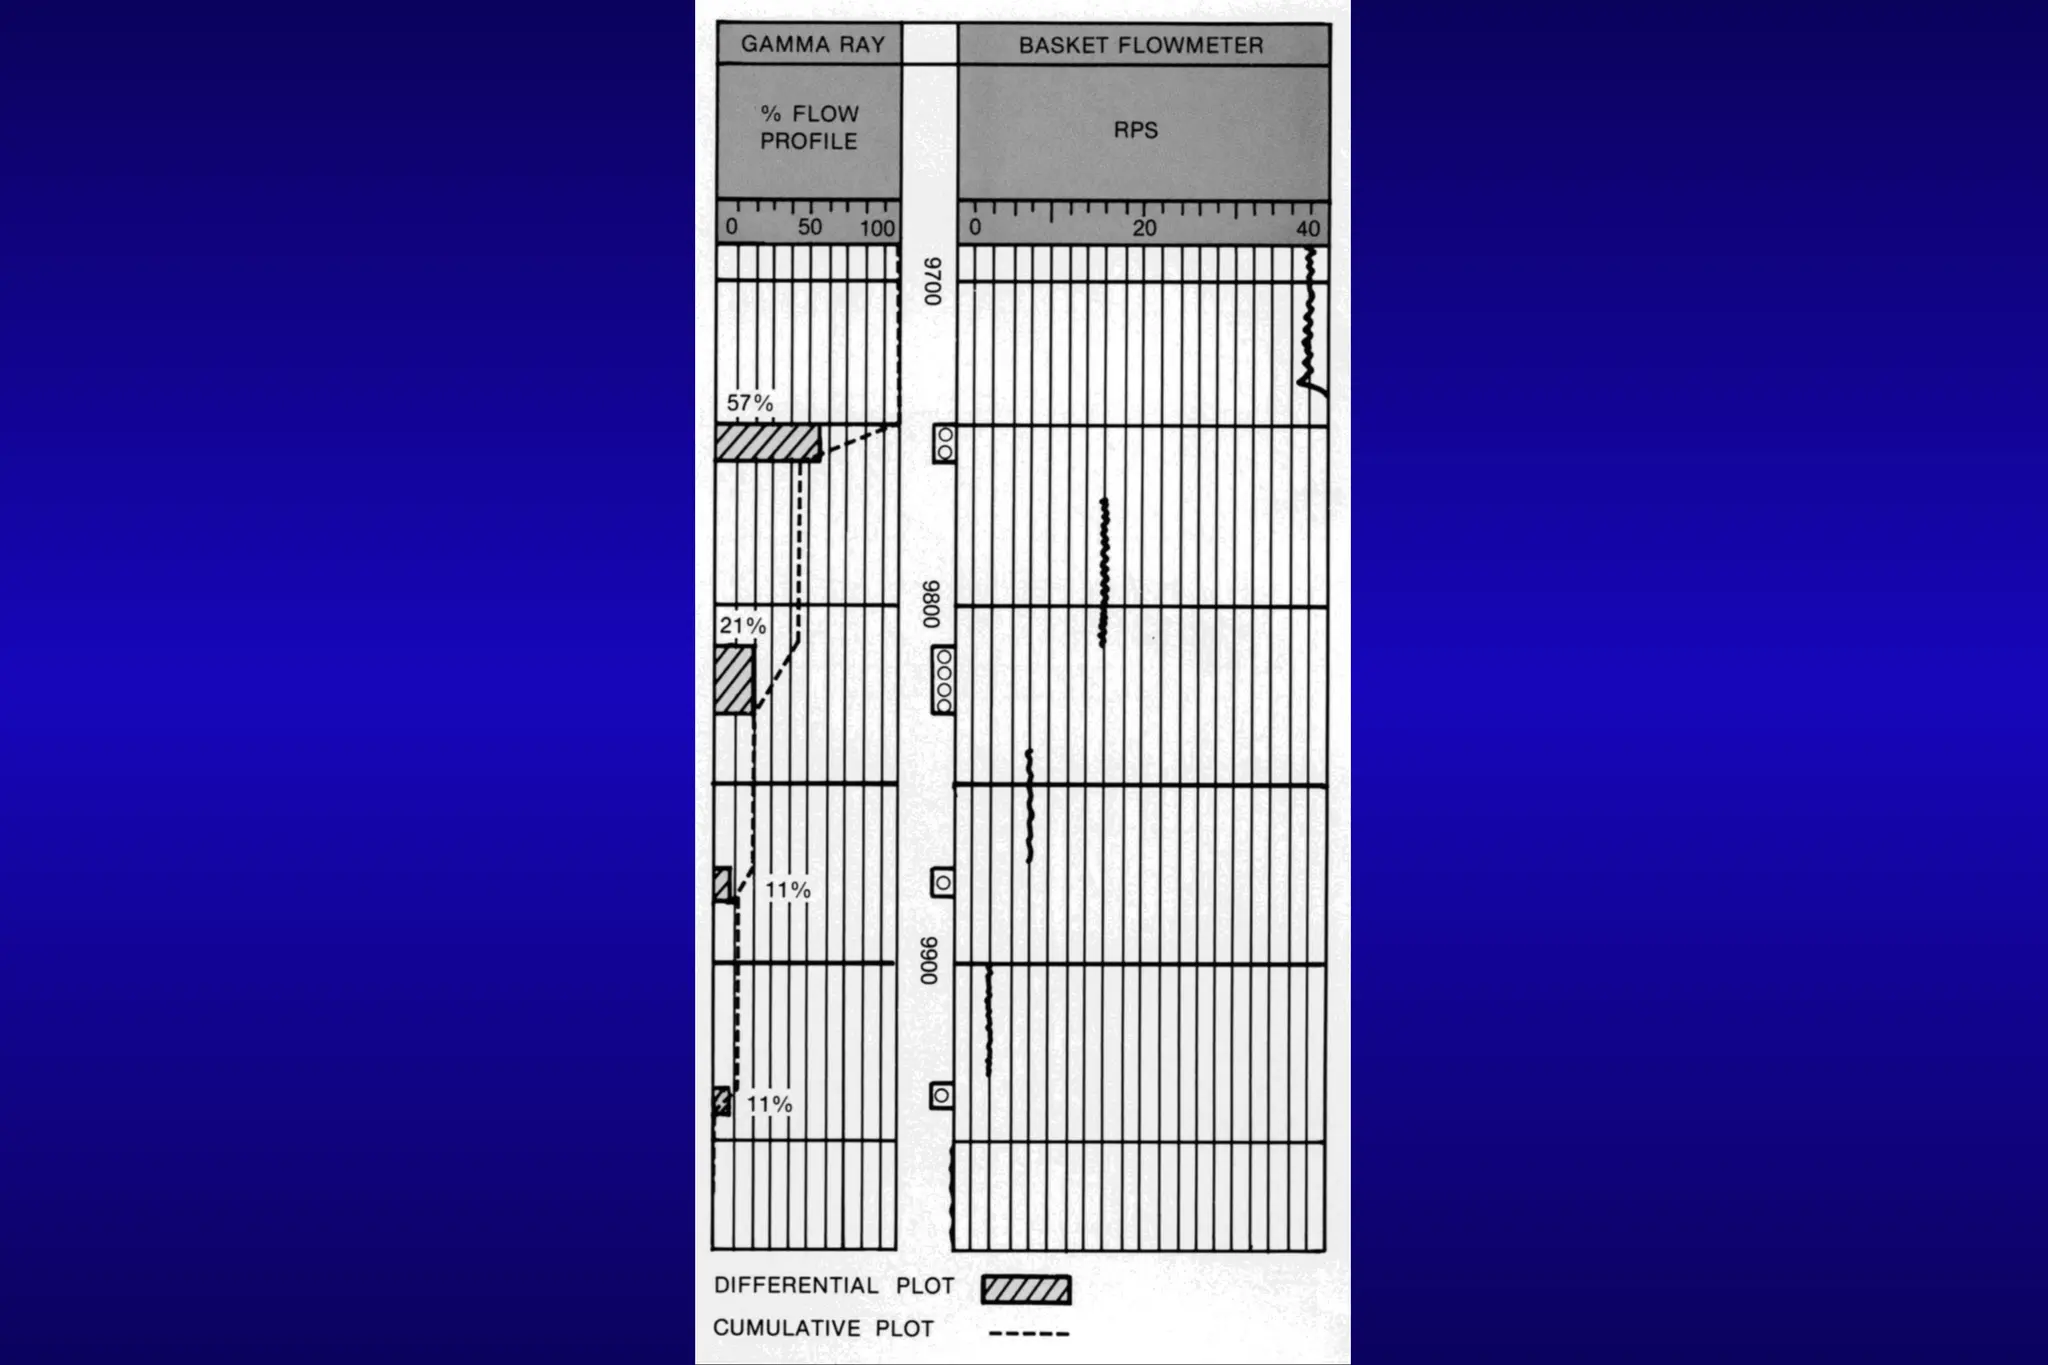
Advantages -- BasketFlowmeter
Advantages -- Basket Flowmeter
The Basket measures low flow rates in large diameter
pipes.
The Basket diverts and mixes flow to get a better
mixture velocity response.
Will measure positive RPS where the CSFM & FIFM will
measure negative RPS from fallback.
Still will respond negatively to fallback in some circumstances.
Mixing of fluid helps the Fluid Identification
measurements in Segregated flow.
22.
22
Basket Flowmeter --Logging Proc’s
Basket Flowmeter -- Logging Proc’s
Stationary measurements are made above
and below fluid entries.
Stationary measurements have a threshold of
50 to 100 BPD fluid production.
A continuous up run with an open Basket
Flowmeter provides a lower threshold and
more discretely identifies the depth of fluid
entries.
23.
23
Limitations -- BasketFlowmeter
Limitations -- Basket Flowmeter
When flowrates exceed 3000 barrels of liquid per day
an alternative Flowmeter device should be considered.
Rates of up to 3500 to 4000 BPD have been logged in 9-5/8”
casing.
16,000 plus BGPD, 79 BWPD in 7 inch casing.
80 RPS basket response (Upper limit approx. 200 RPS)
Typical restriction limitation is 1.81 inch S.N.
Have logged through 1.79 inch S.N. by removing every other
Basket petal.
24.
24
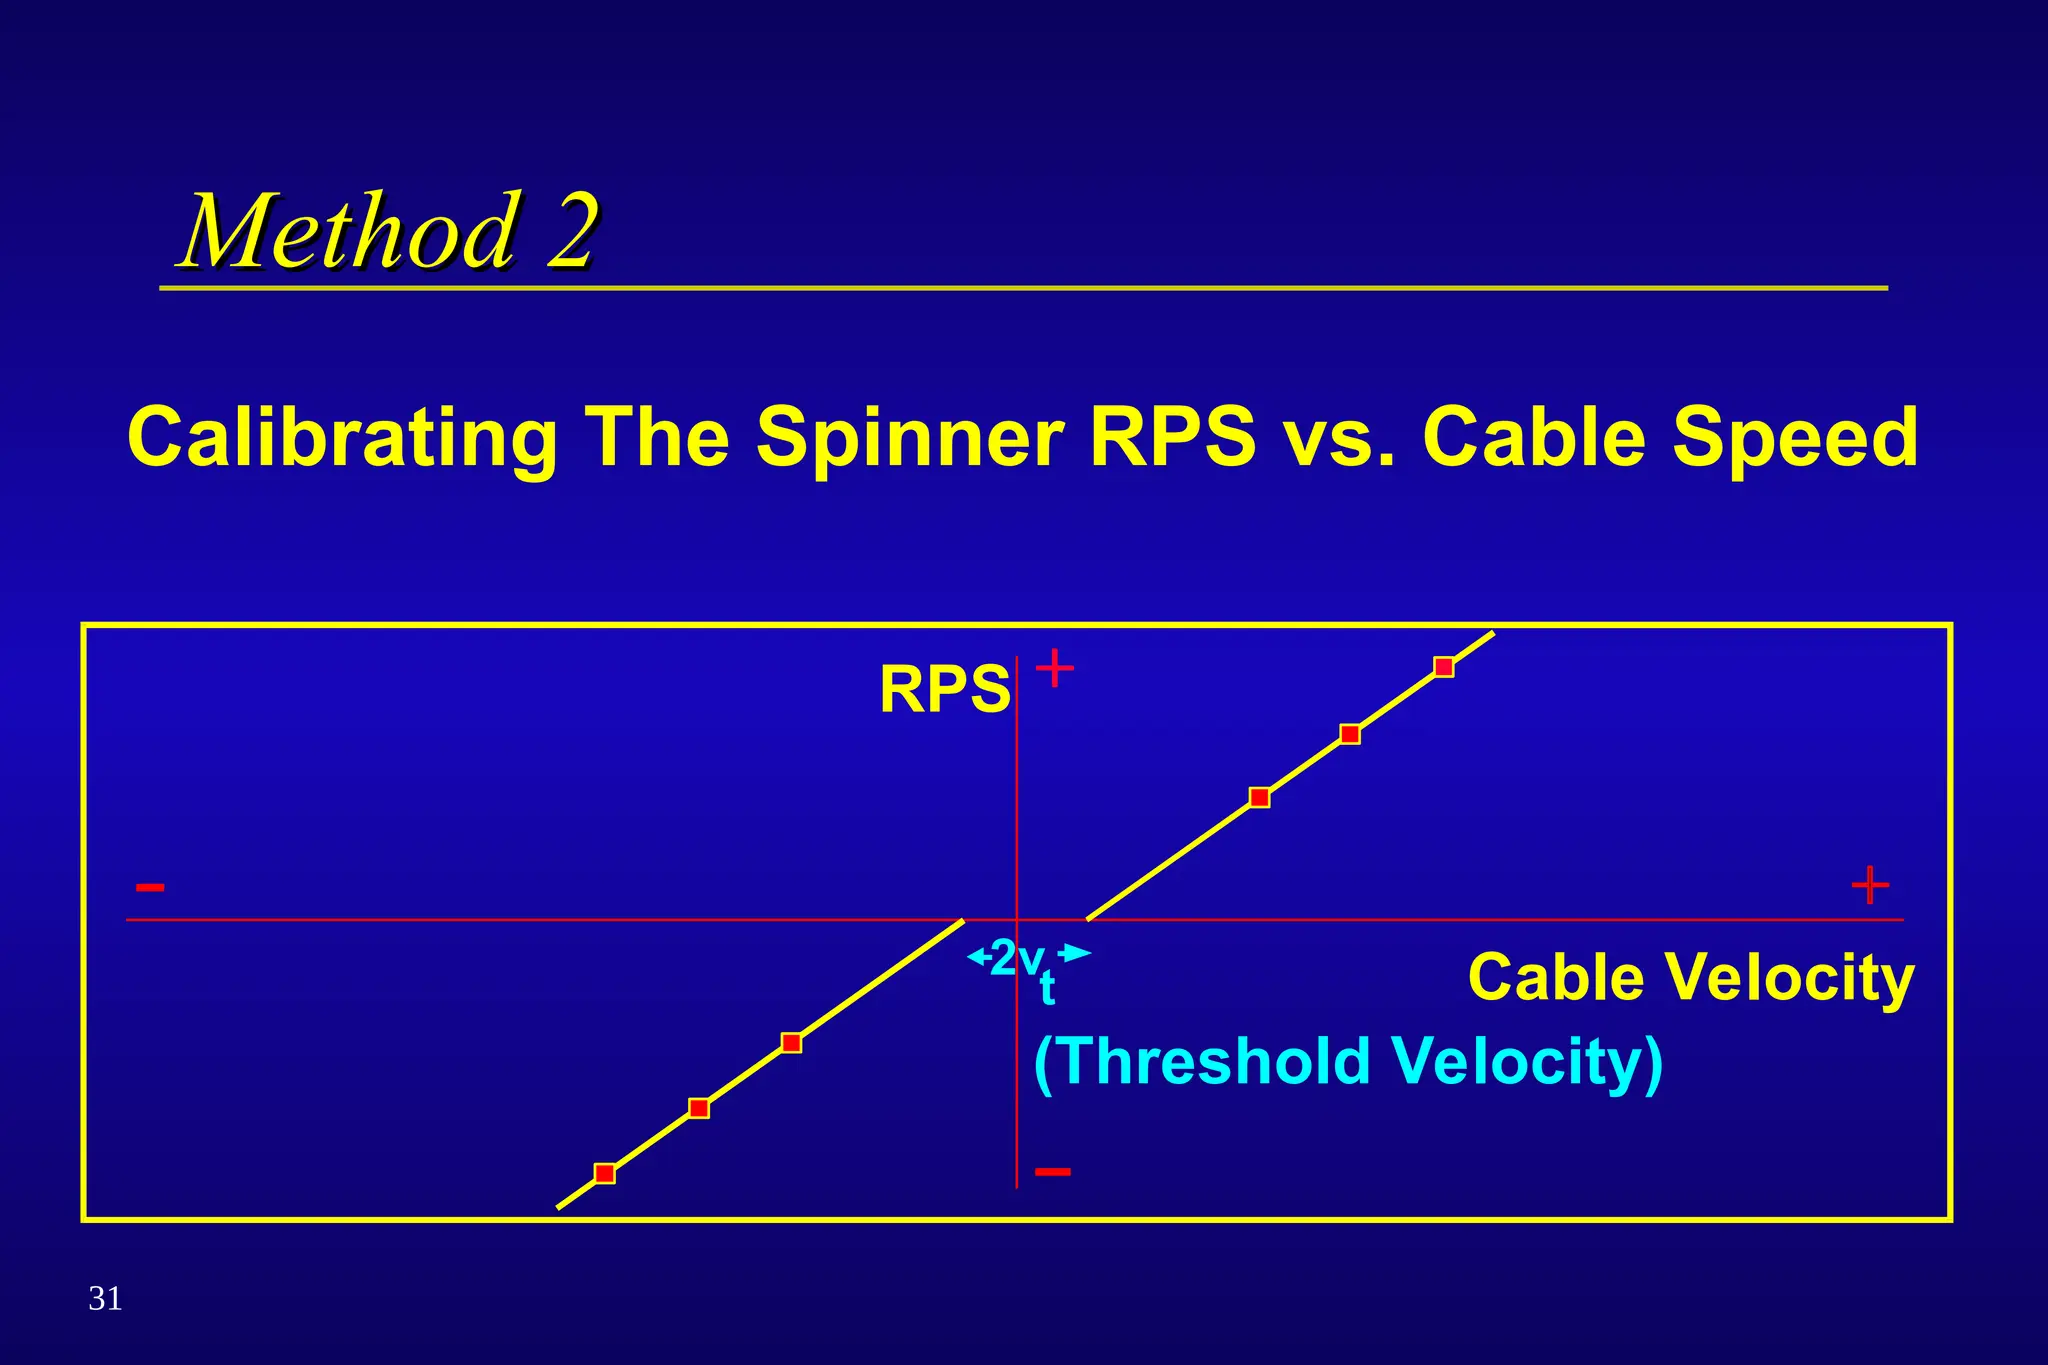
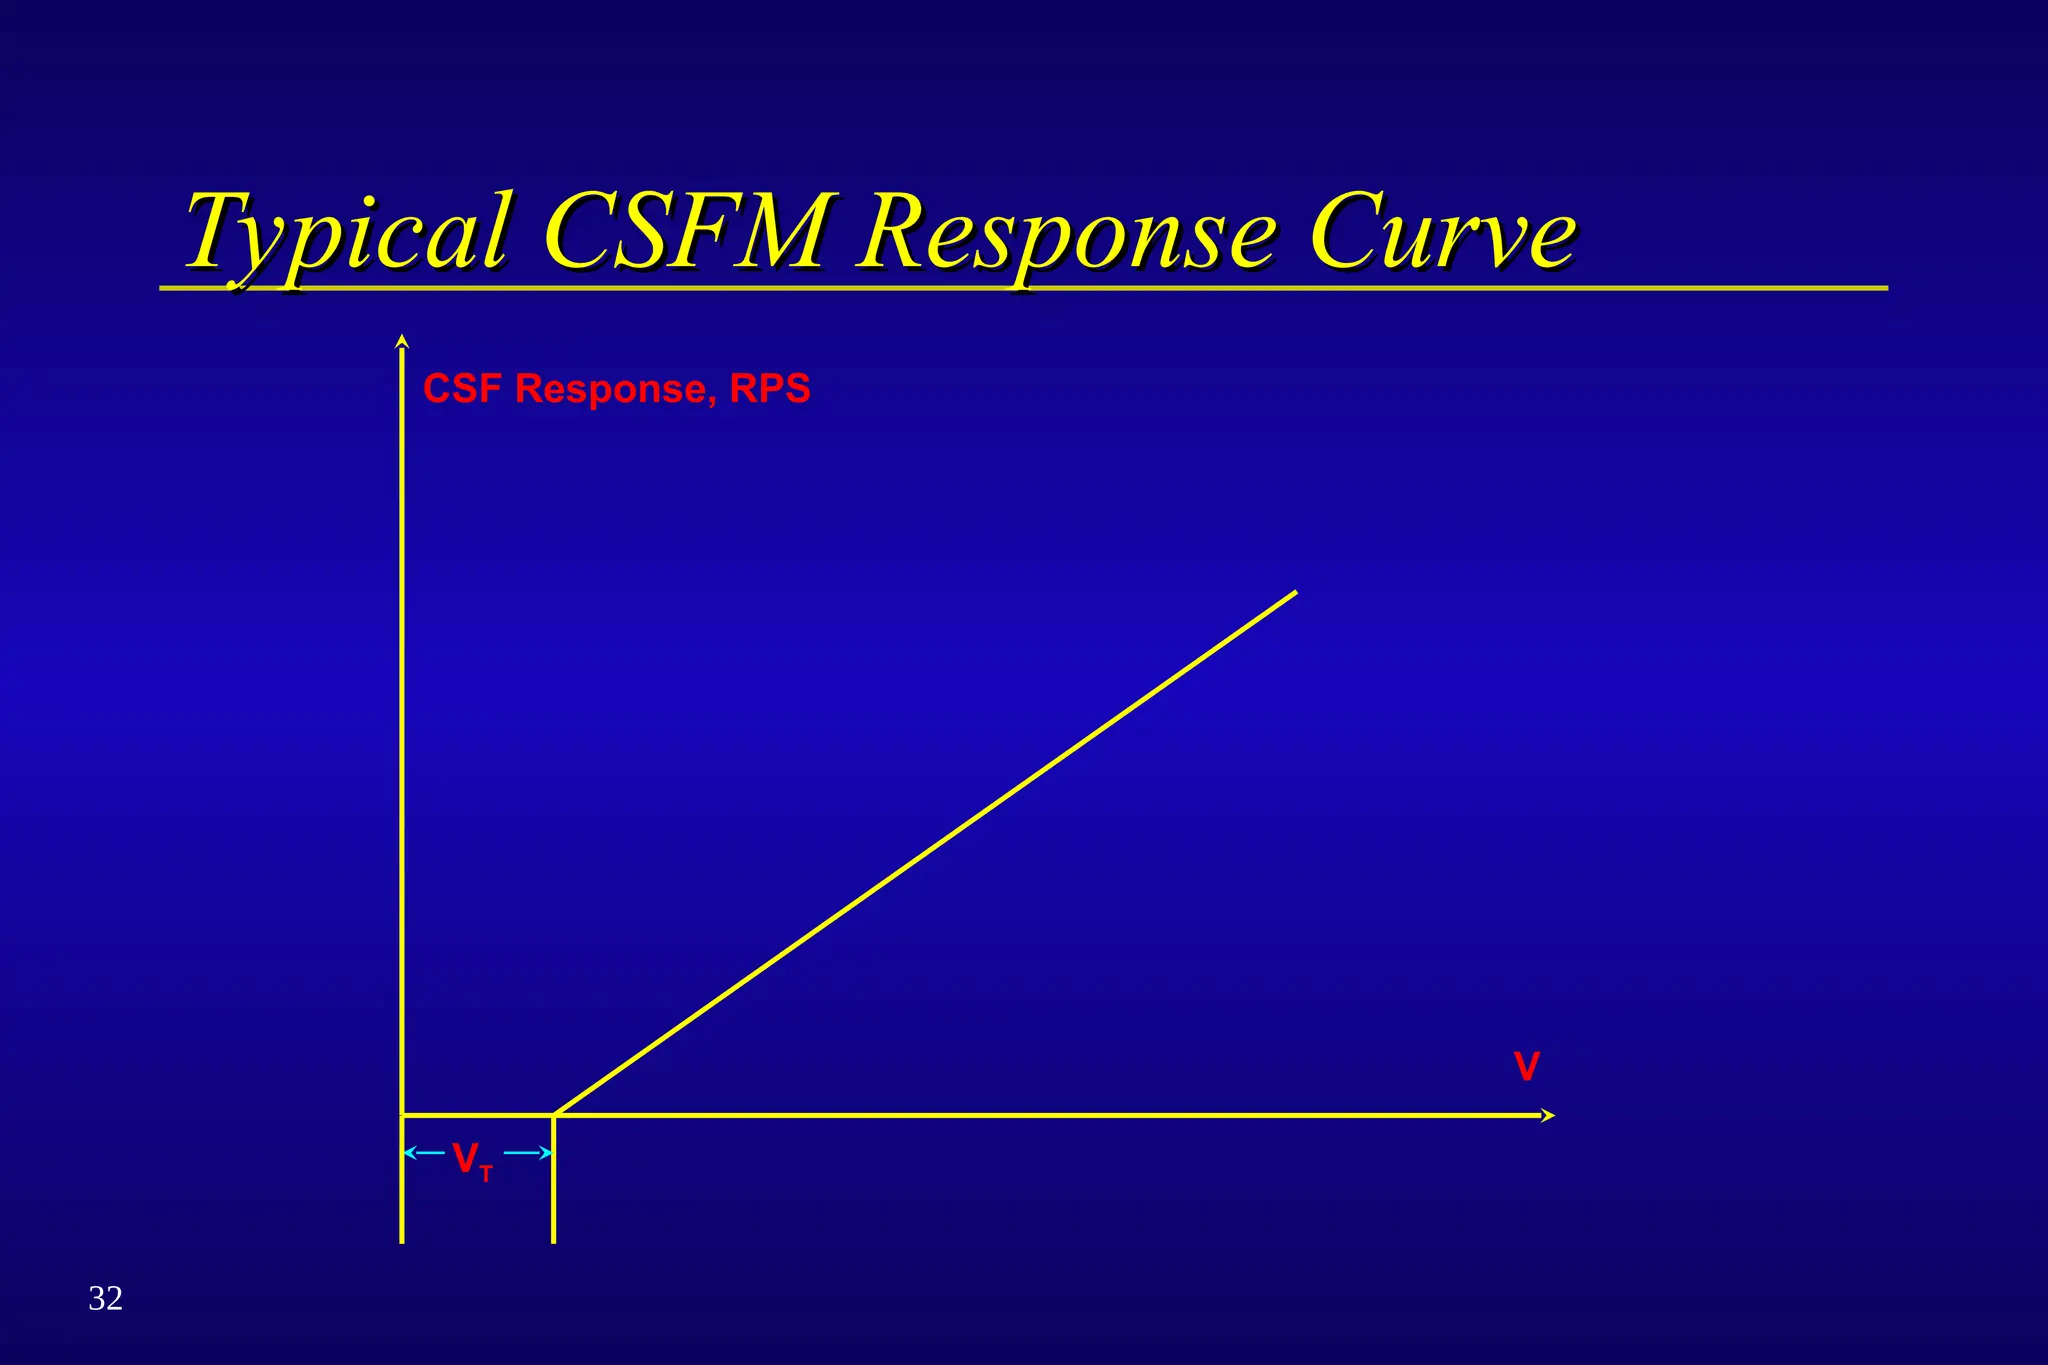
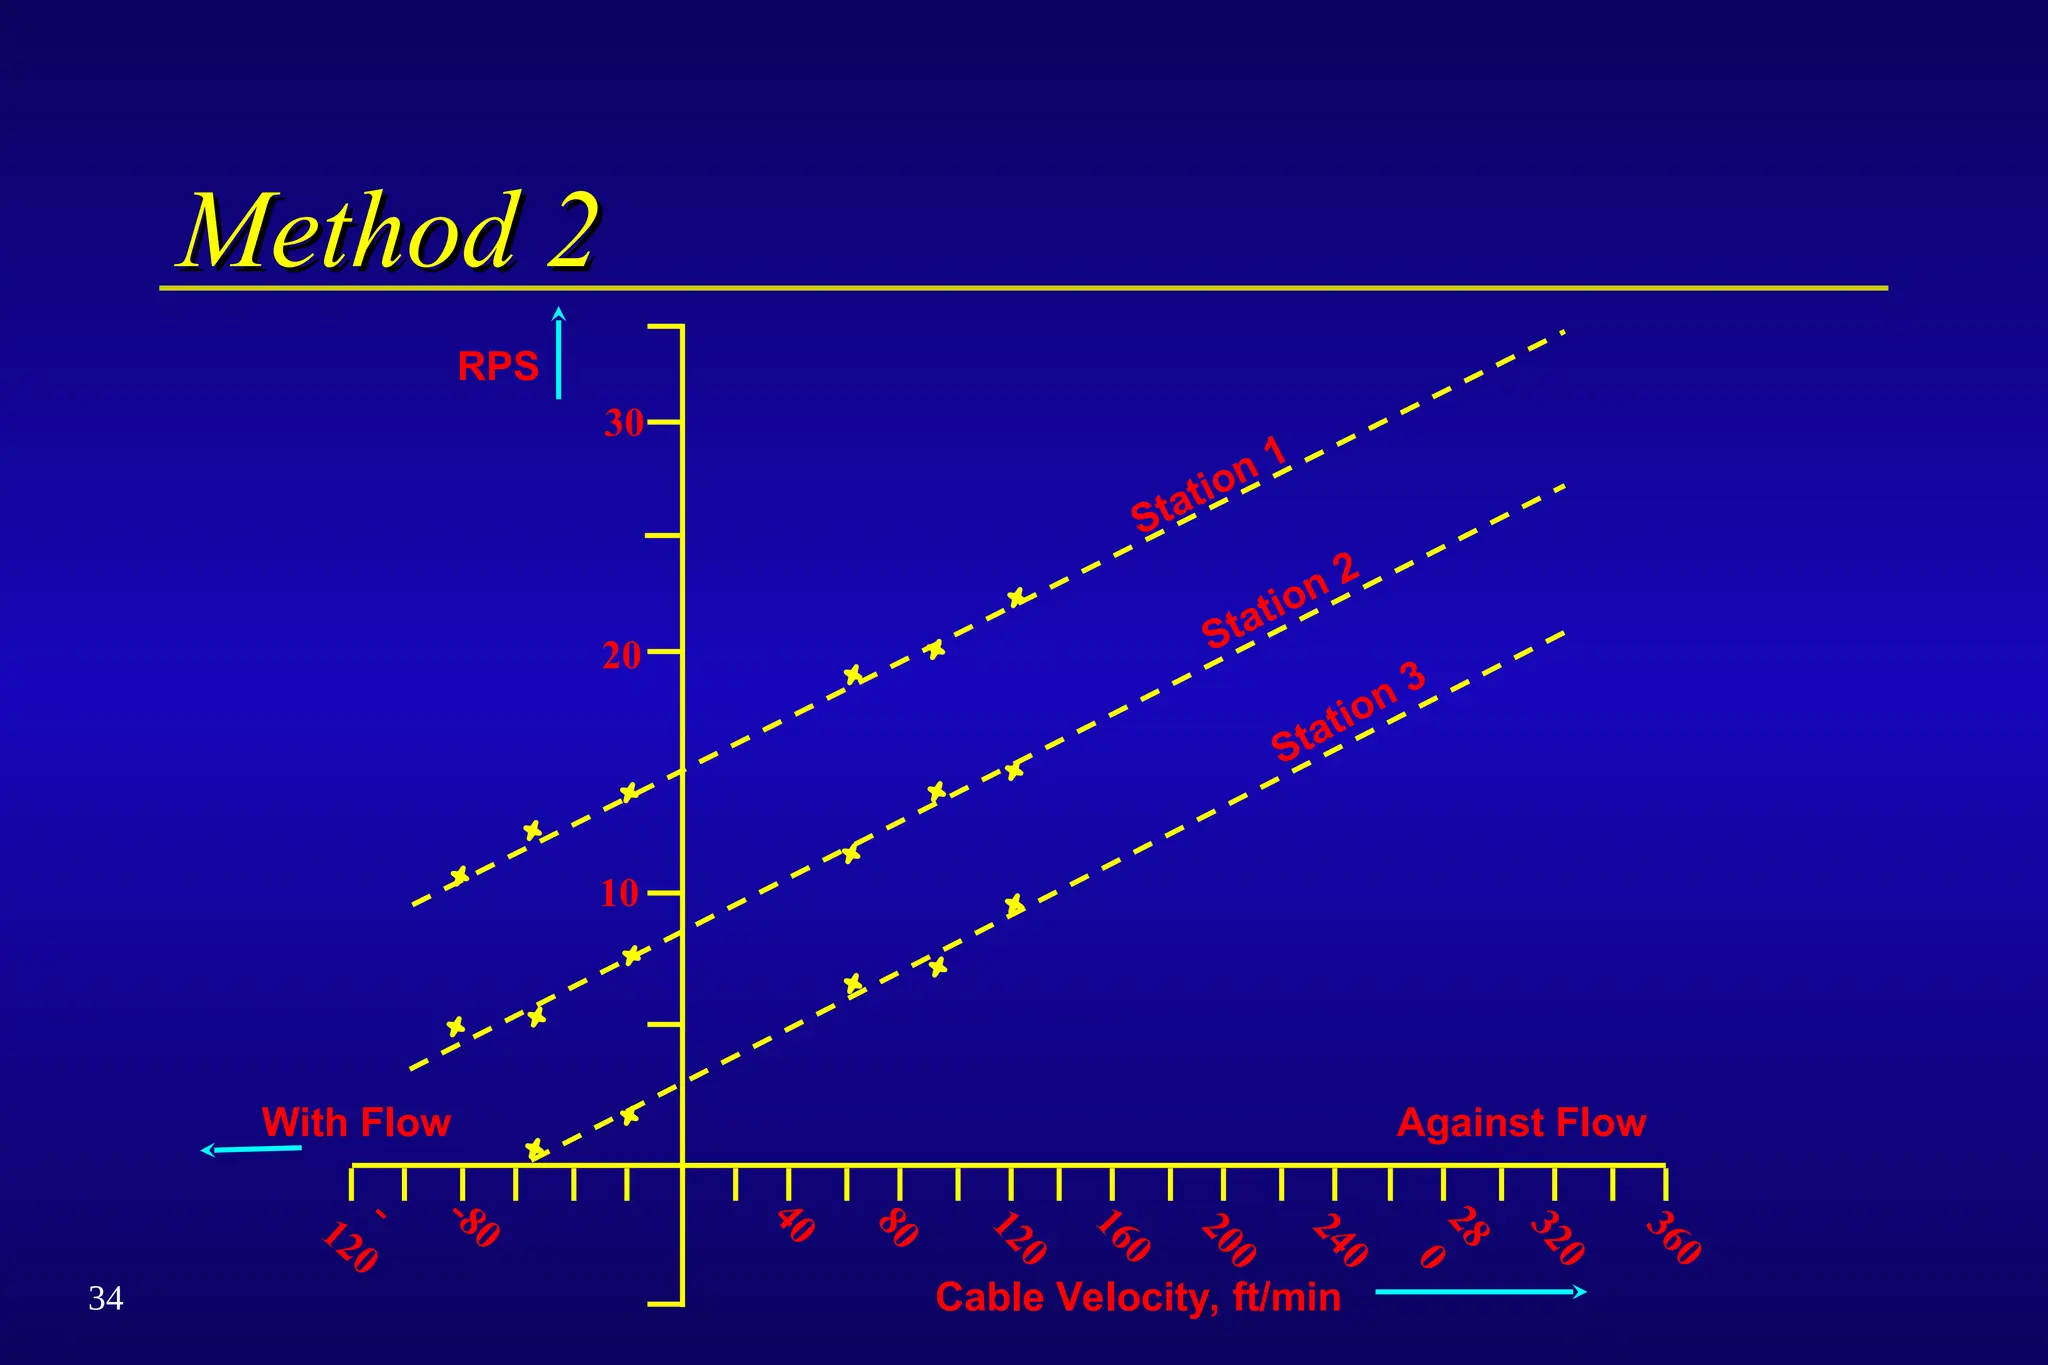
Measurement Principles
Measurement Principles
The spinner instruments incorporate an
impeller that is rotated by a moving liquid or
gas. The speed of the impeller rotation is
recorded in revolutions per second (RPS)
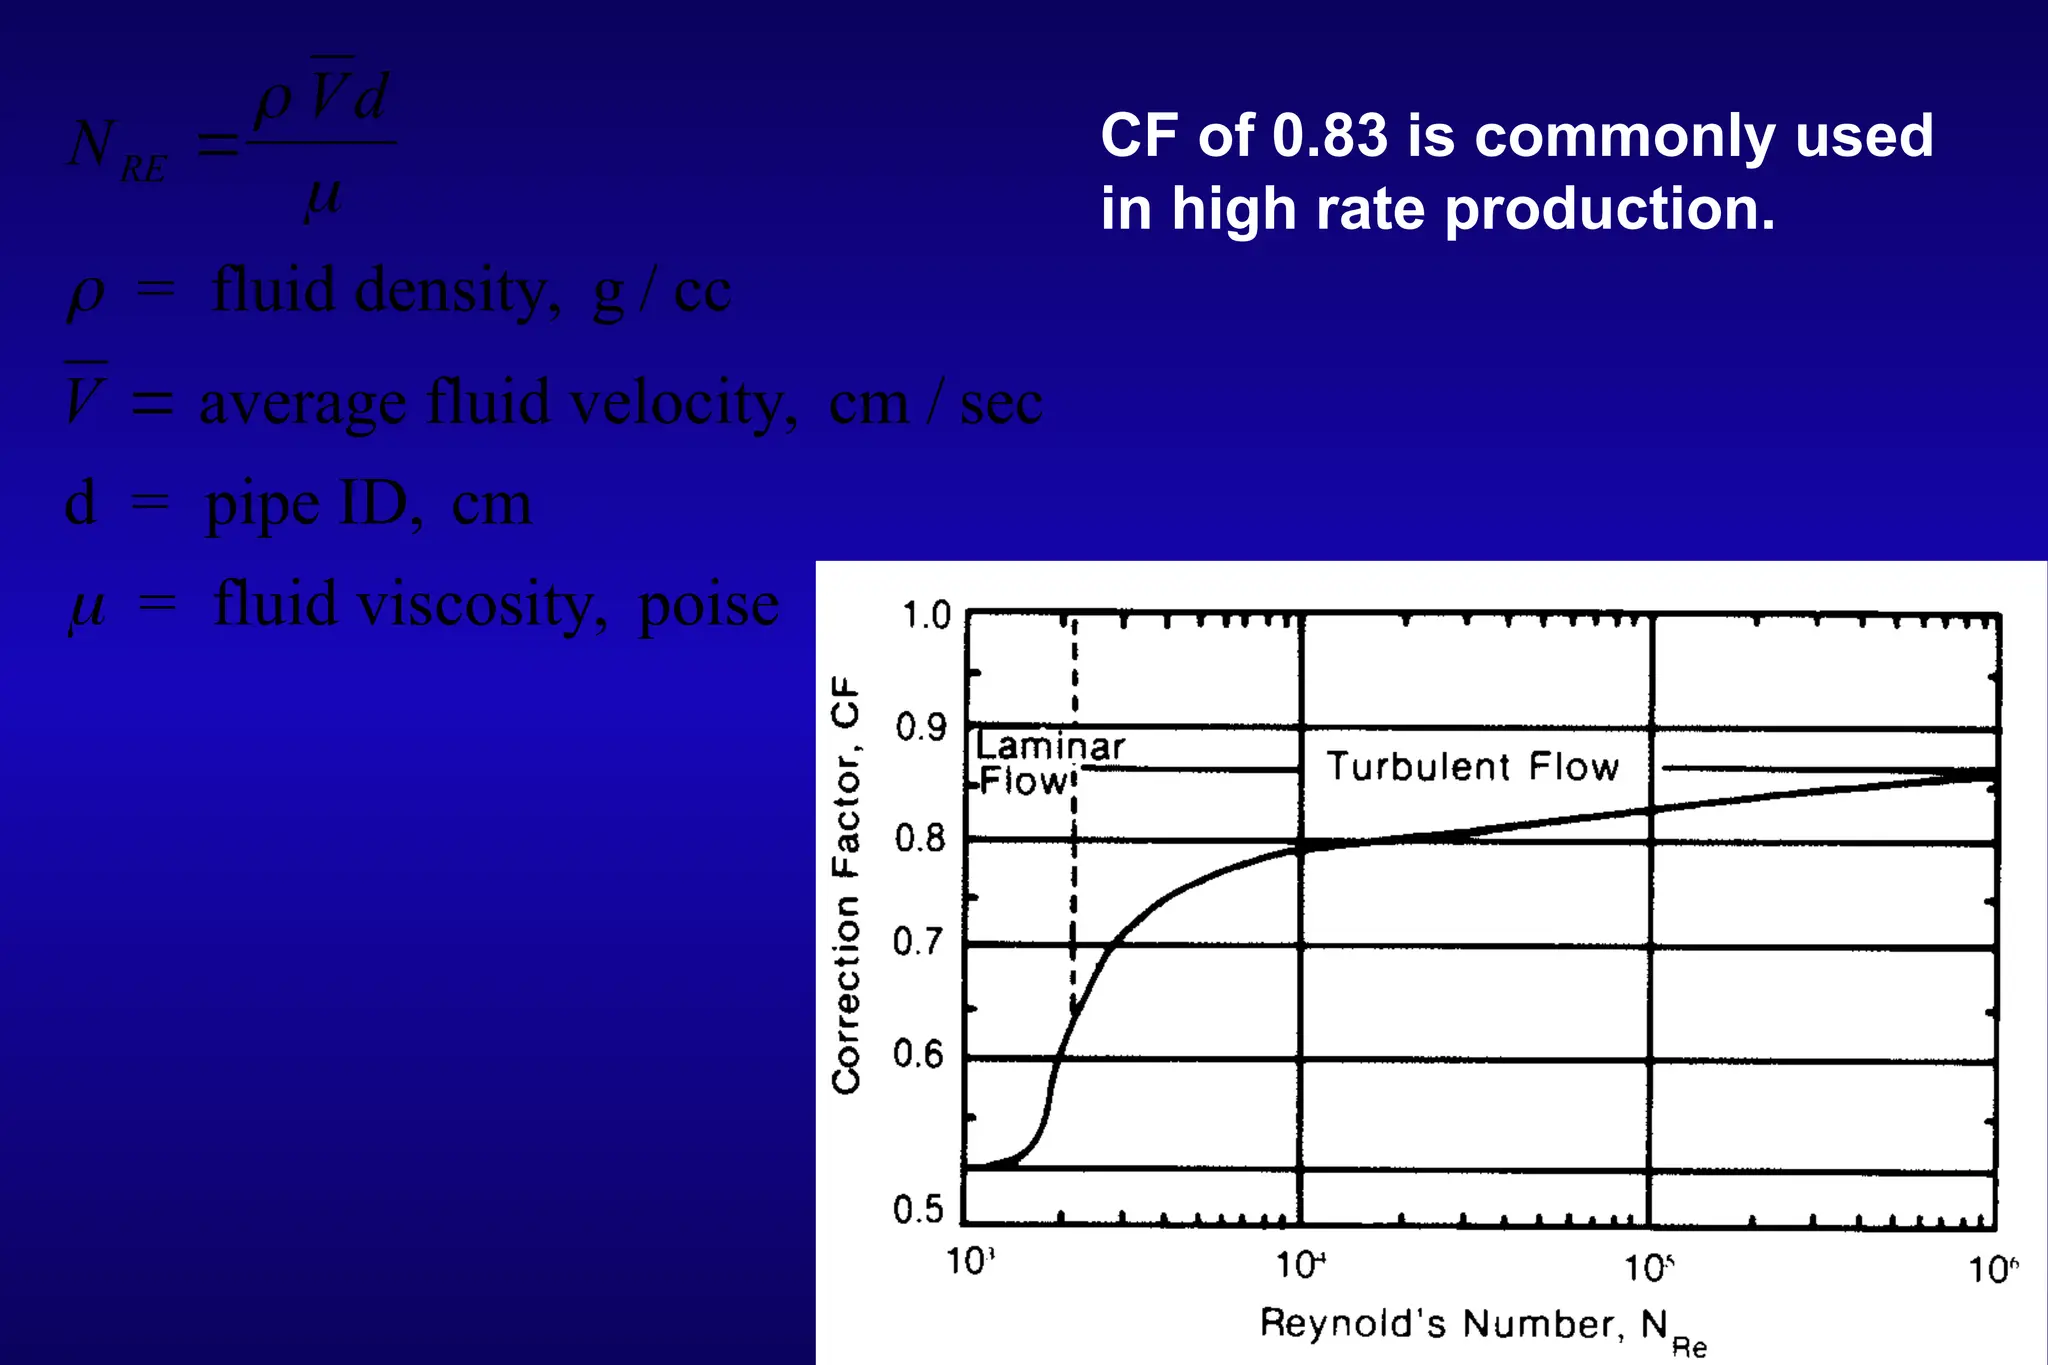
N
Vd
V
RE
= fluiddensity, g / cc
average fluid velocity, cm / sec
d = pipe ID, cm
= fluid viscosity, poise
CF of 0.83 is commonly used
in high rate production.
35
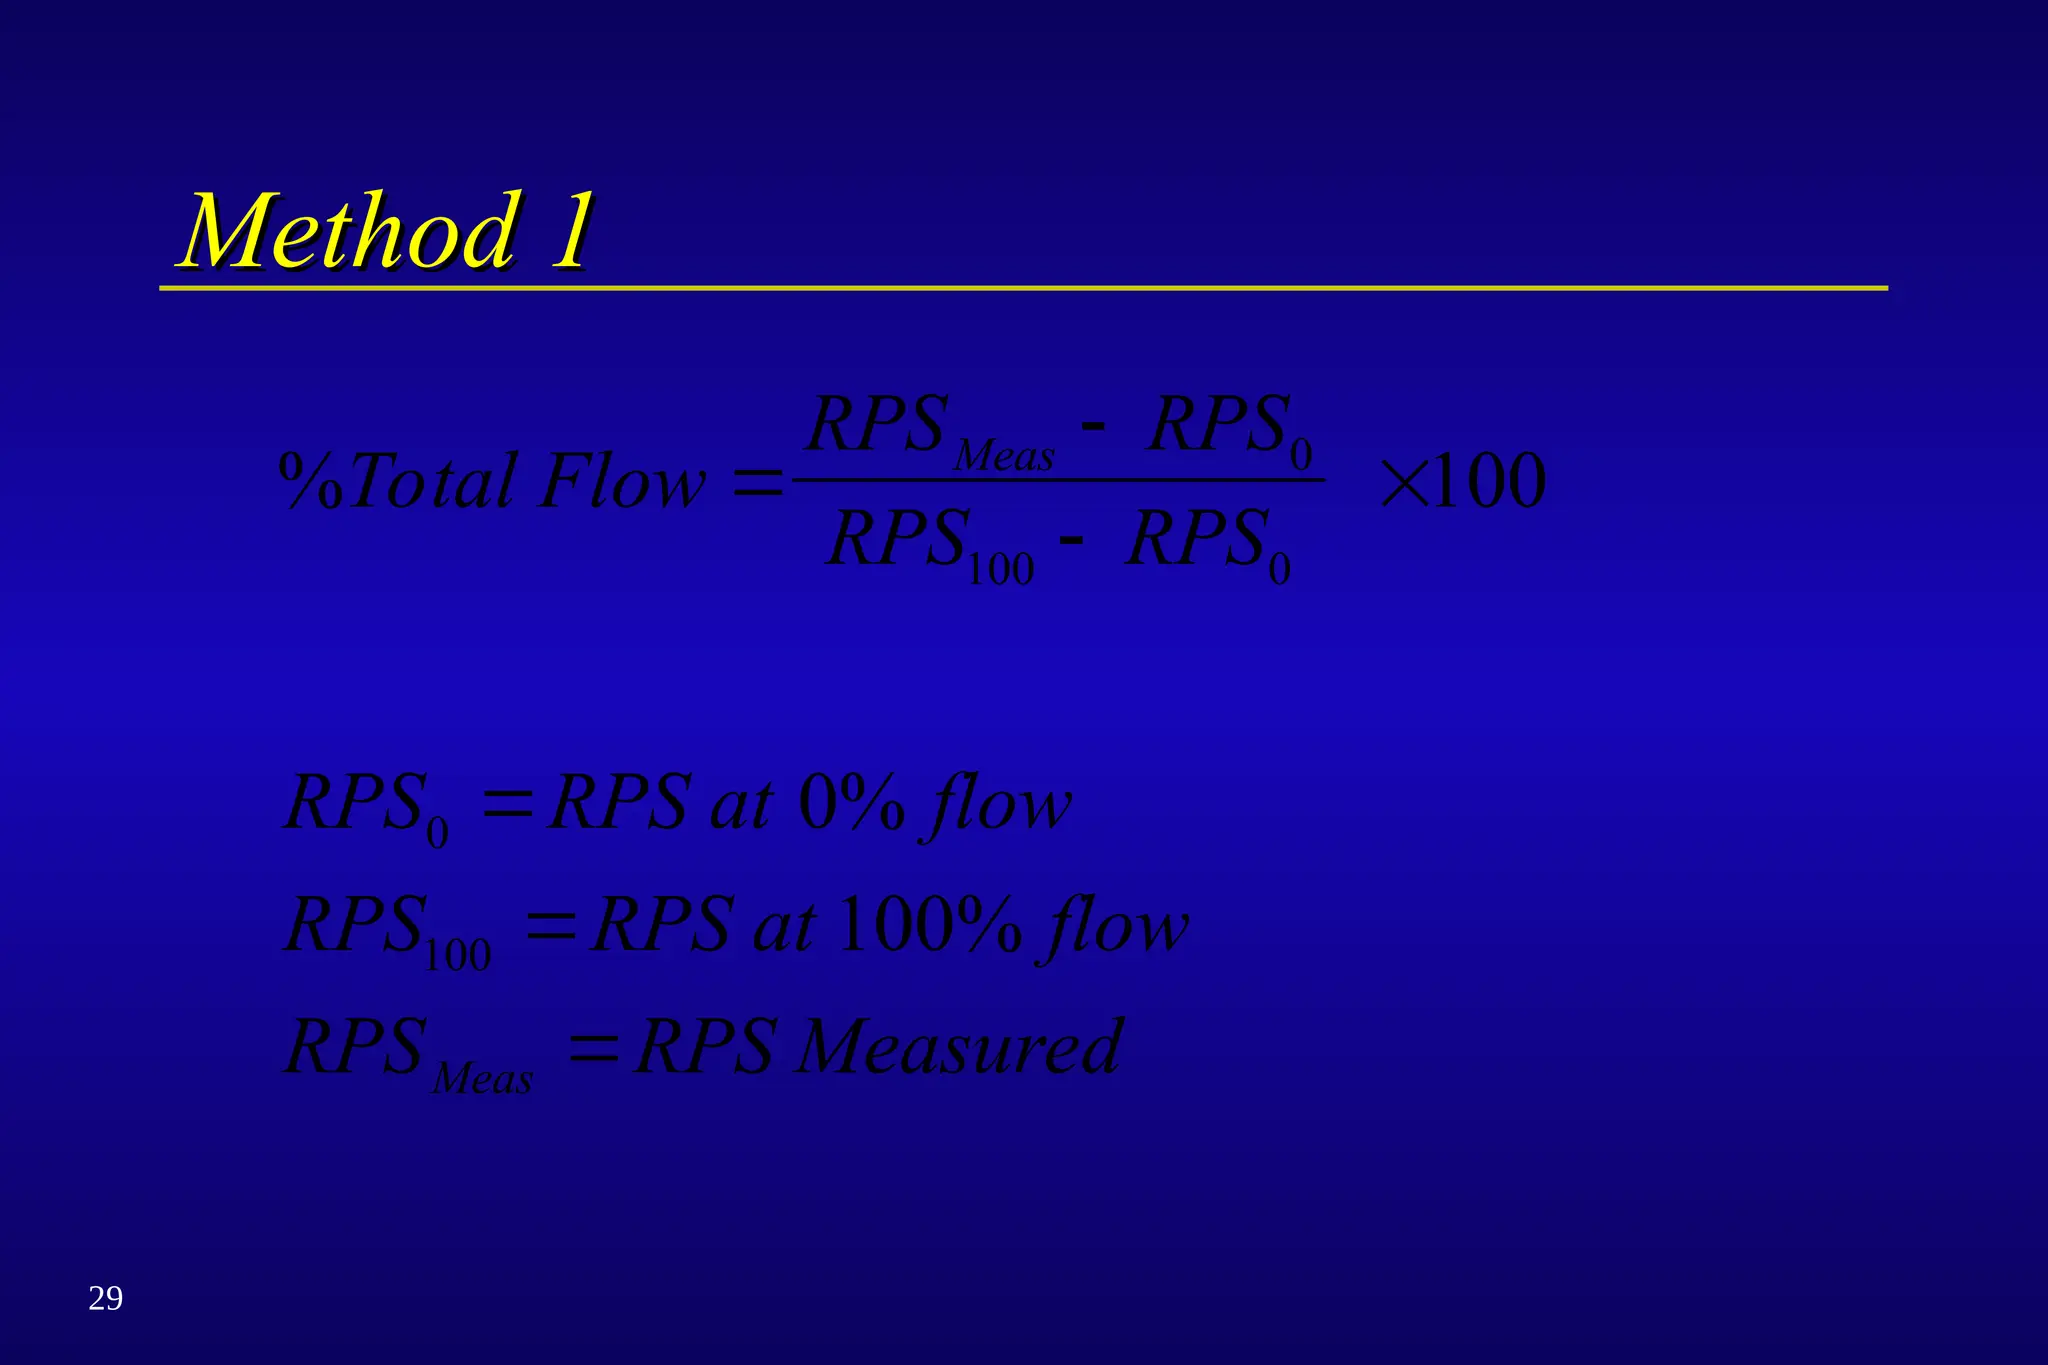
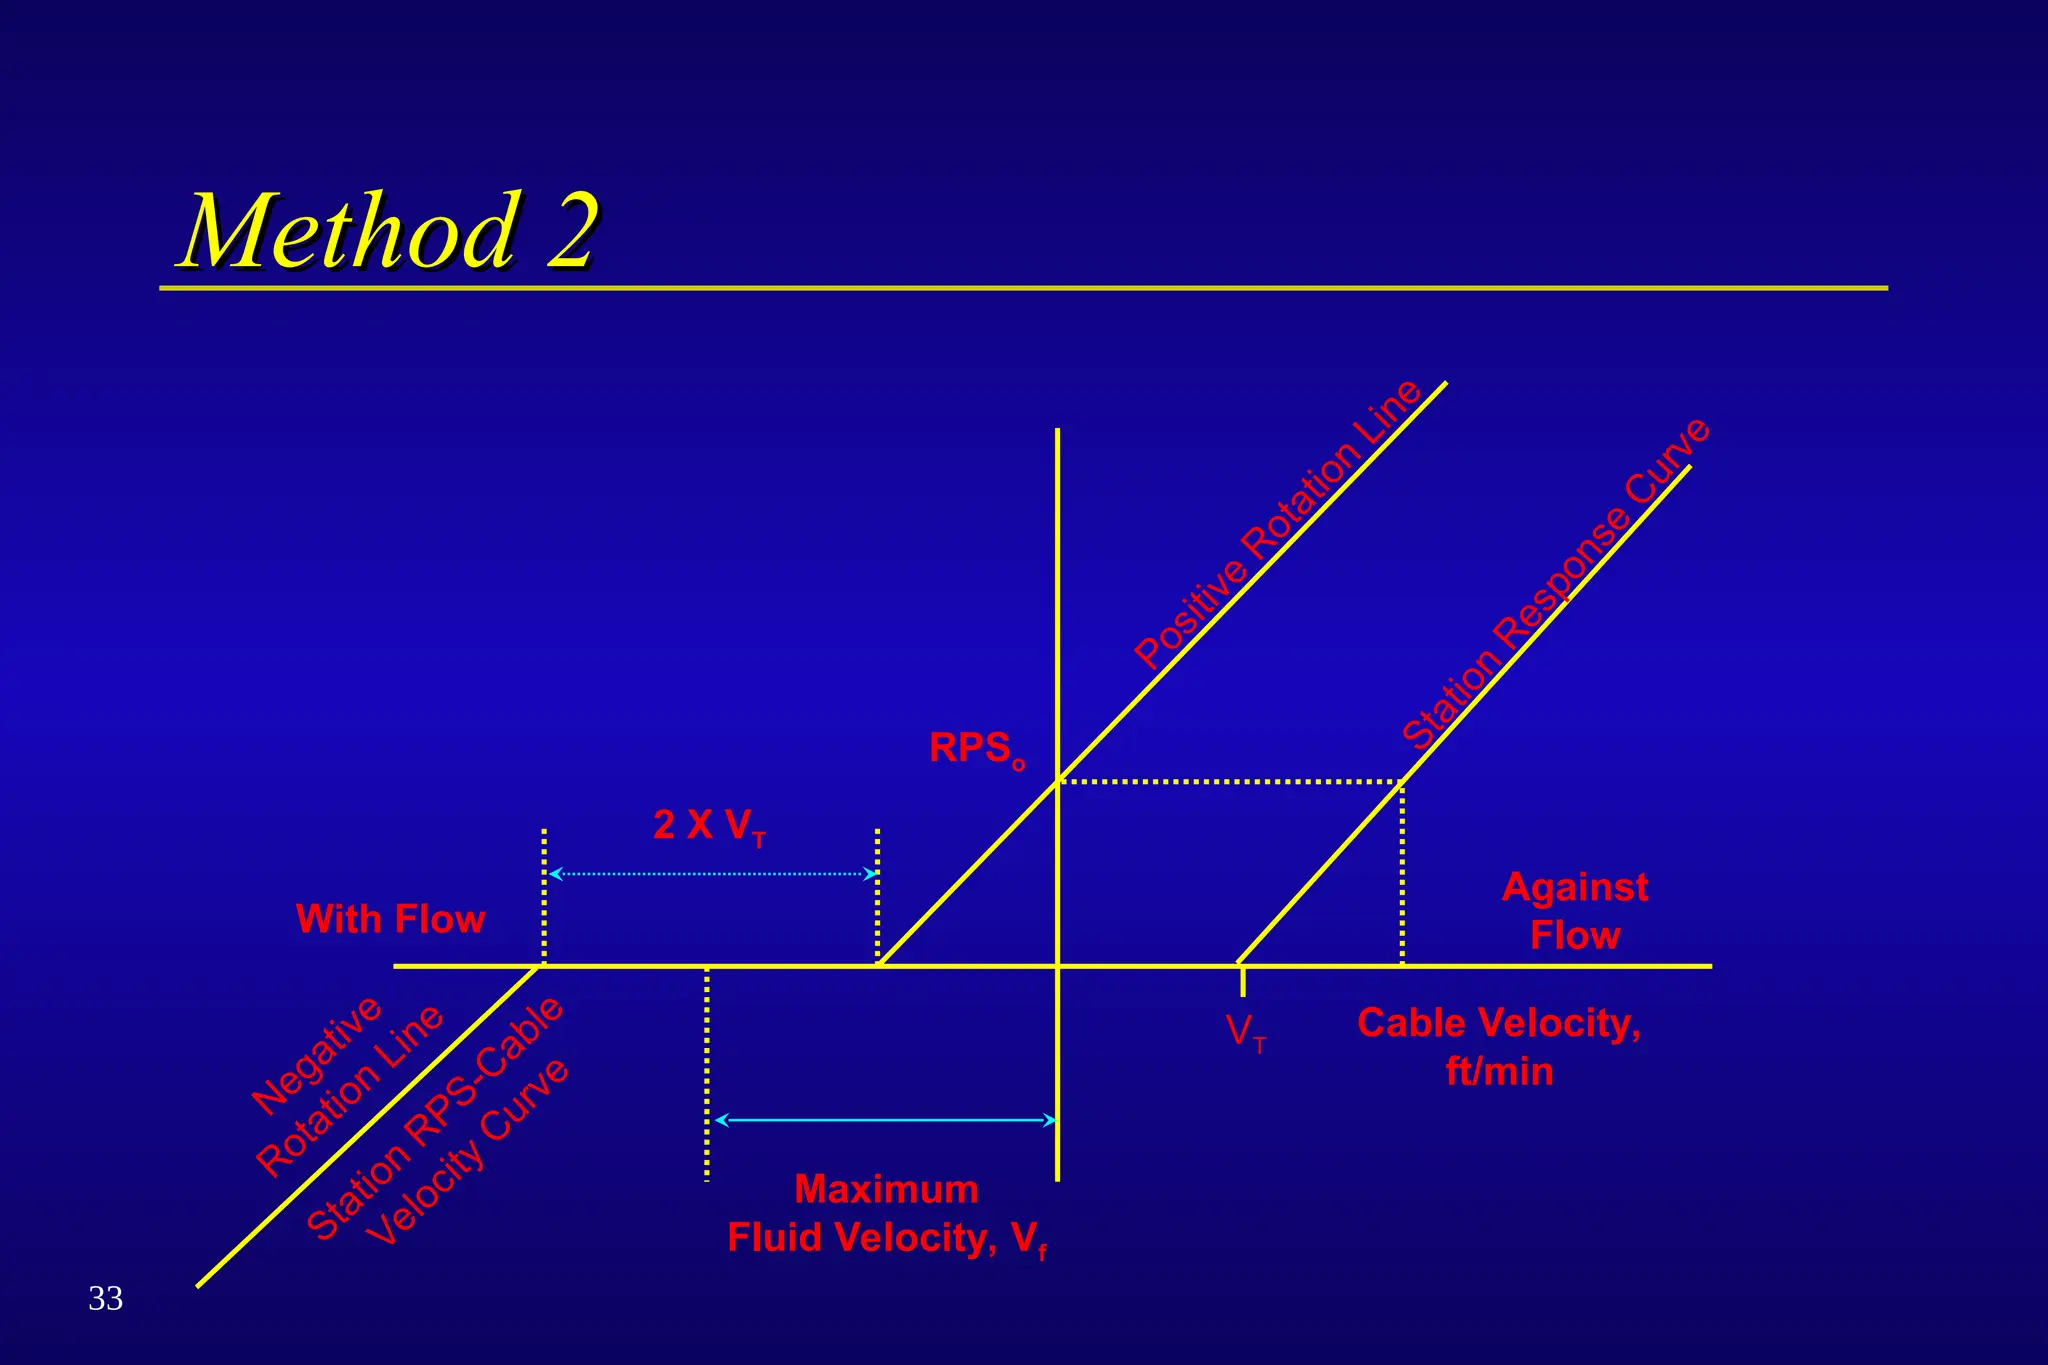
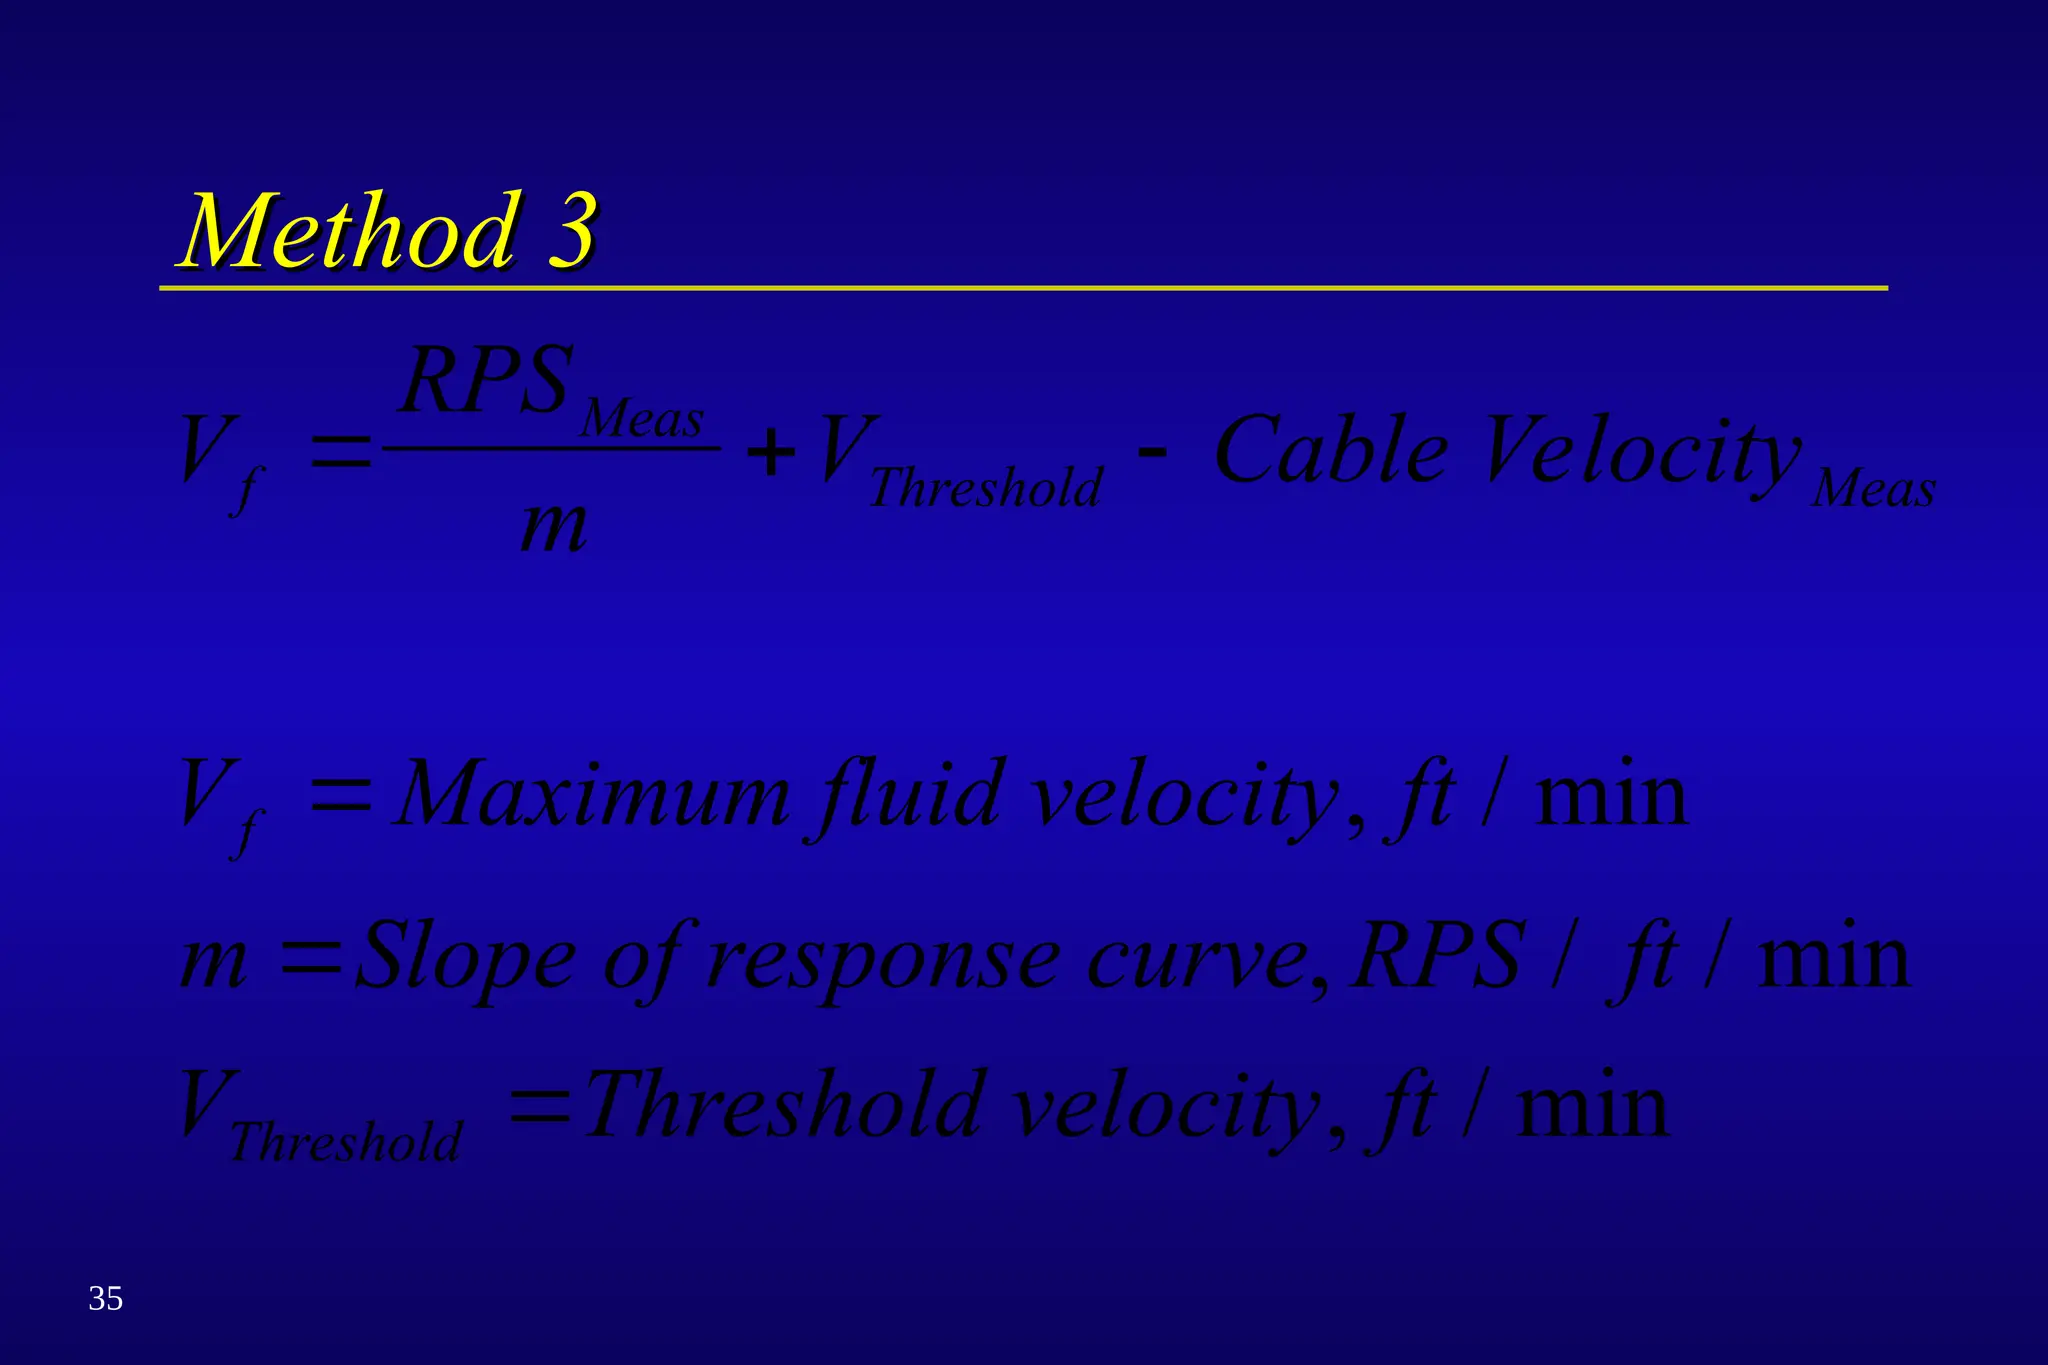
Method 3
Method 3
V
RPS
m
VCable Velocity
V Maximum fluid velocity ft
m Slope of response curve RPS ft
V Threshold velocity ft
f
Meas
Threshold Meas
f
Threshold
, / min
, / / min
, / min
36.
36
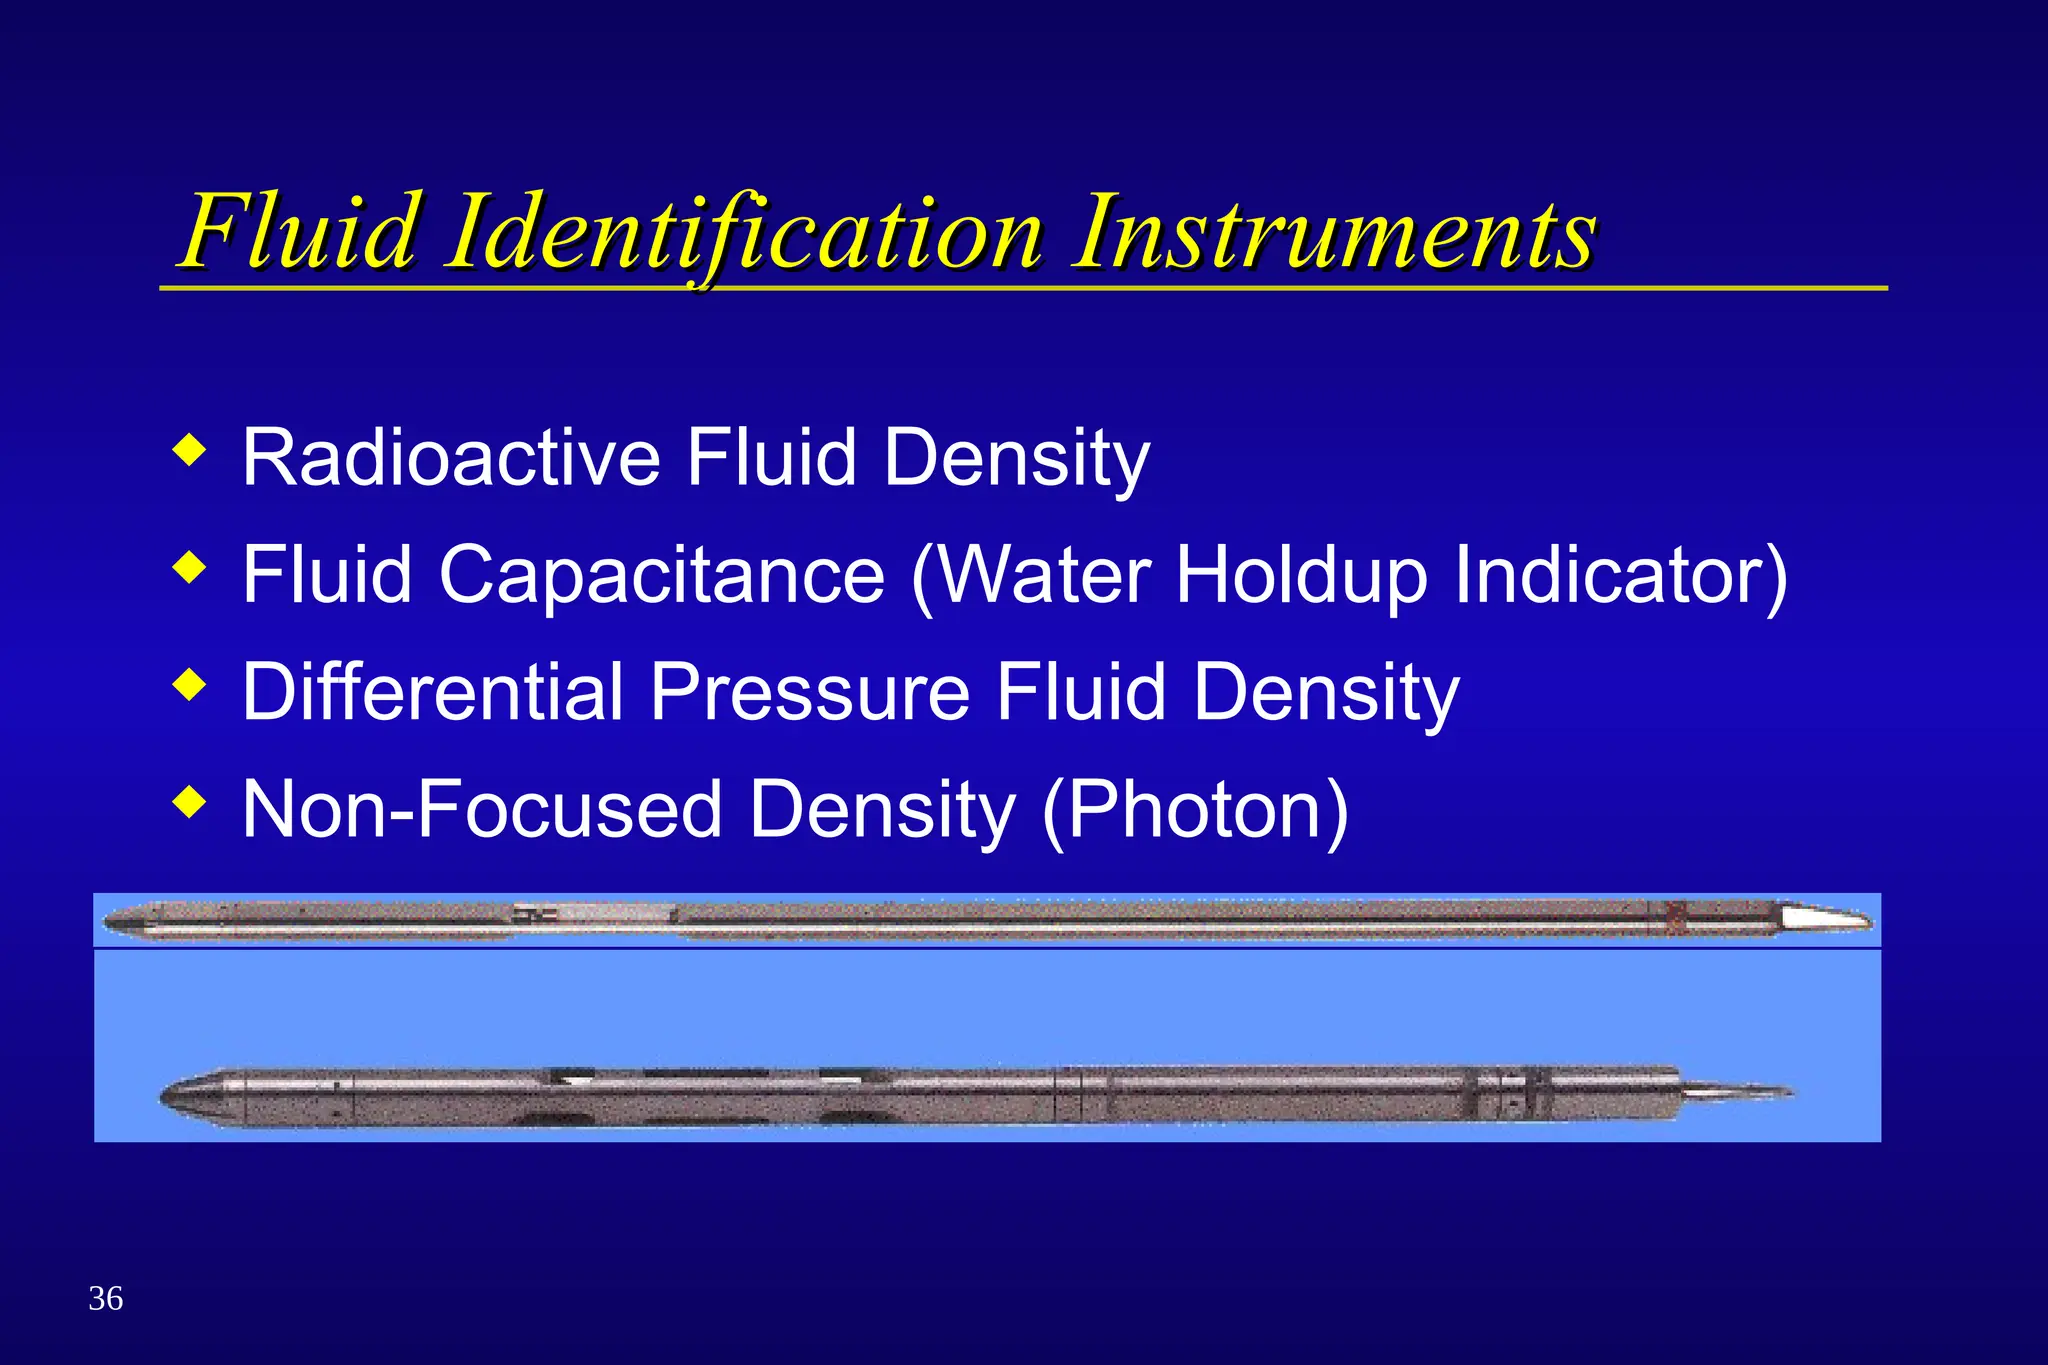
Fluid Identification Instruments
FluidIdentification Instruments
Radioactive Fluid Density
Fluid Capacitance (Water Holdup Indicator)
Differential Pressure Fluid Density
Non-Focused Density (Photon)
37.
37
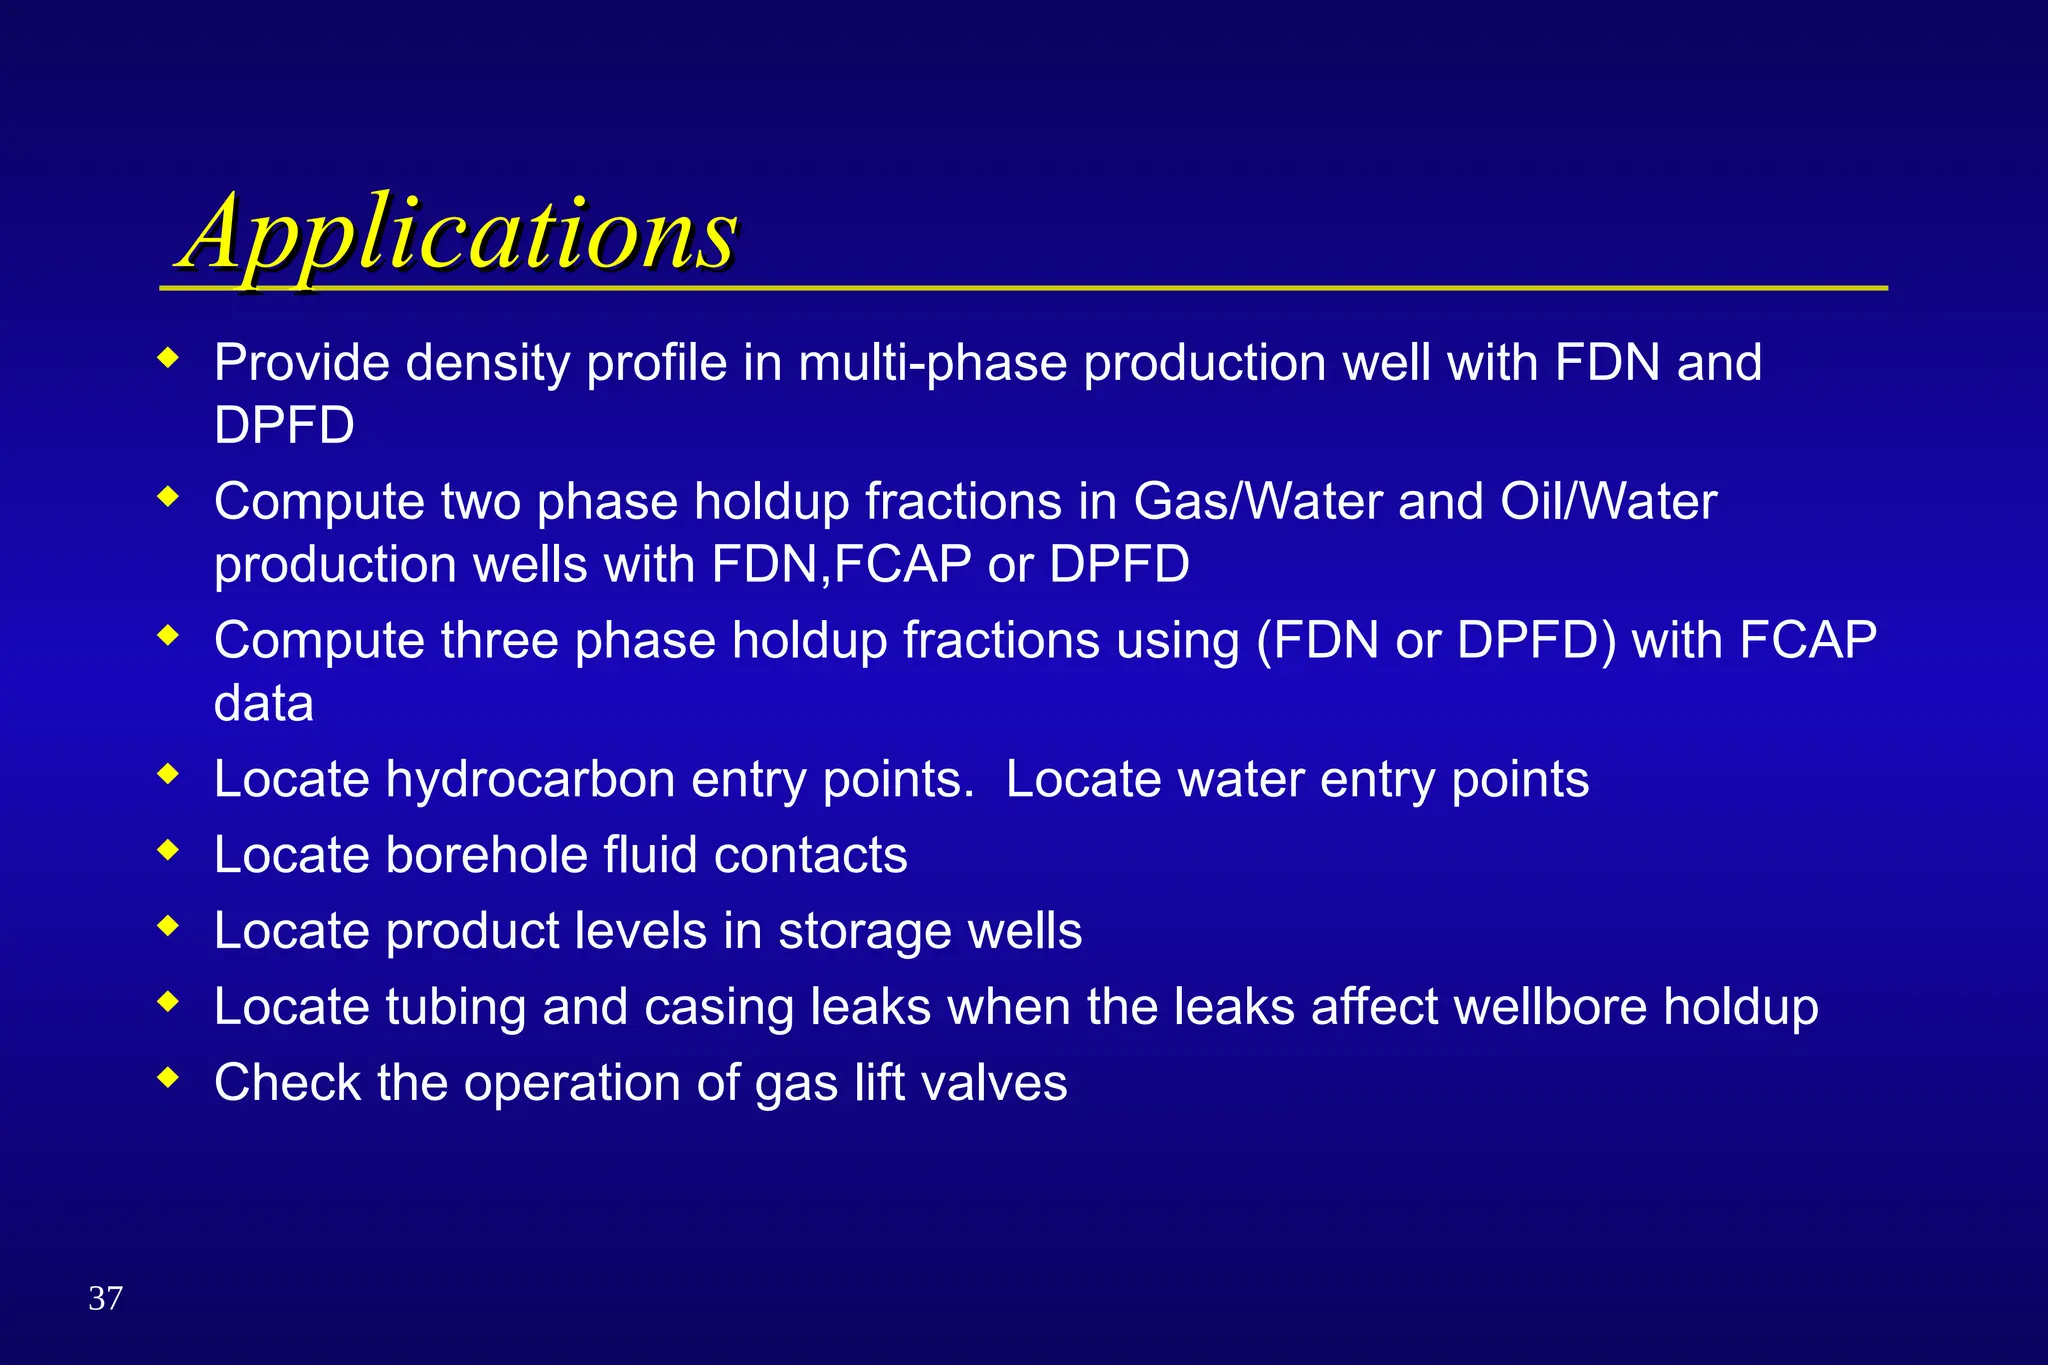
Applications
Applications
Provide densityprofile in multi-phase production well with FDN and
DPFD
Compute two phase holdup fractions in Gas/Water and Oil/Water
production wells with FDN,FCAP or DPFD
Compute three phase holdup fractions using (FDN or DPFD) with FCAP
data
Locate hydrocarbon entry points. Locate water entry points
Locate borehole fluid contacts
Locate product levels in storage wells
Locate tubing and casing leaks when the leaks affect wellbore holdup
Check the operation of gas lift valves
38.
38
Advantages
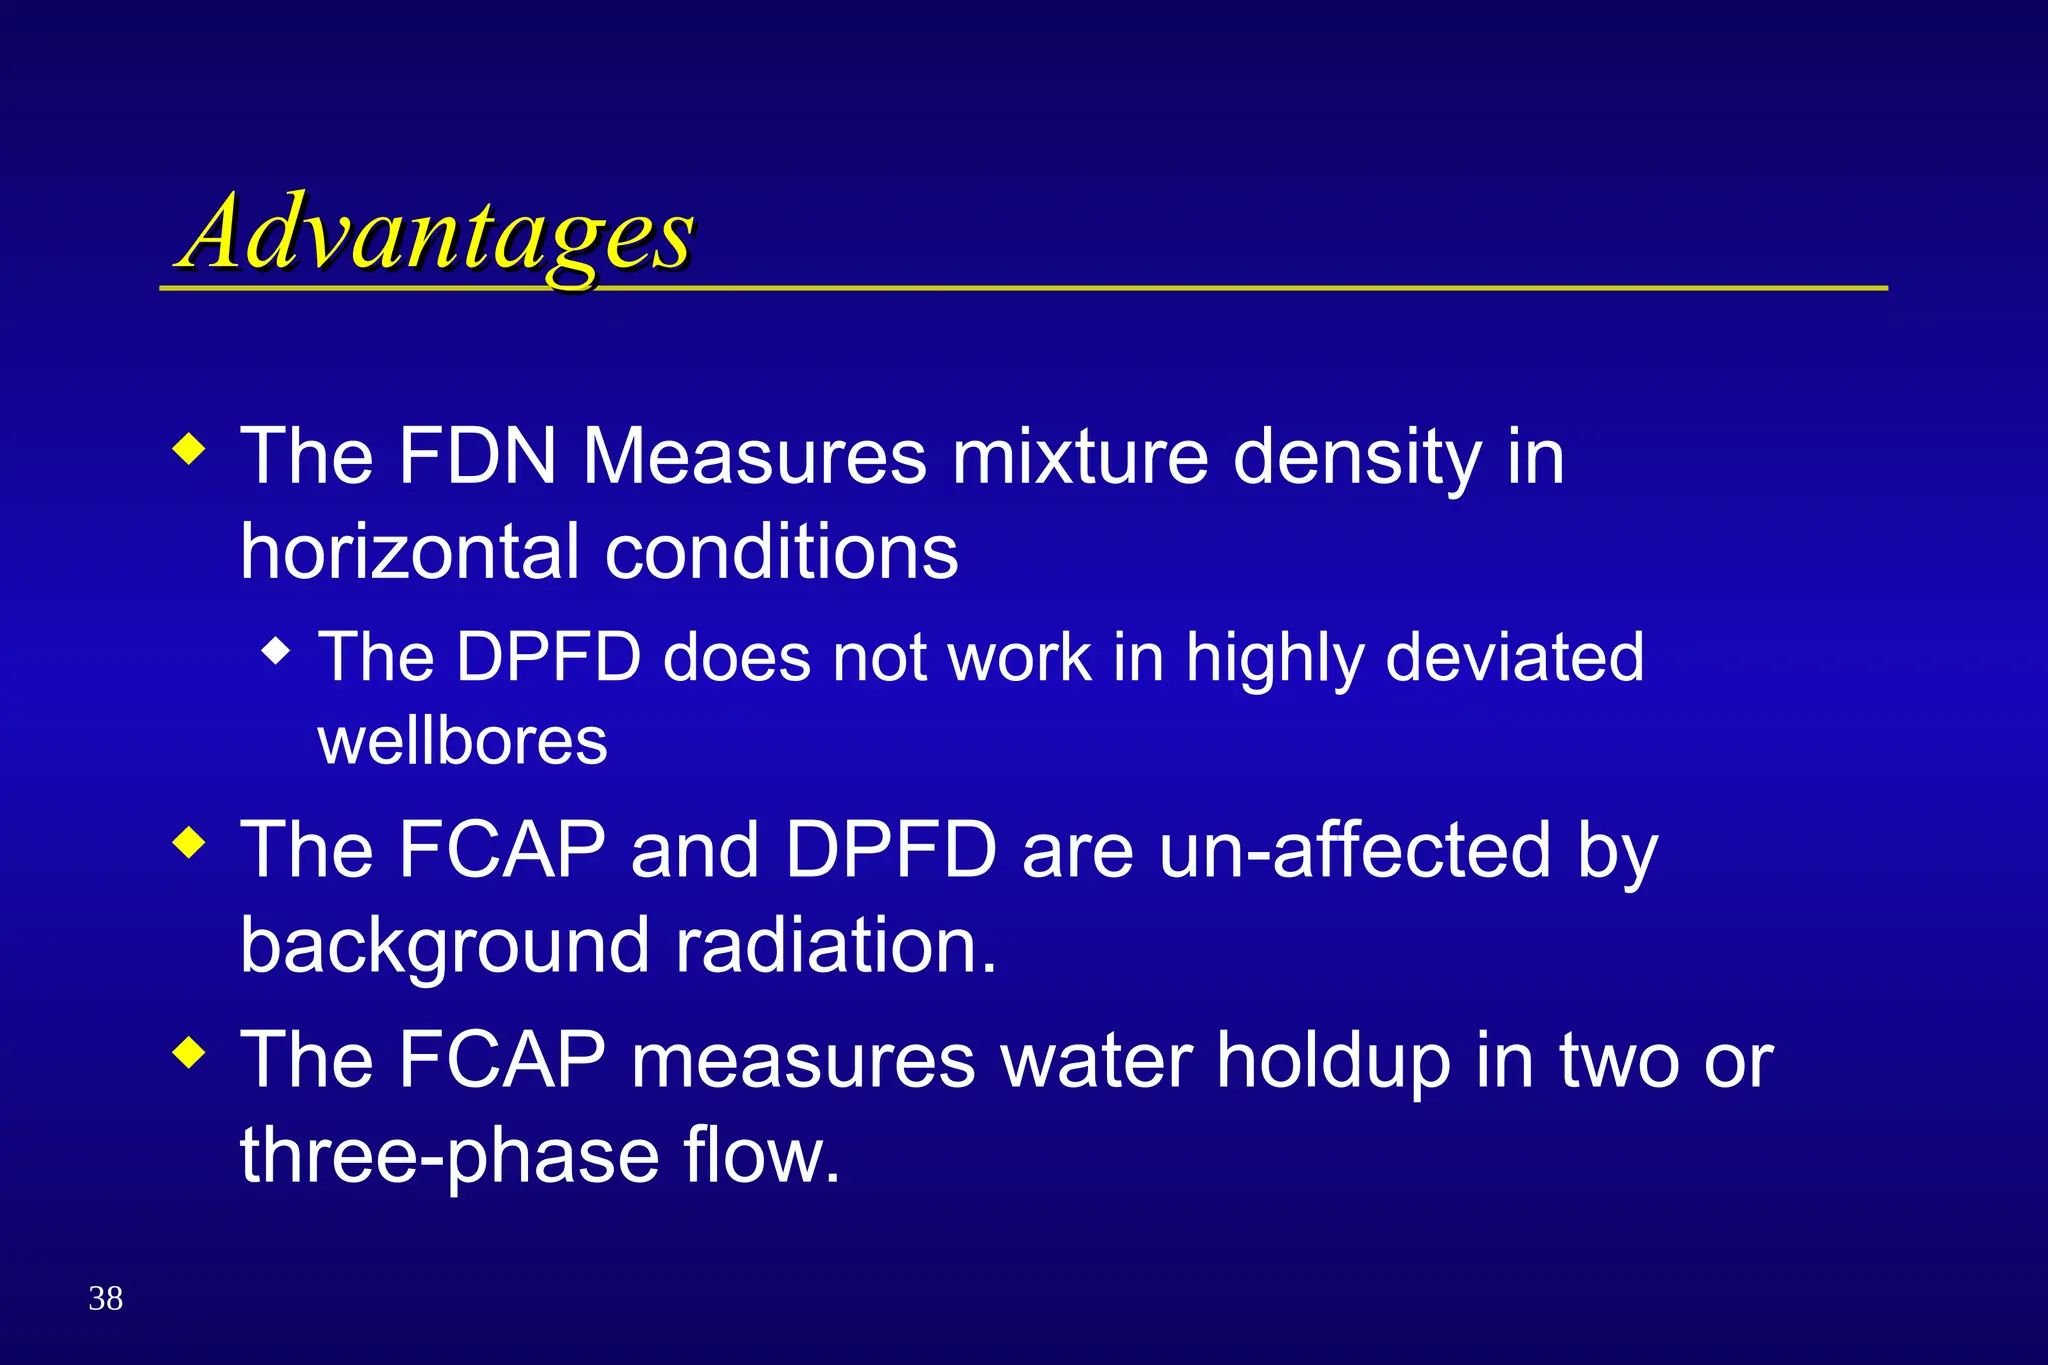
Advantages
The FDNMeasures mixture density in
horizontal conditions
The DPFD does not work in highly deviated
wellbores
The FCAP and DPFD are un-affected by
background radiation.
The FCAP measures water holdup in two or
three-phase flow.
39.
39
Measurement Principles --FDN
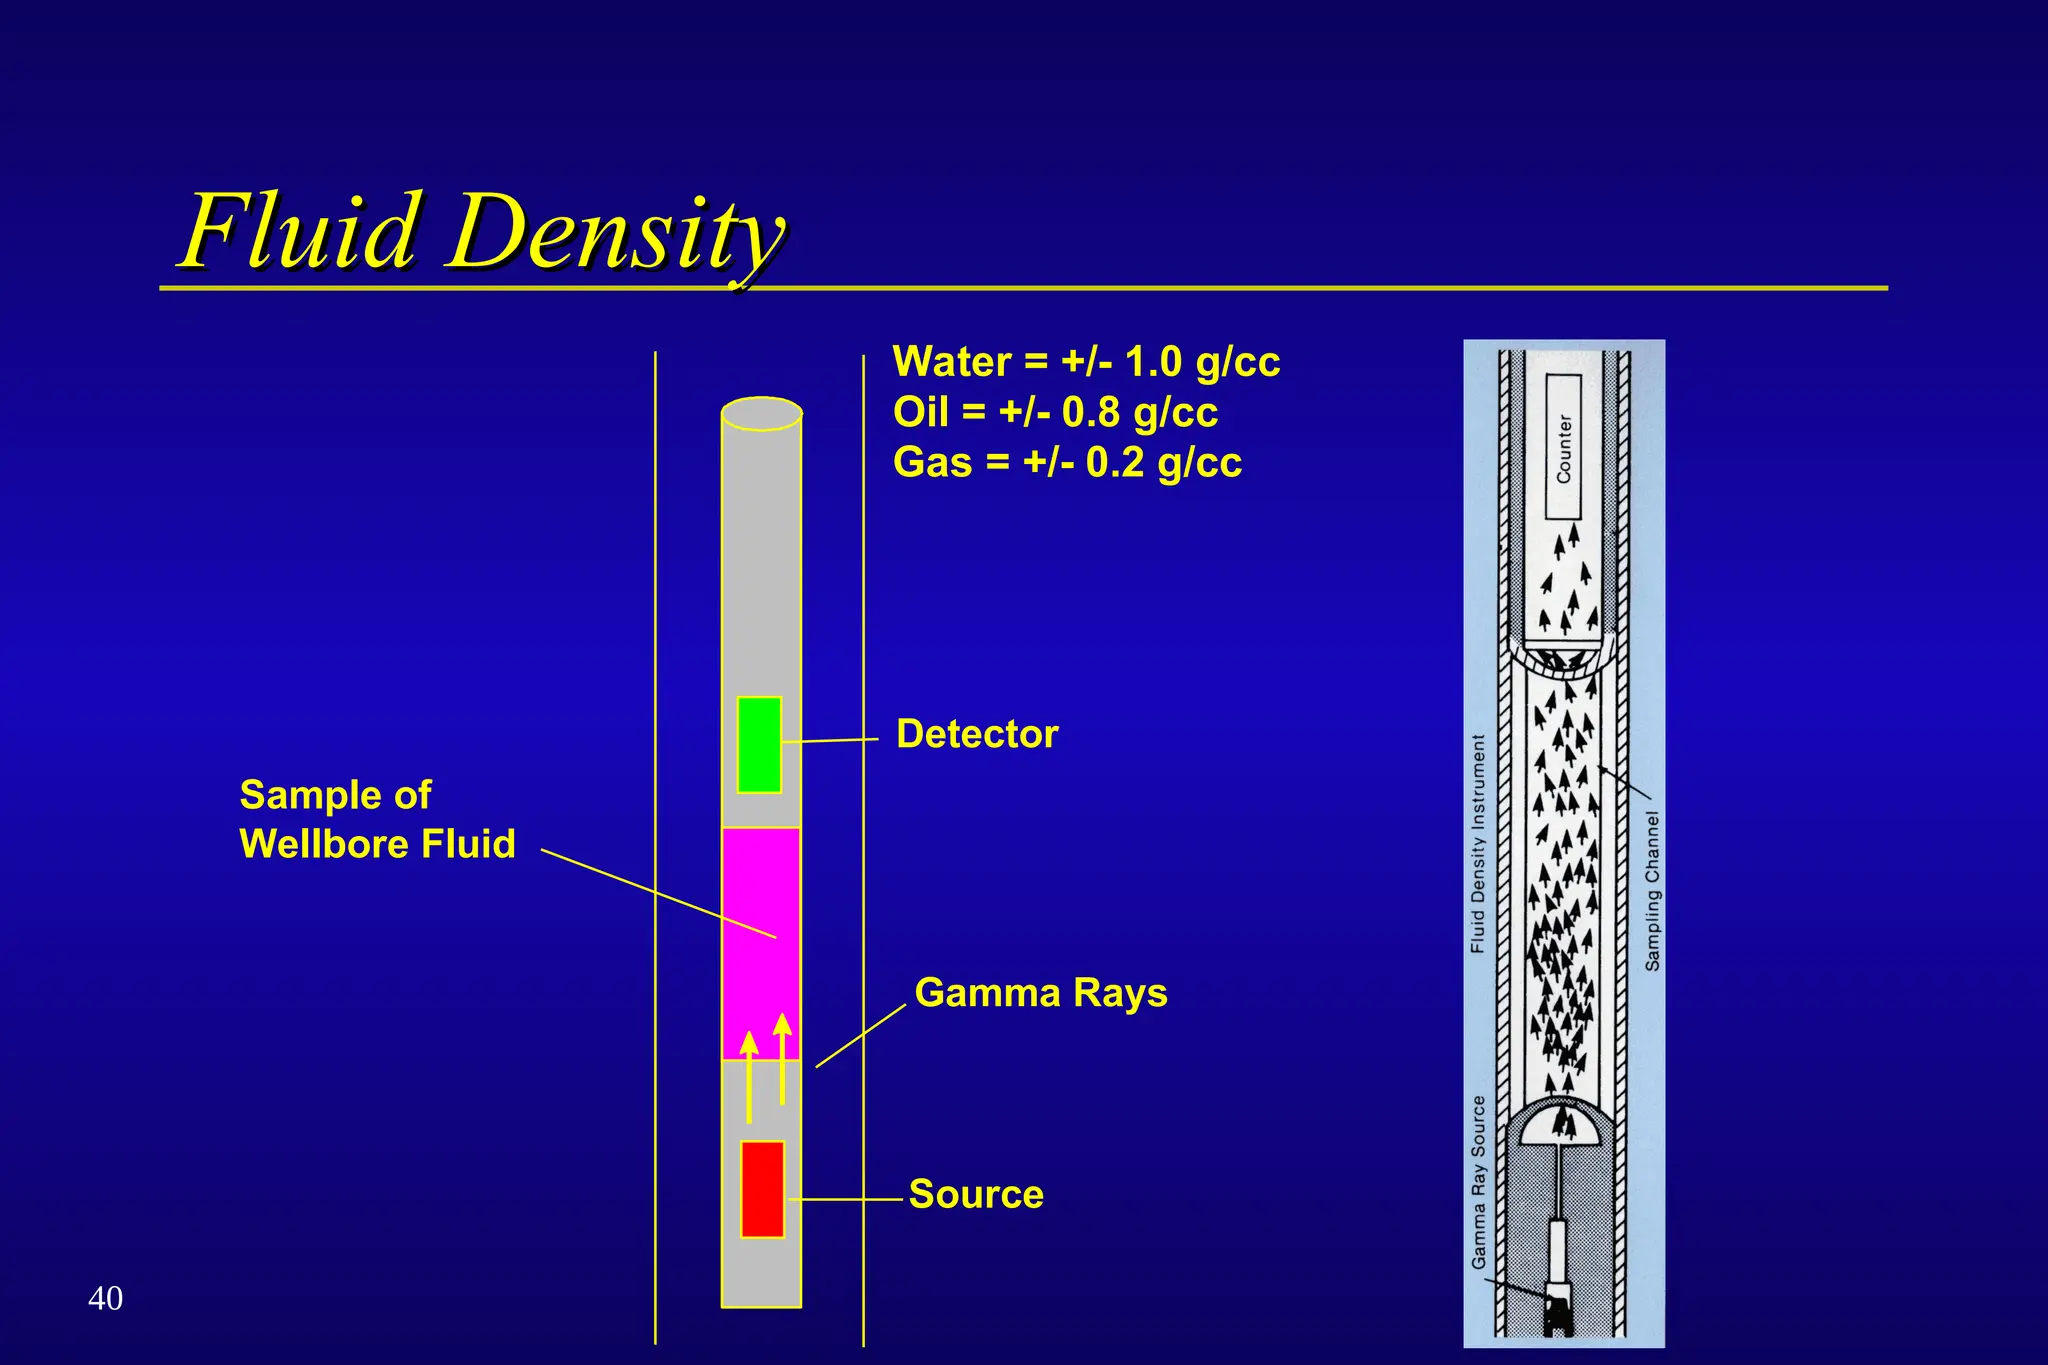
Measurement Principles -- FDN
The Fluid Density instrument incorporates a
collimated Gamma Ray source and Gamma Ray
Detector separated by a window in the instrument
that is open to the wellbore fluids. The Gamma Rays
must travel through the wellbore fluids. The number
of Gamma Rays detected, counts per second (CPS),
are inversely related to the Density of the wellbore
Fluids. The relationship is accurately established by
calibrating in air and water.
43
Measurement Principles --FCAP
Measurement Principles -- FCAP
The Fluid Capacitance functions as a variable
capacitor. It is constructed with two surfaces acting
as the plates of the capacitor with the wellbore fluid
between these surfaces. The capacitance is
related to the dielectric constant of the fluid
between its’ plates. The capacitance influences the
output frequency of a pulse generator. Therefore
the measured pulse frequency is related to the
dielectric constant of the fluids.
45
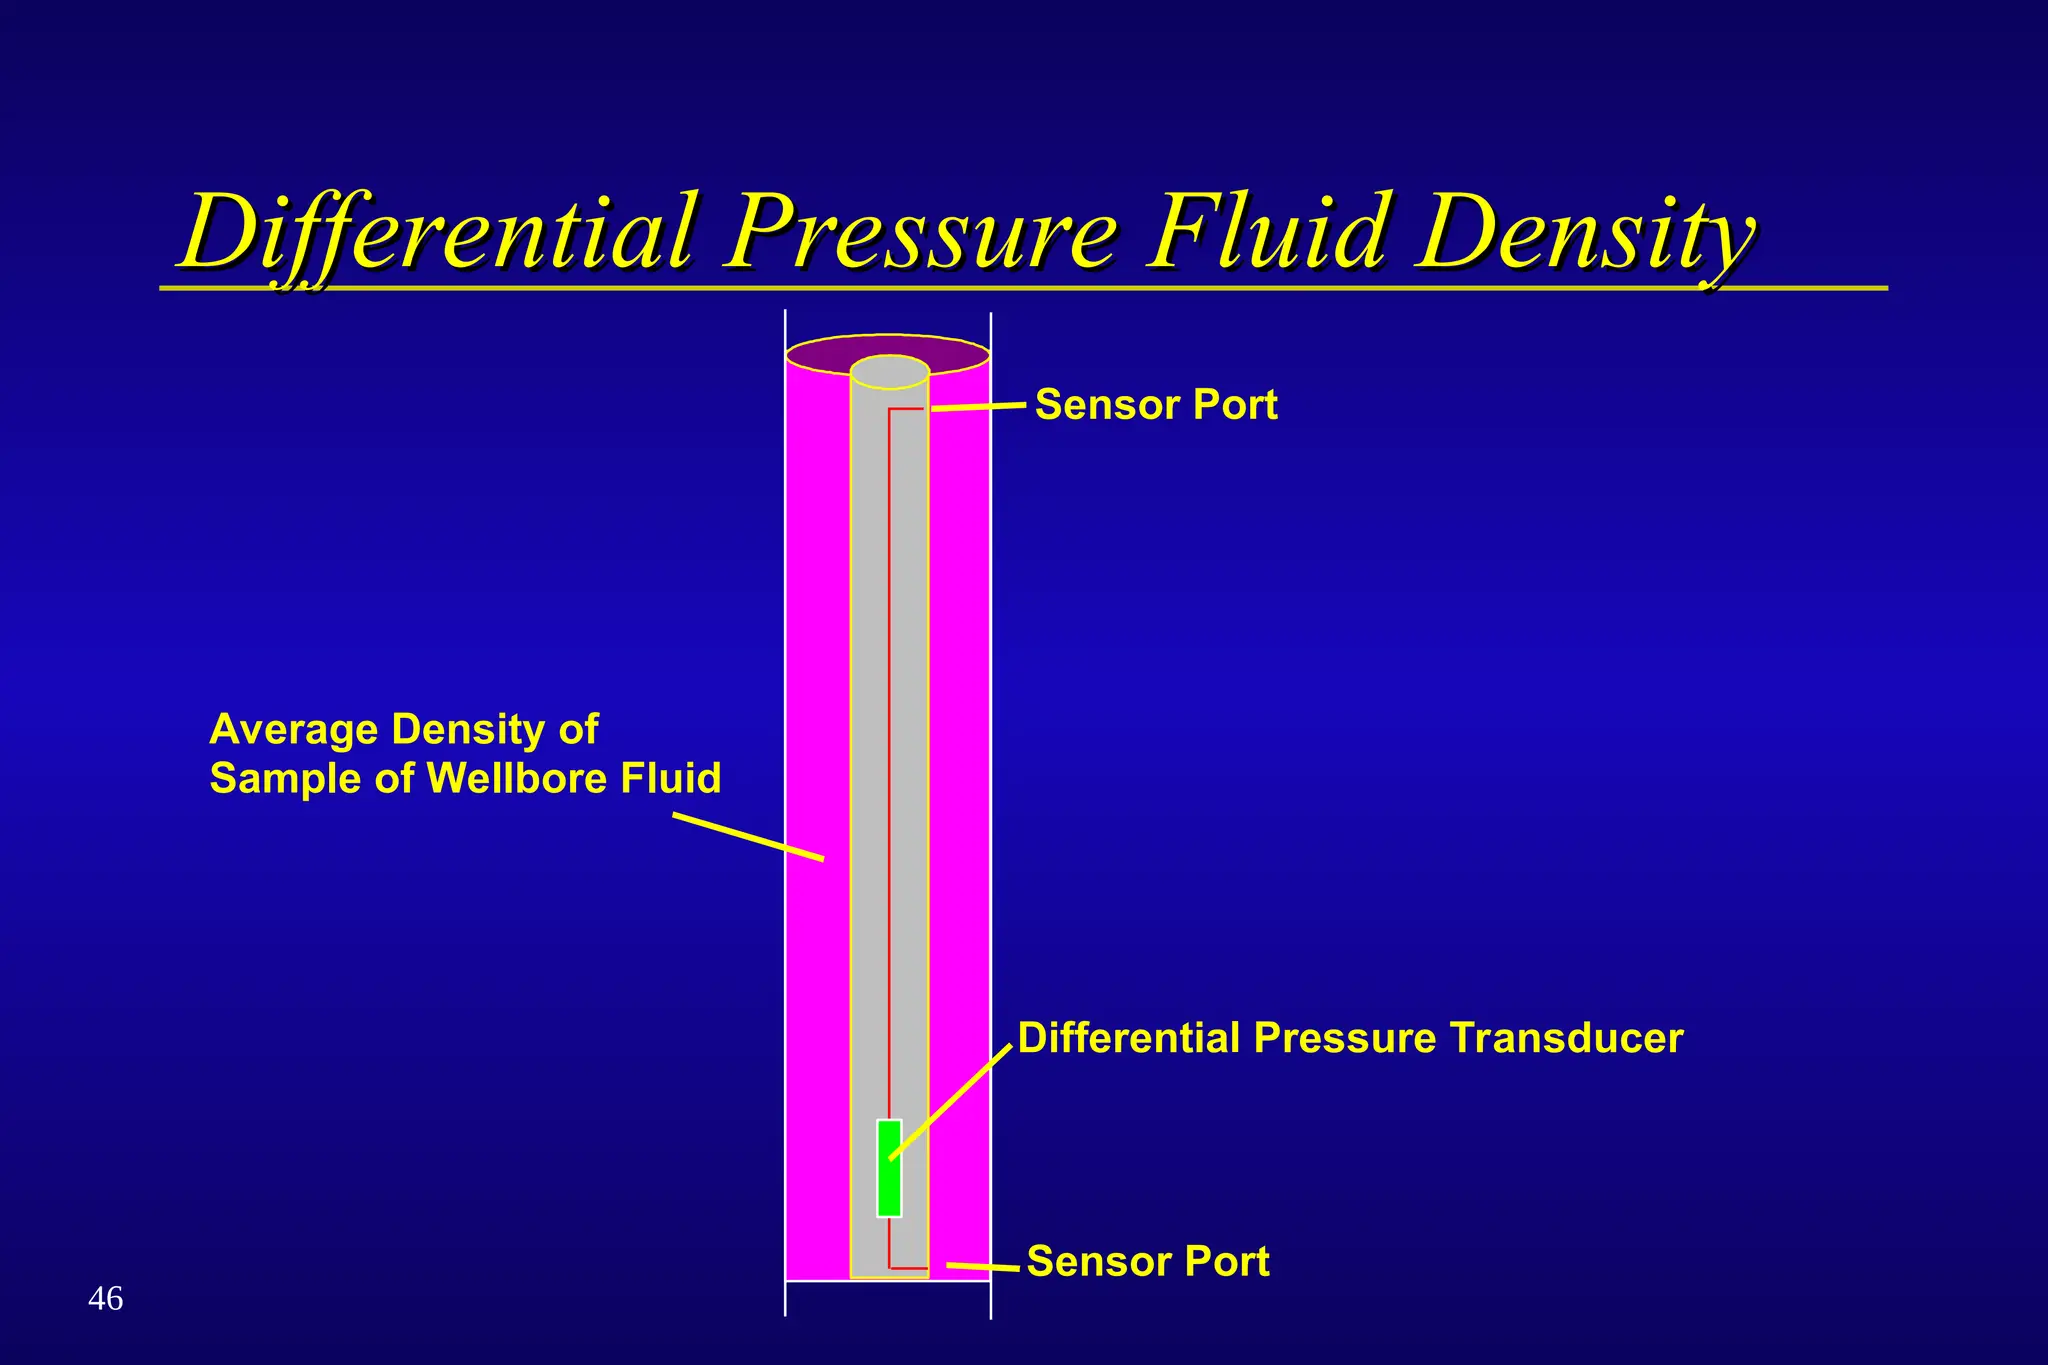
Measurement Principles --DPFD
Measurement Principles -- DPFD
The Differential Pressure Fluid Density
measures the wellbore pressure at two points
a fixed distance apart. The difference in the
measured pressures is a function of the
wellbore fluid density and the True Vertical
Distance between the sensors.
46.
46
Differential Pressure FluidDensity
Differential Pressure Fluid Density
Sensor Port
Differential Pressure Transducer
Sensor Port
Average Density of
Sample of Wellbore Fluid
47.
47
Measurement Principles --NFD
Measurement Principles -- NFD
The Non-Focused Density is similar to the
Fluid Density. It utilizes a Gamma Ray
source that radiates outside the body of the
instrument. The measured countrate is
influence by surrounding borehole fluid
density, hardware and possibly formation.
The interpretation must consider hardware
and formation effects.
48.
48
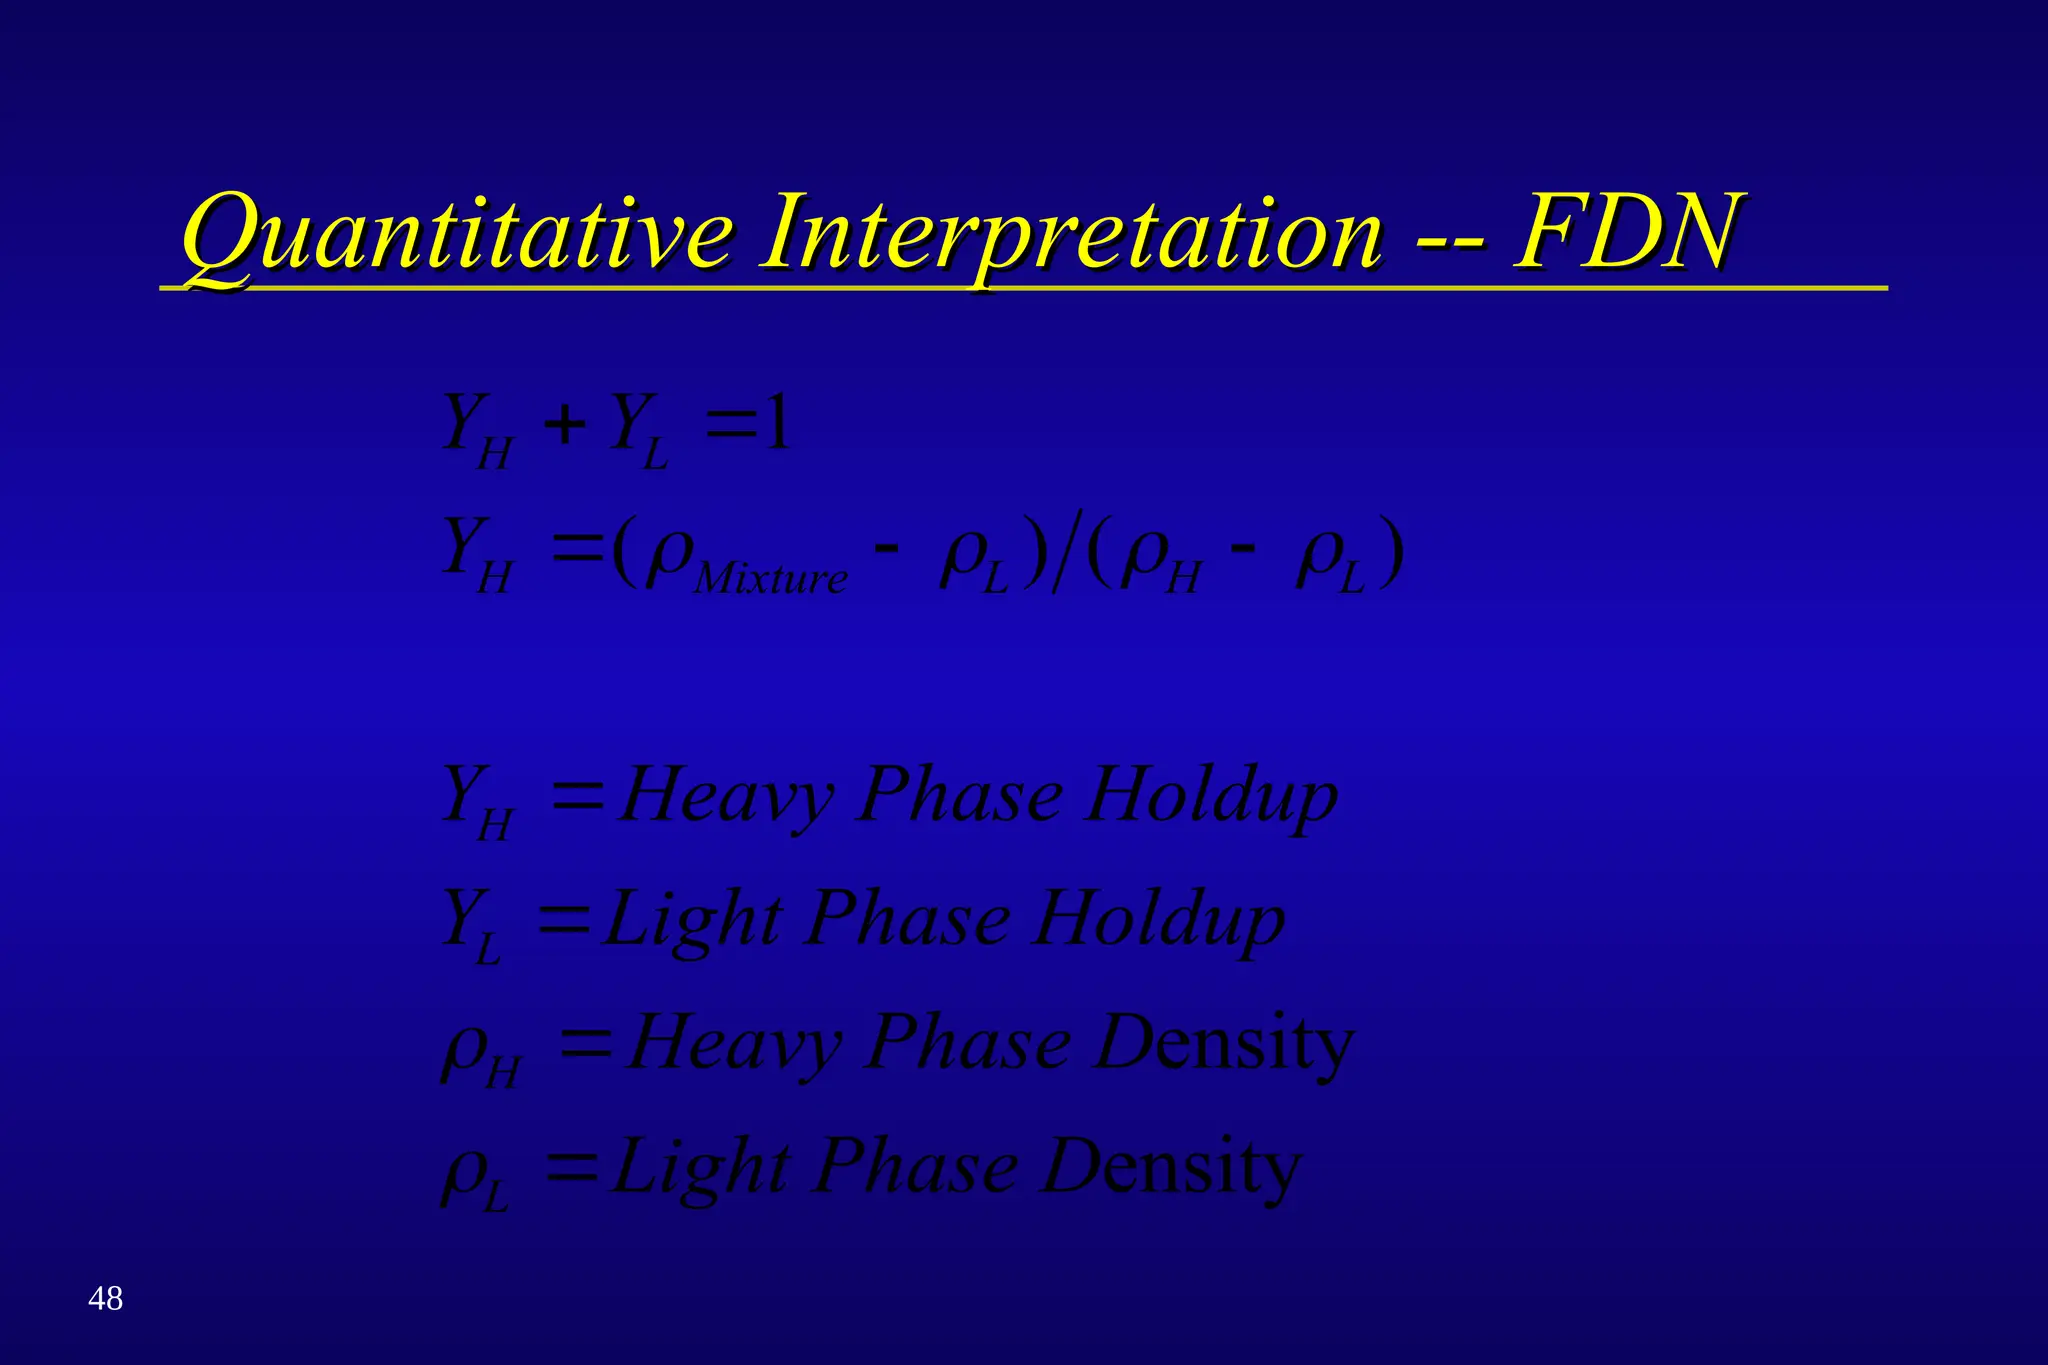
Quantitative Interpretation --FDN
Quantitative Interpretation -- FDN
Y Y
Y
Y Heavy Phase Holdup
Y Light Phase Holdup
Heavy Phase D
Light Phase D
H L
H Mixture L H L
H
L
H
L
1
( ) ( )
ensity
ensity
49.
49
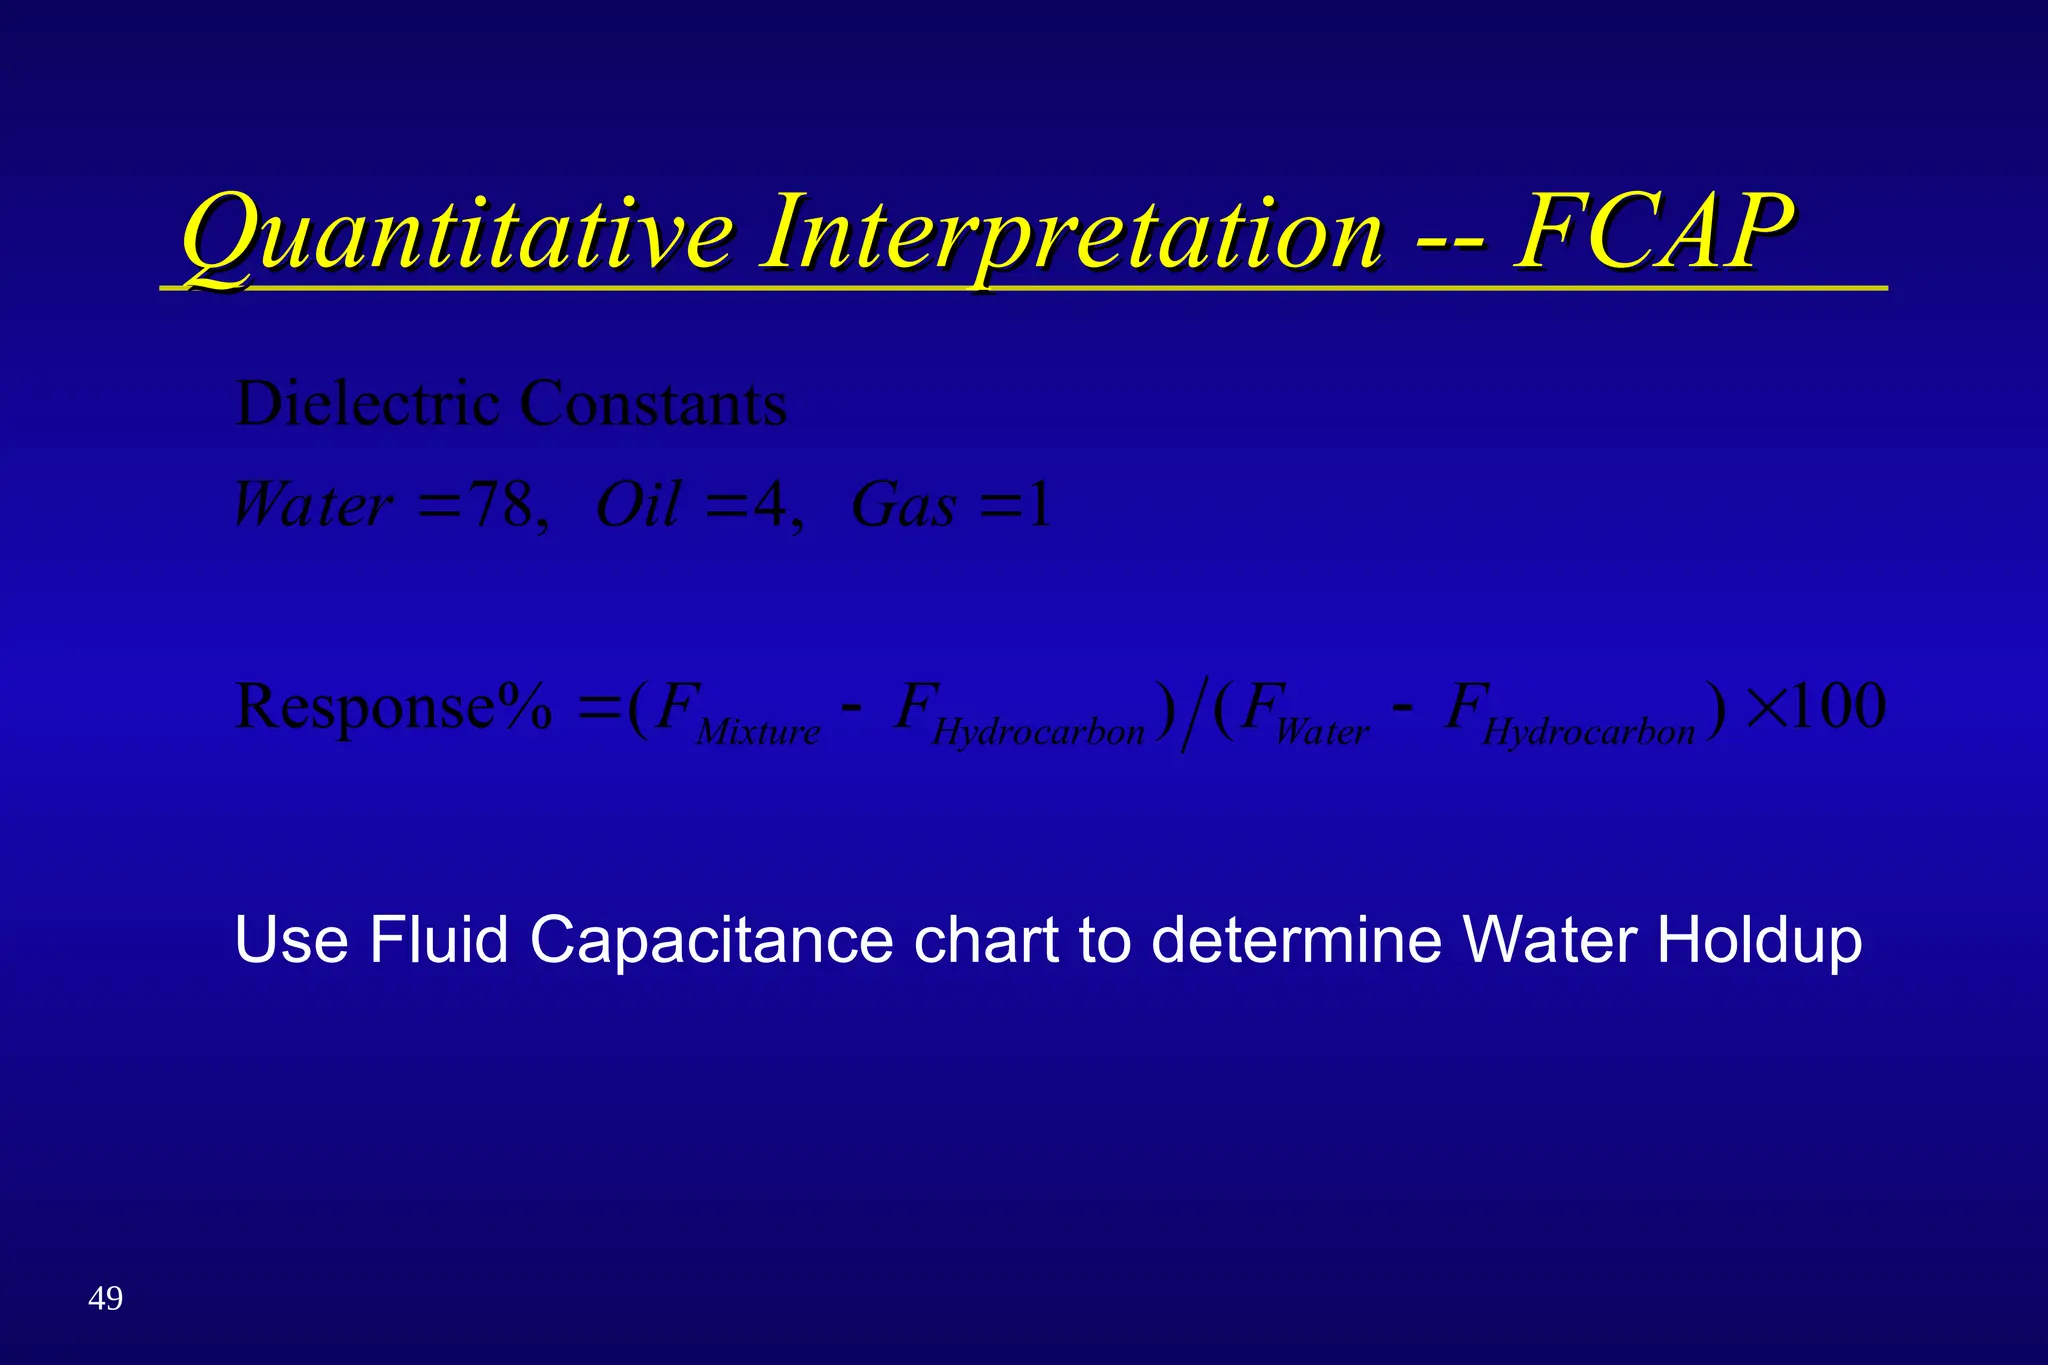
Quantitative Interpretation --FCAP
Quantitative Interpretation -- FCAP
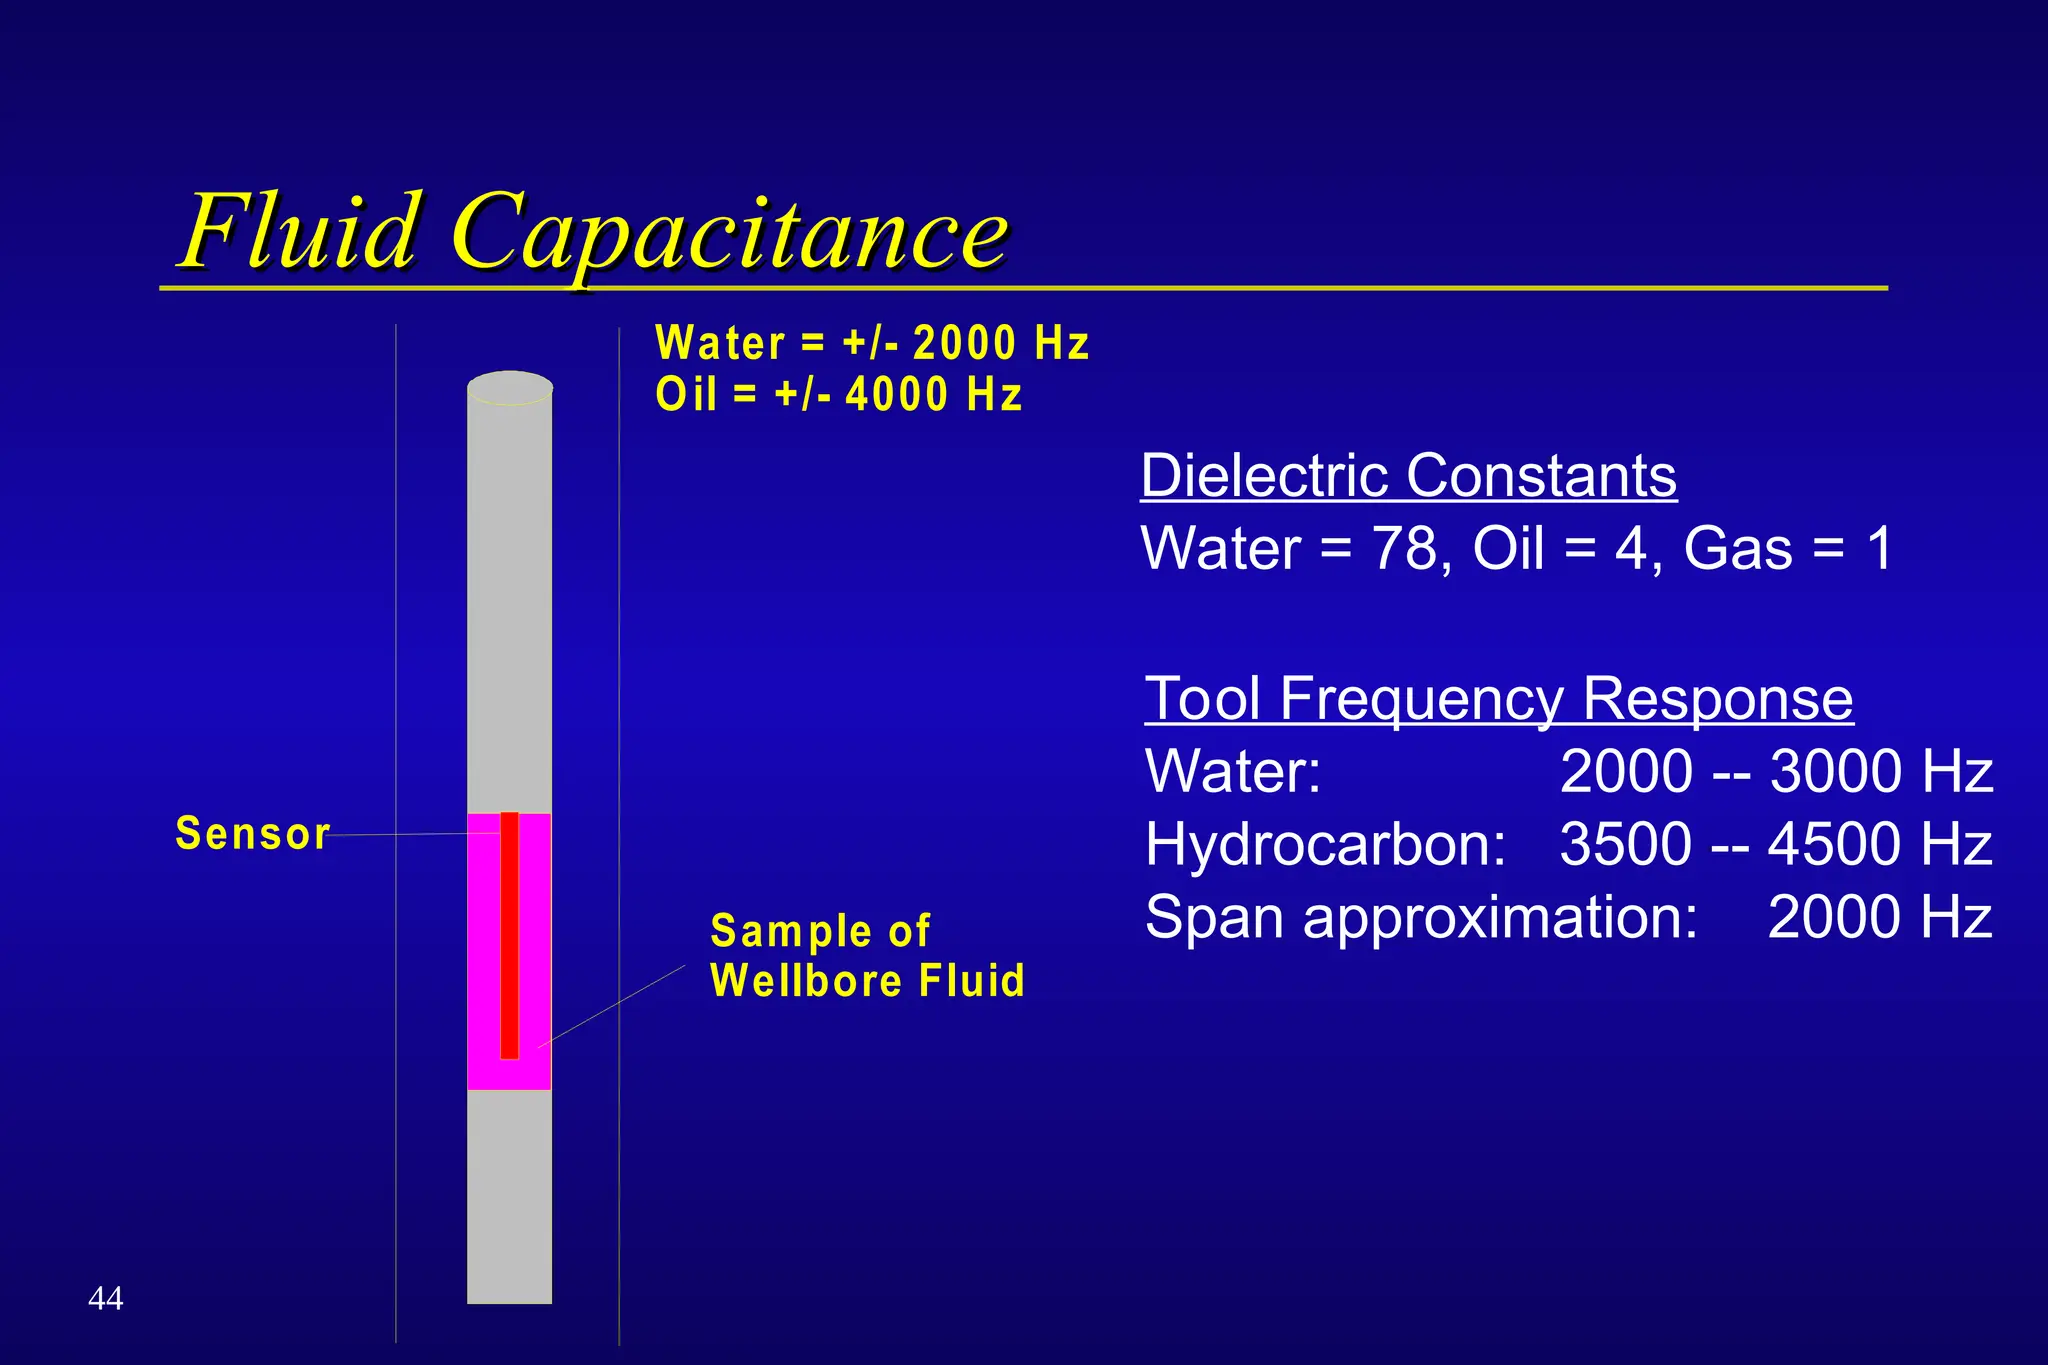
Dielectric Constants
Response
Water Oil Gas
F F F F
Mixture Hydrocarbon Water Hydrocarbon
78 4 1
100
, ,
% ( ) ( )
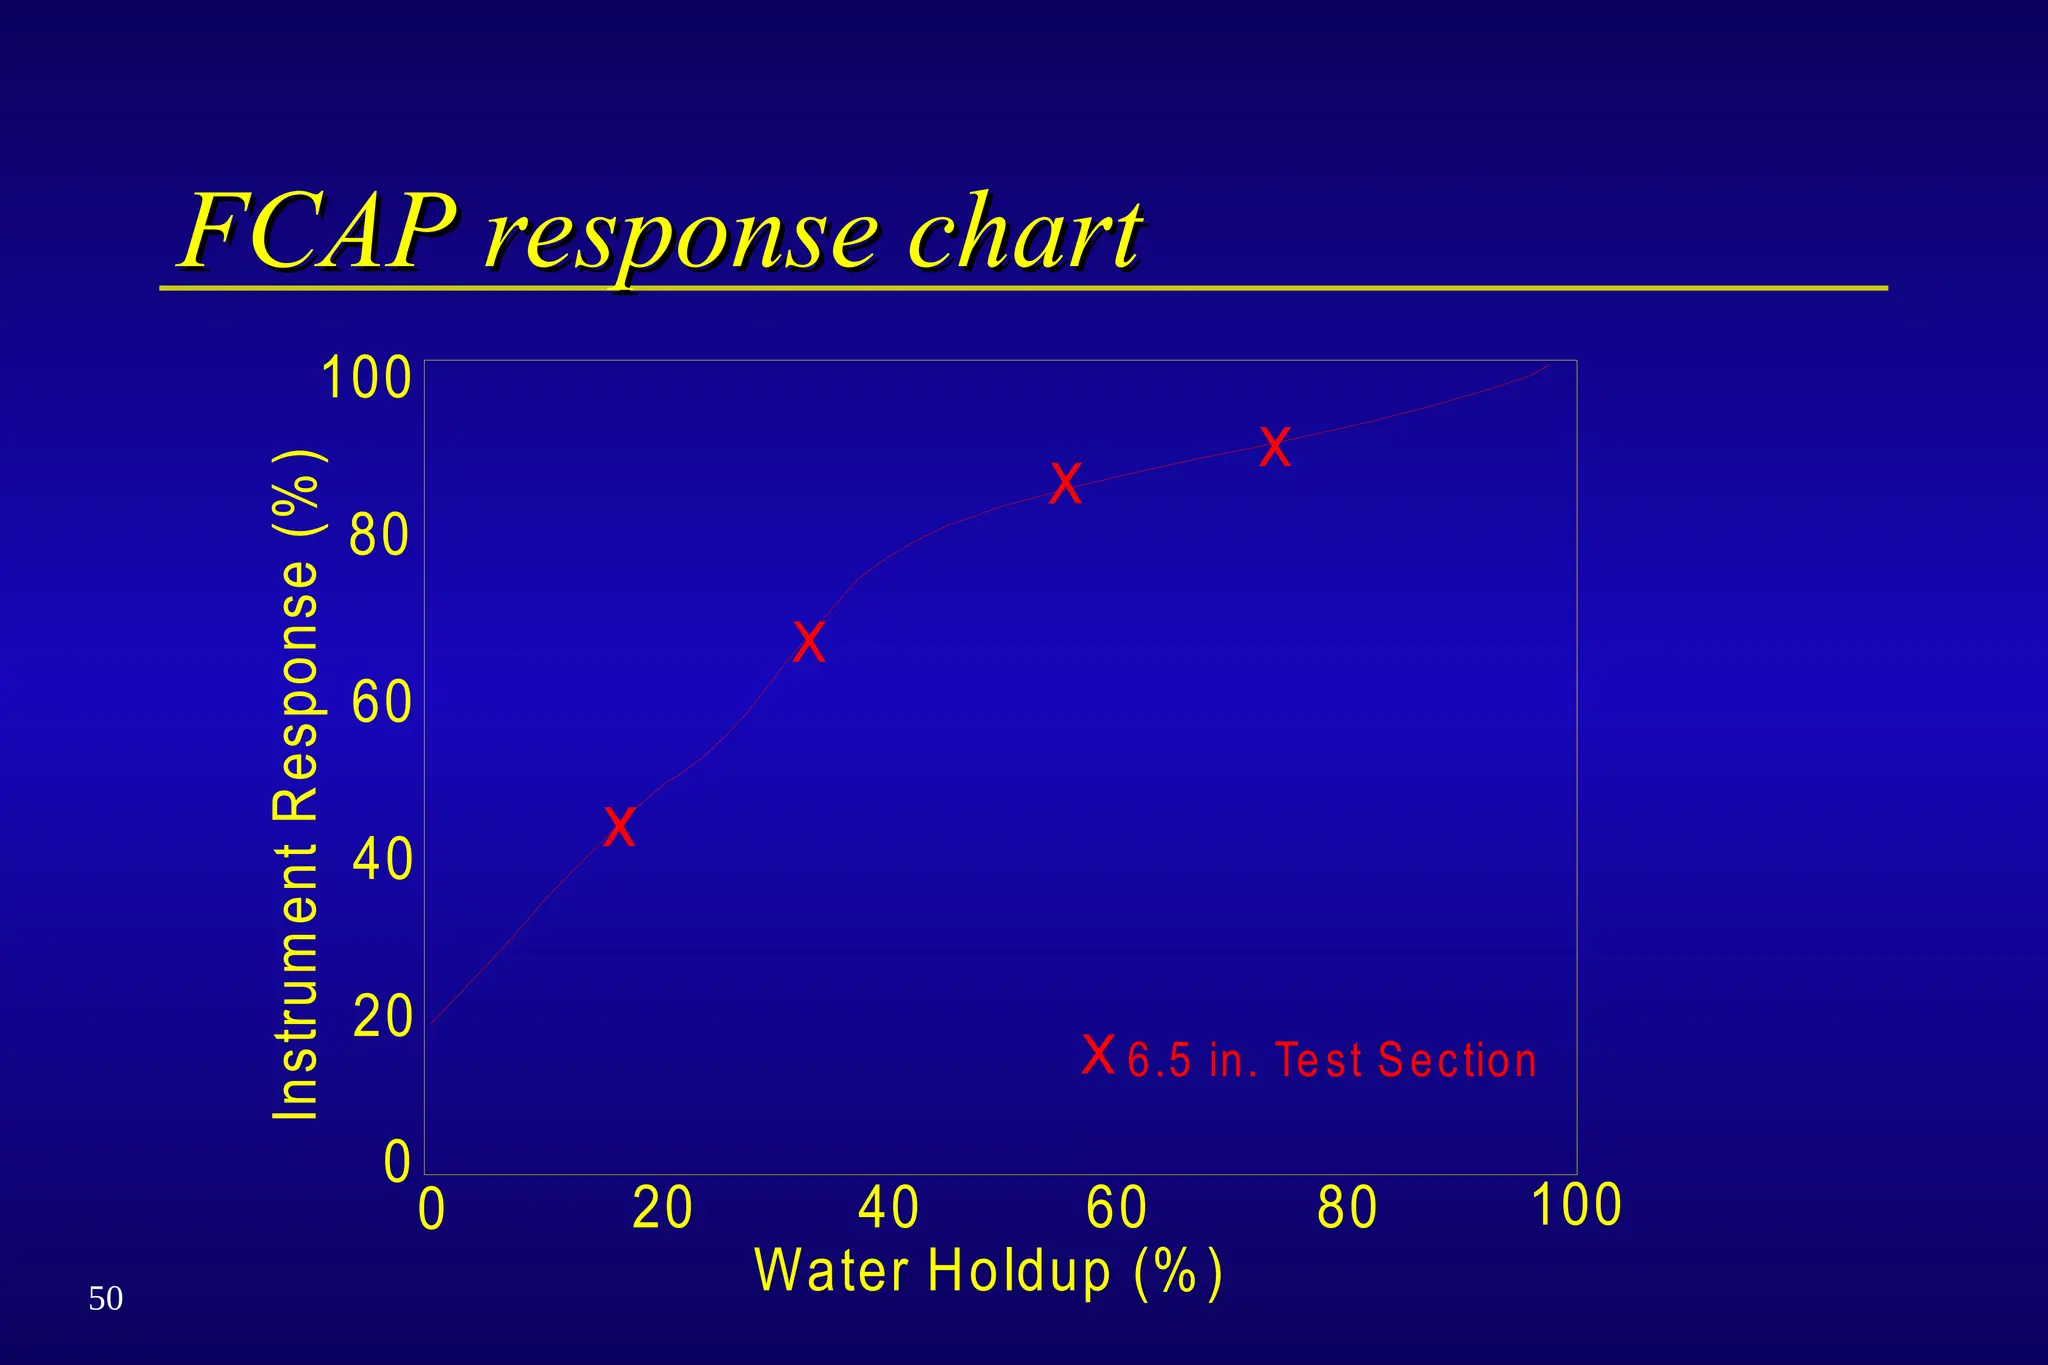
Use Fluid Capacitance chart to determine Water Holdup
50.
50
FCAP response chart
FCAPresponse chart
0 20 40 60 80 100
Water Holdup (%)
Instrum
ent
Response
(%
)
6.5 in. Test Section
0
20
40
60
80
100
52
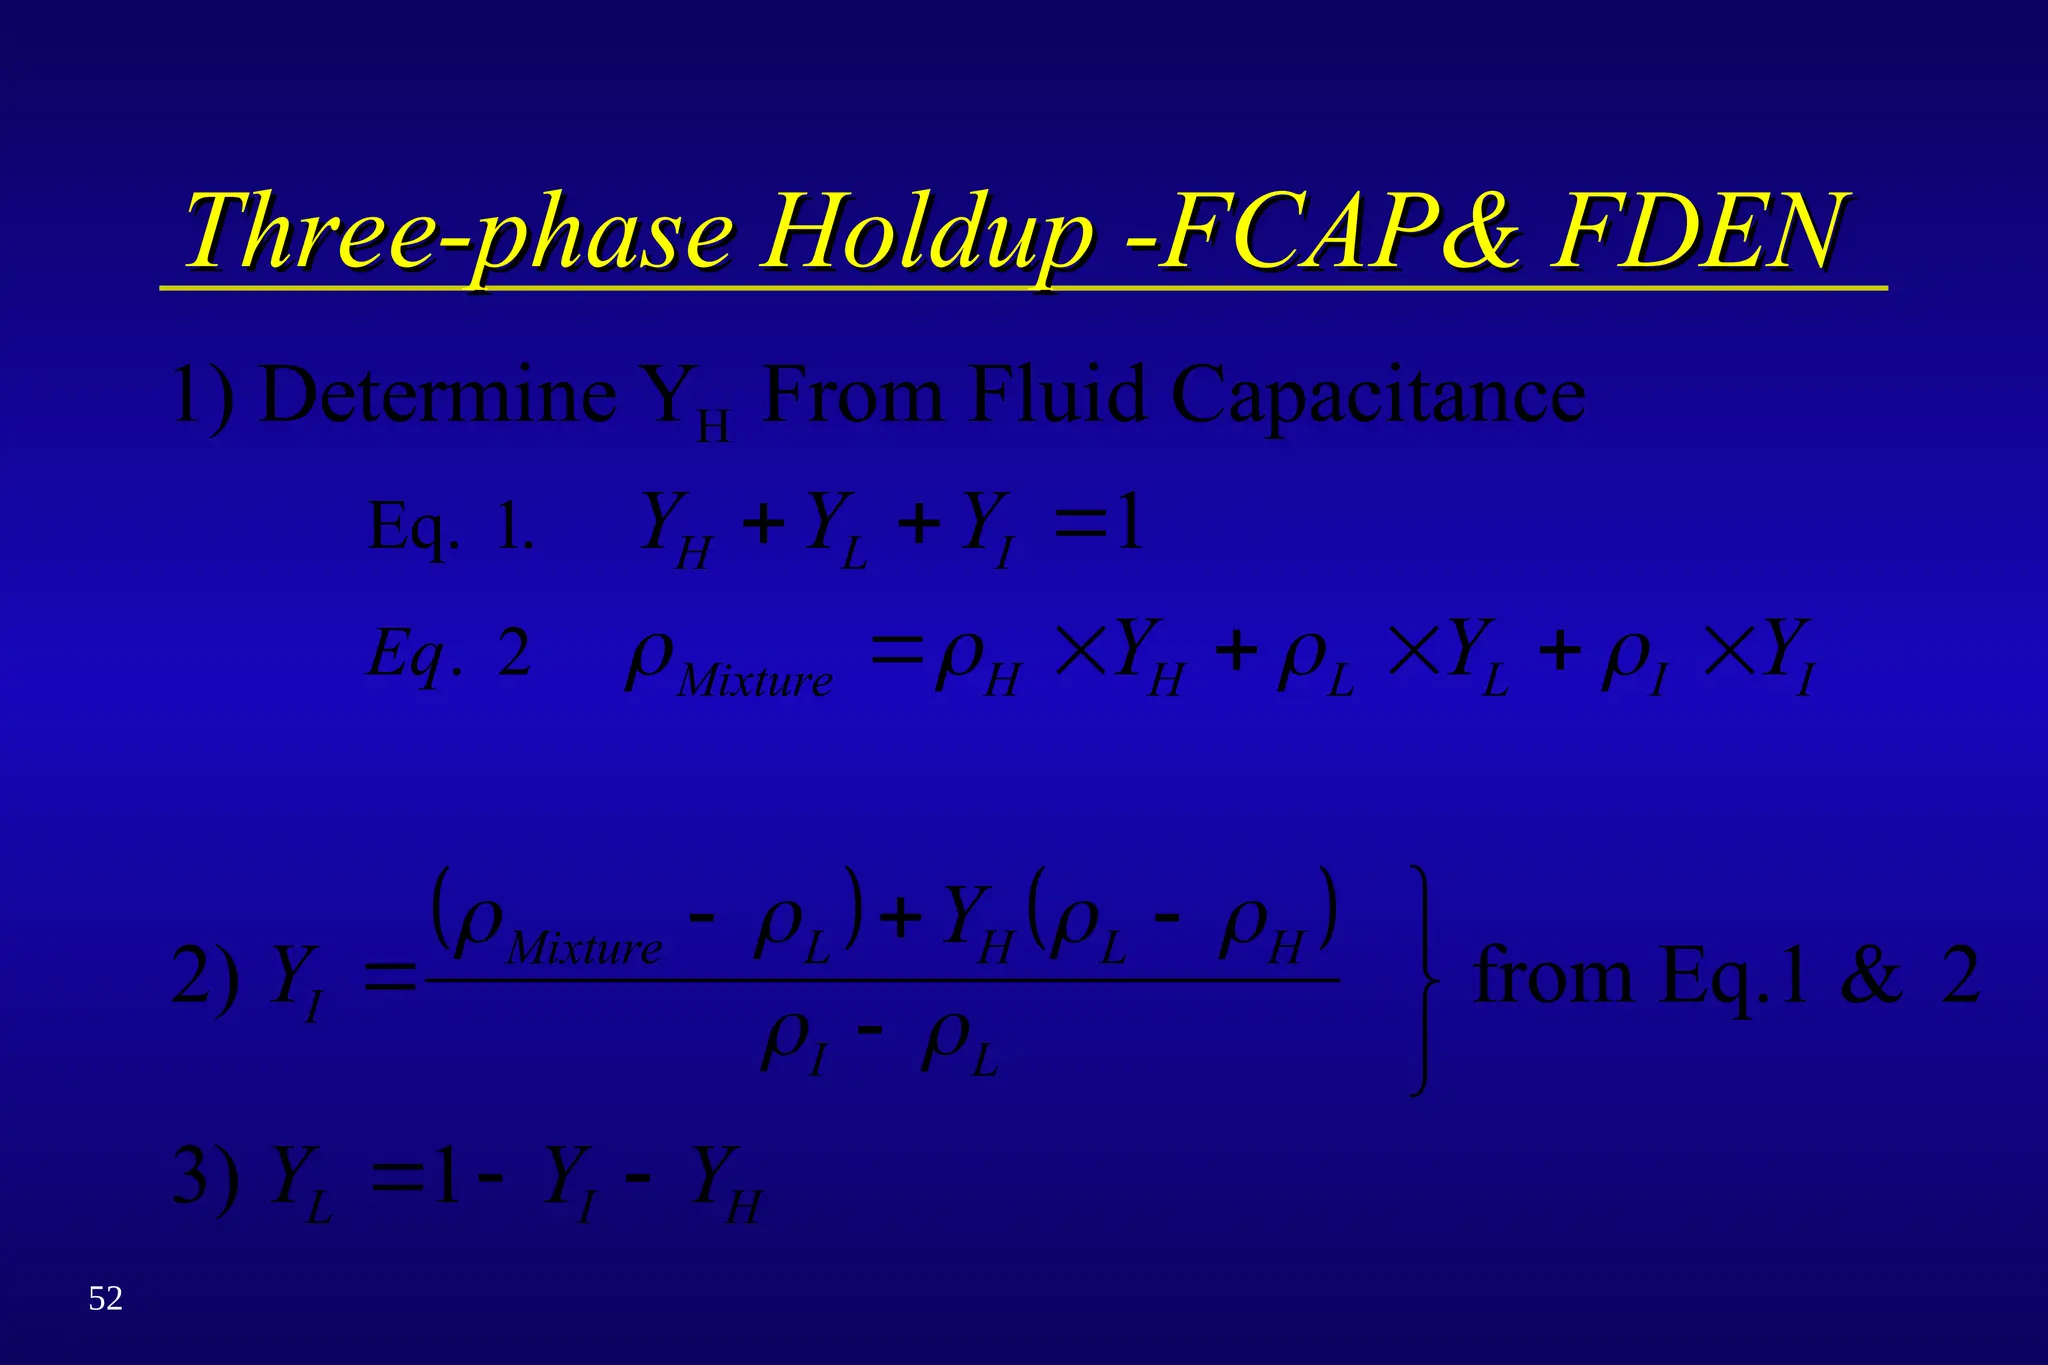
Three-phase Holdup -FCAP&FDEN
Three-phase Holdup -FCAP& FDEN
1) Determine Y From Fluid Capacitance
2) from Eq.1 & 2
3)
H
Eq. 1.
.
Y Y Y
Y Y Y
Y
Y
Y Y Y
H L I
Mixture H H L L I I
I
Mixture L H L H
I L
L I H
Eq
1
1
2
54
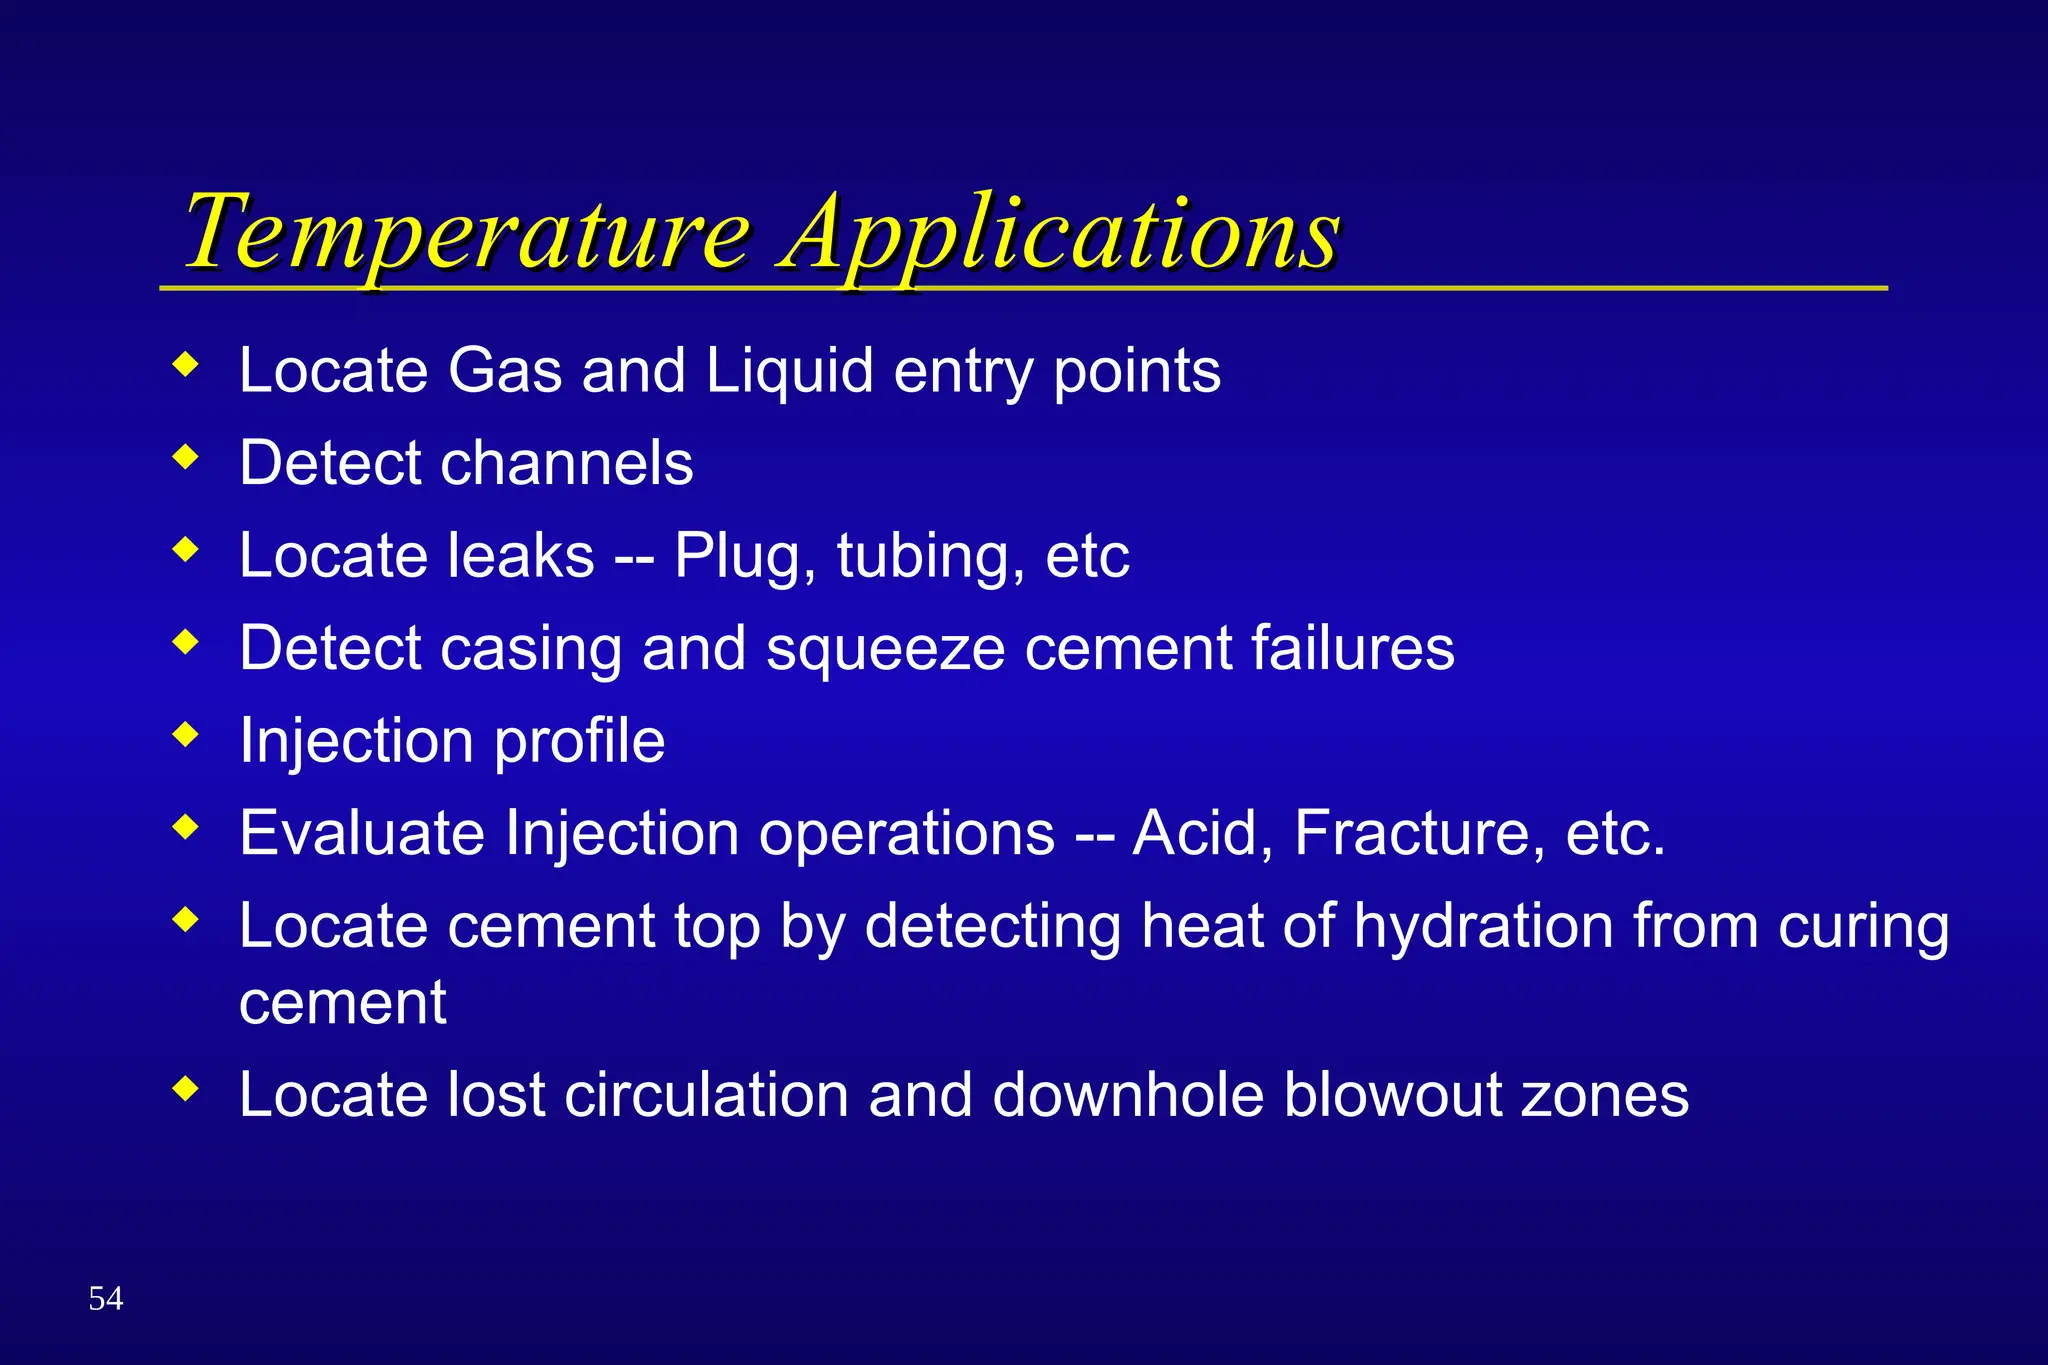
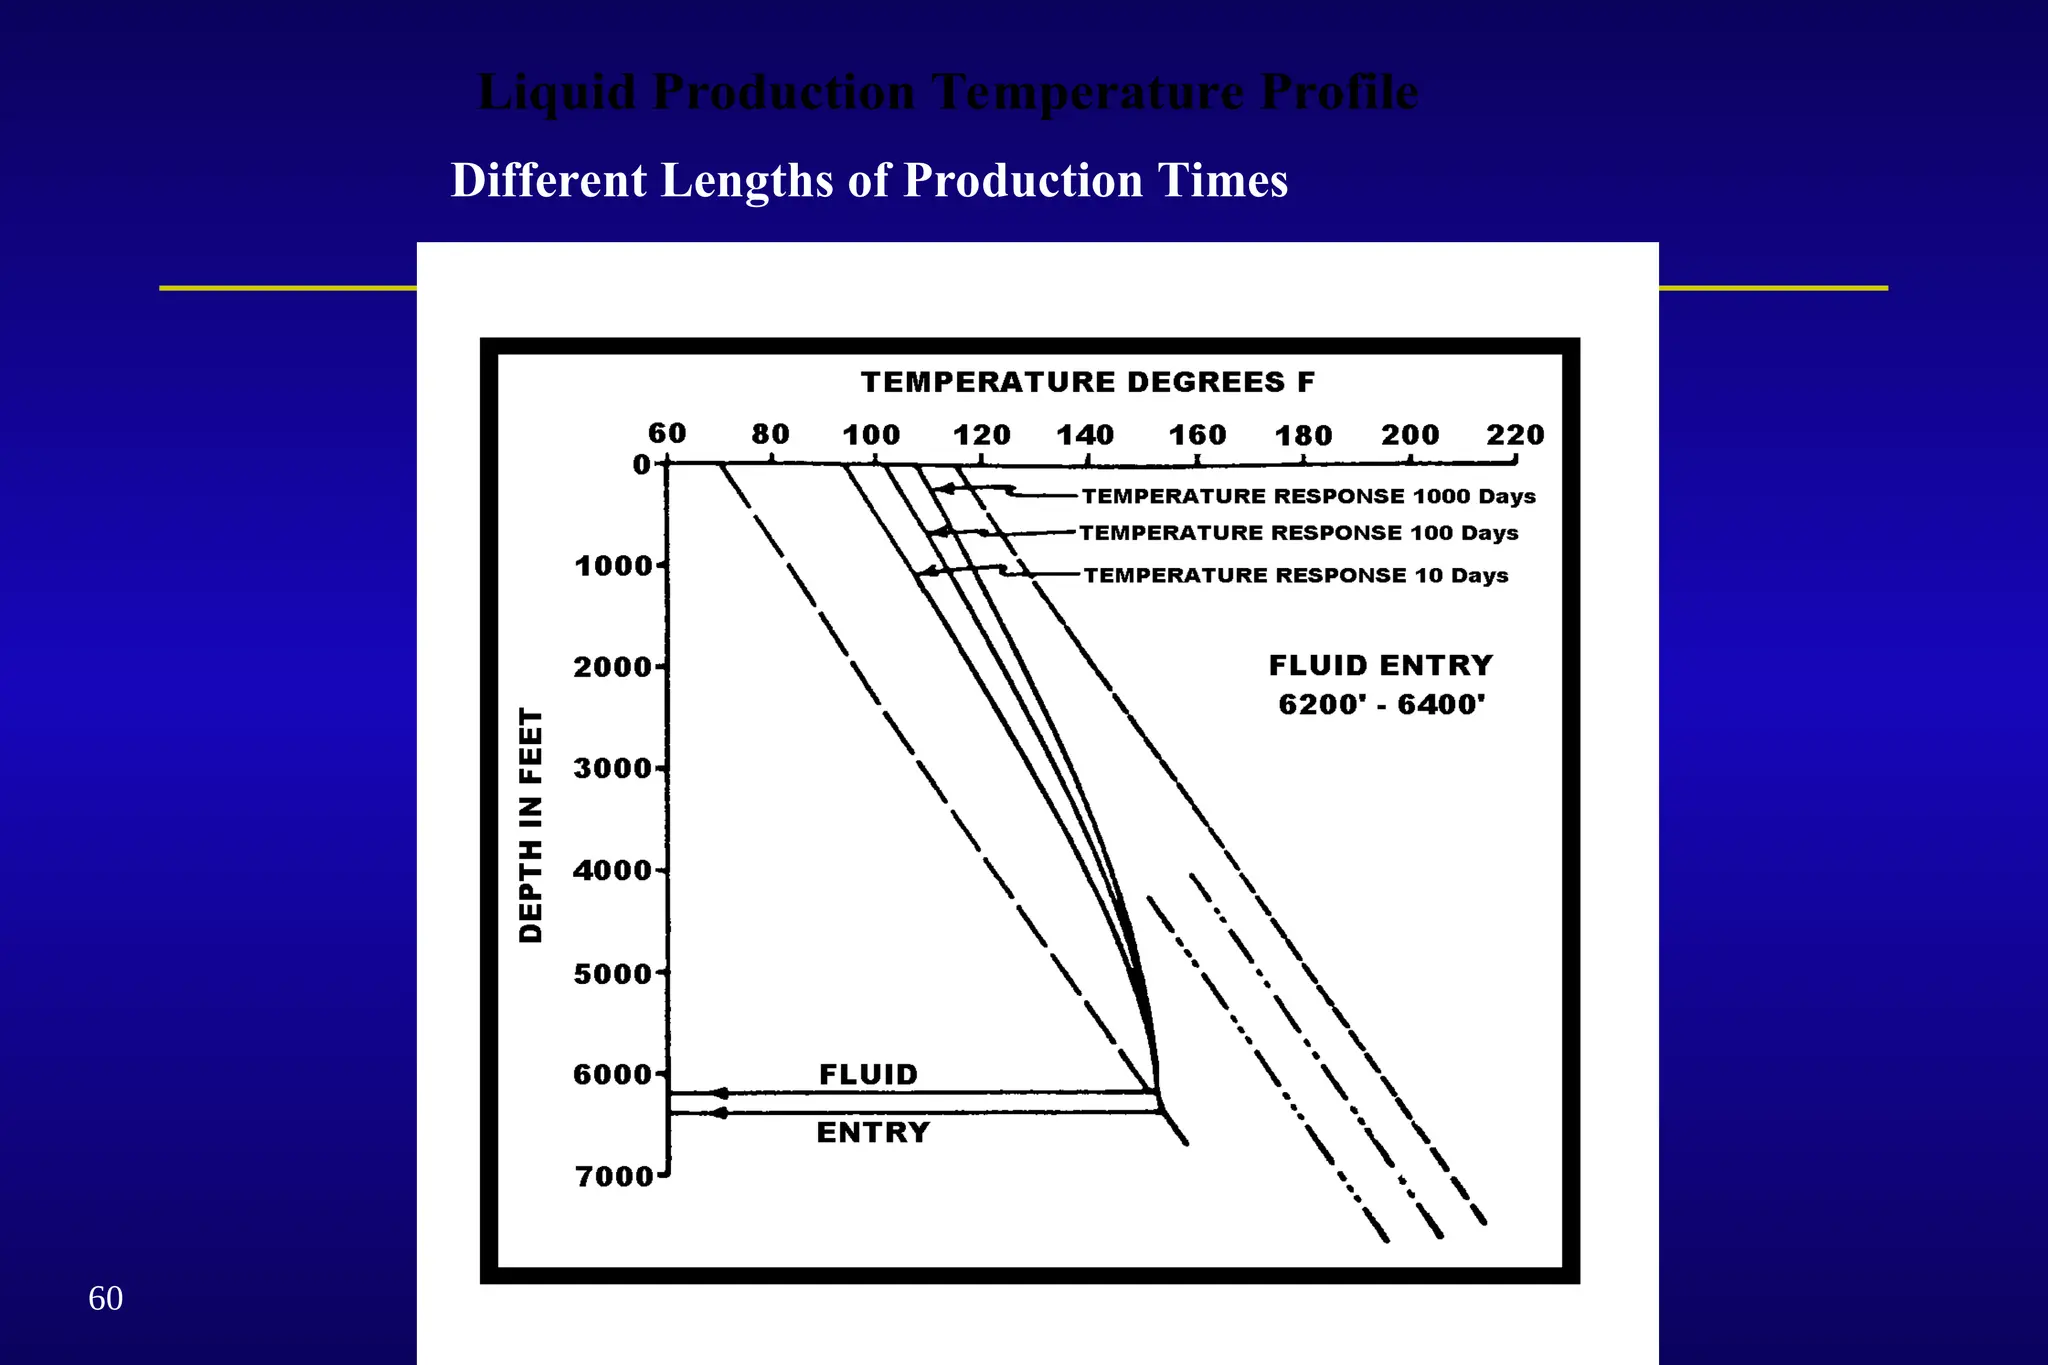
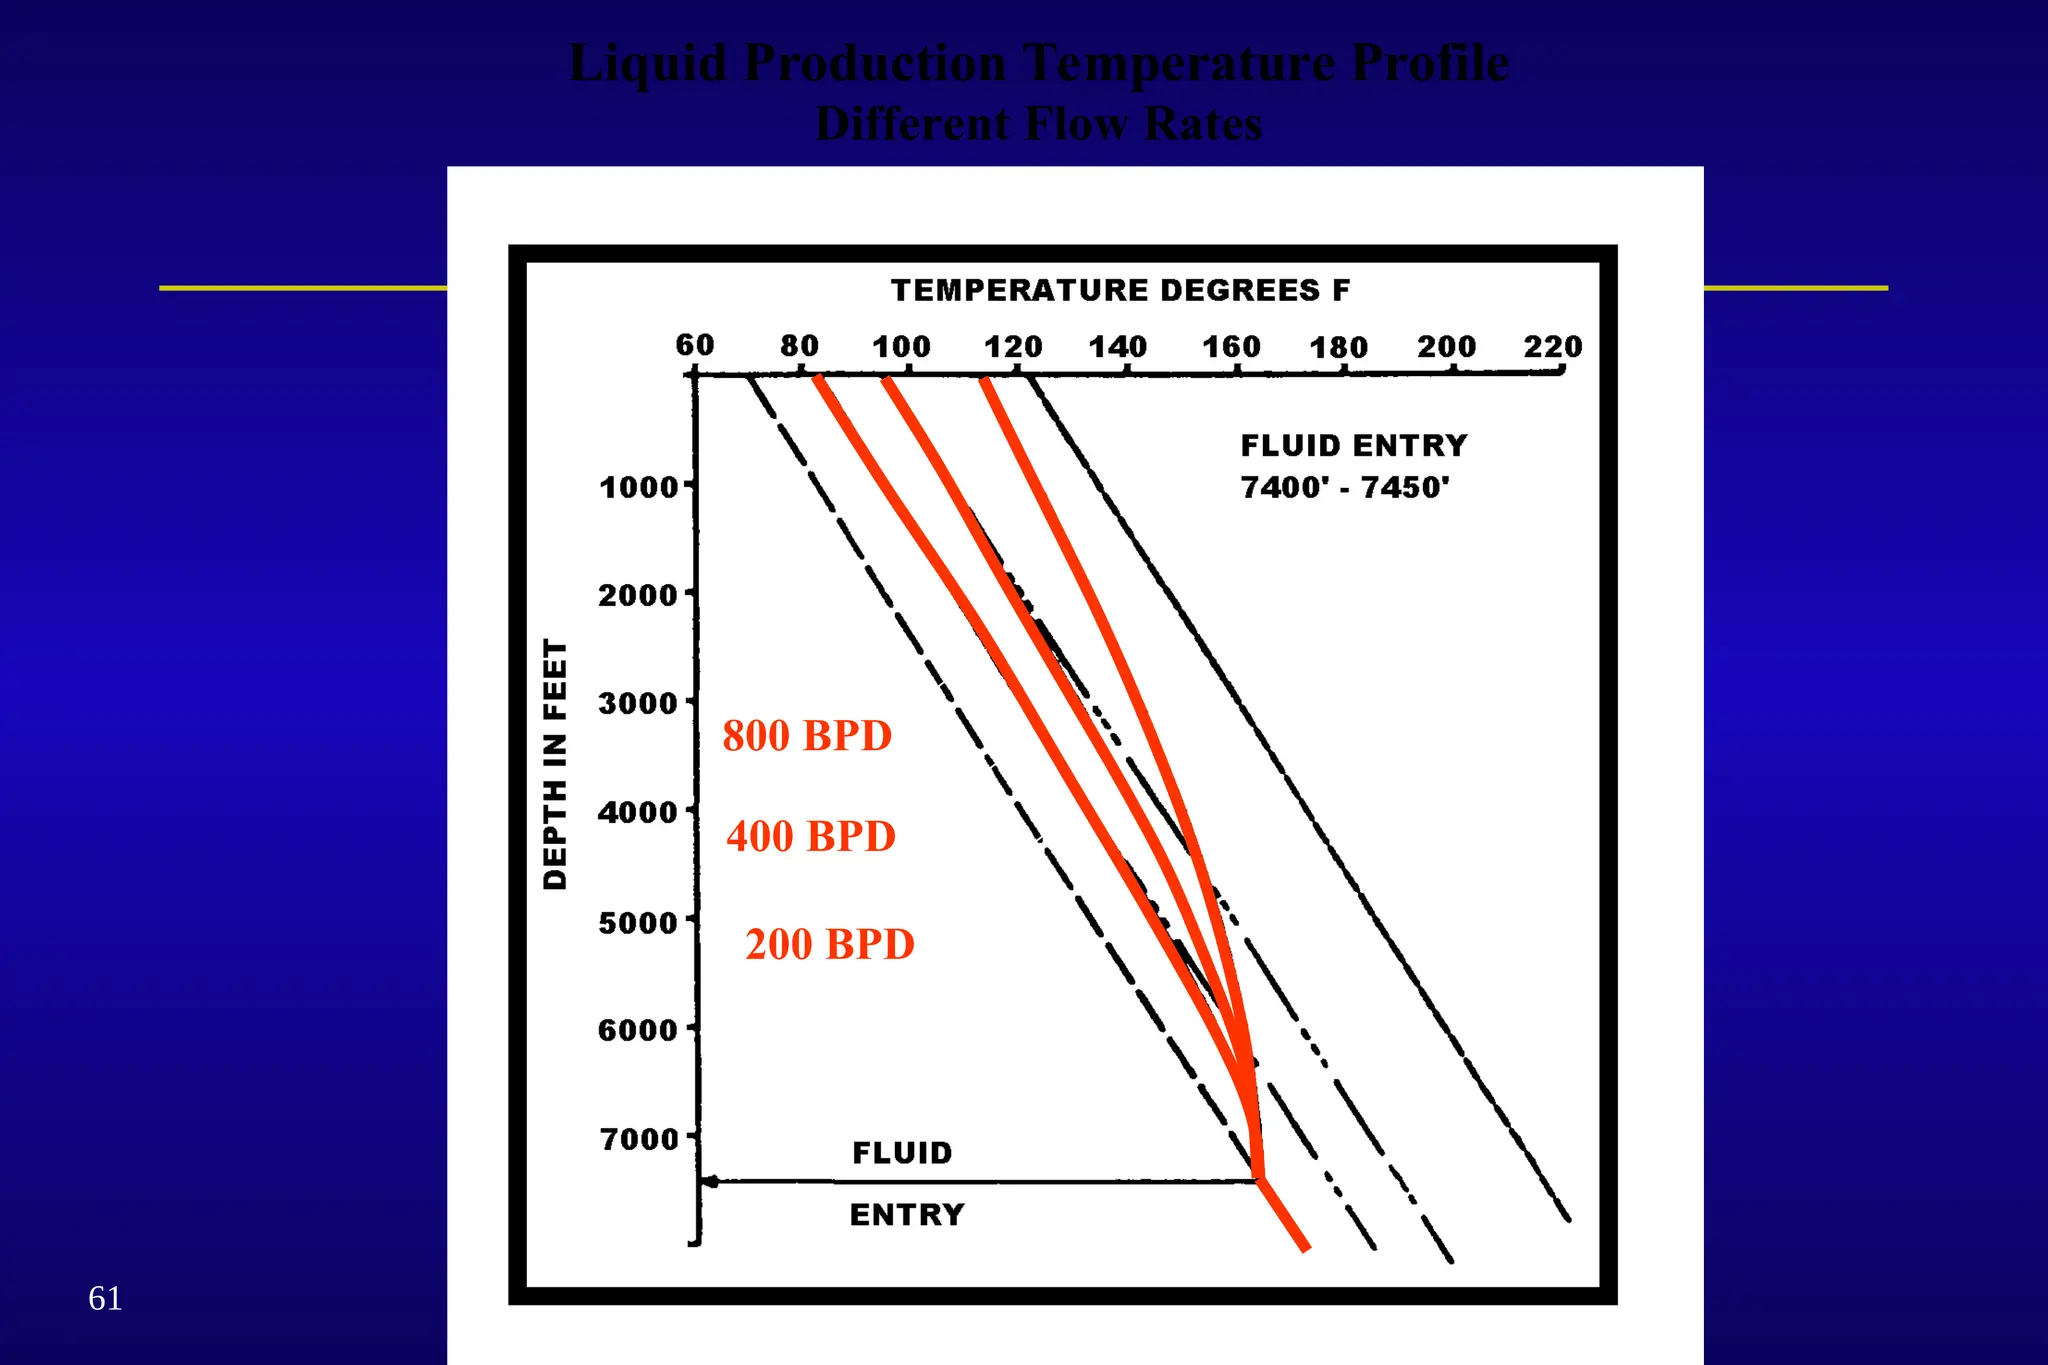
Temperature Applications
Temperature Applications
Locate Gas and Liquid entry points
Detect channels
Locate leaks -- Plug, tubing, etc
Detect casing and squeeze cement failures
Injection profile
Evaluate Injection operations -- Acid, Fracture, etc.
Locate cement top by detecting heat of hydration from curing
cement
Locate lost circulation and downhole blowout zones
56
Qualitative Interpretation
Qualitative Interpretation
Geothermal Gradient
Typical gradients are between:
0.5 deg.F/100ft. and 2 deg.F/100ft.
This is dictated by the thermal conductivity of the
formations and the proximity to geothermal energy.
57.
57
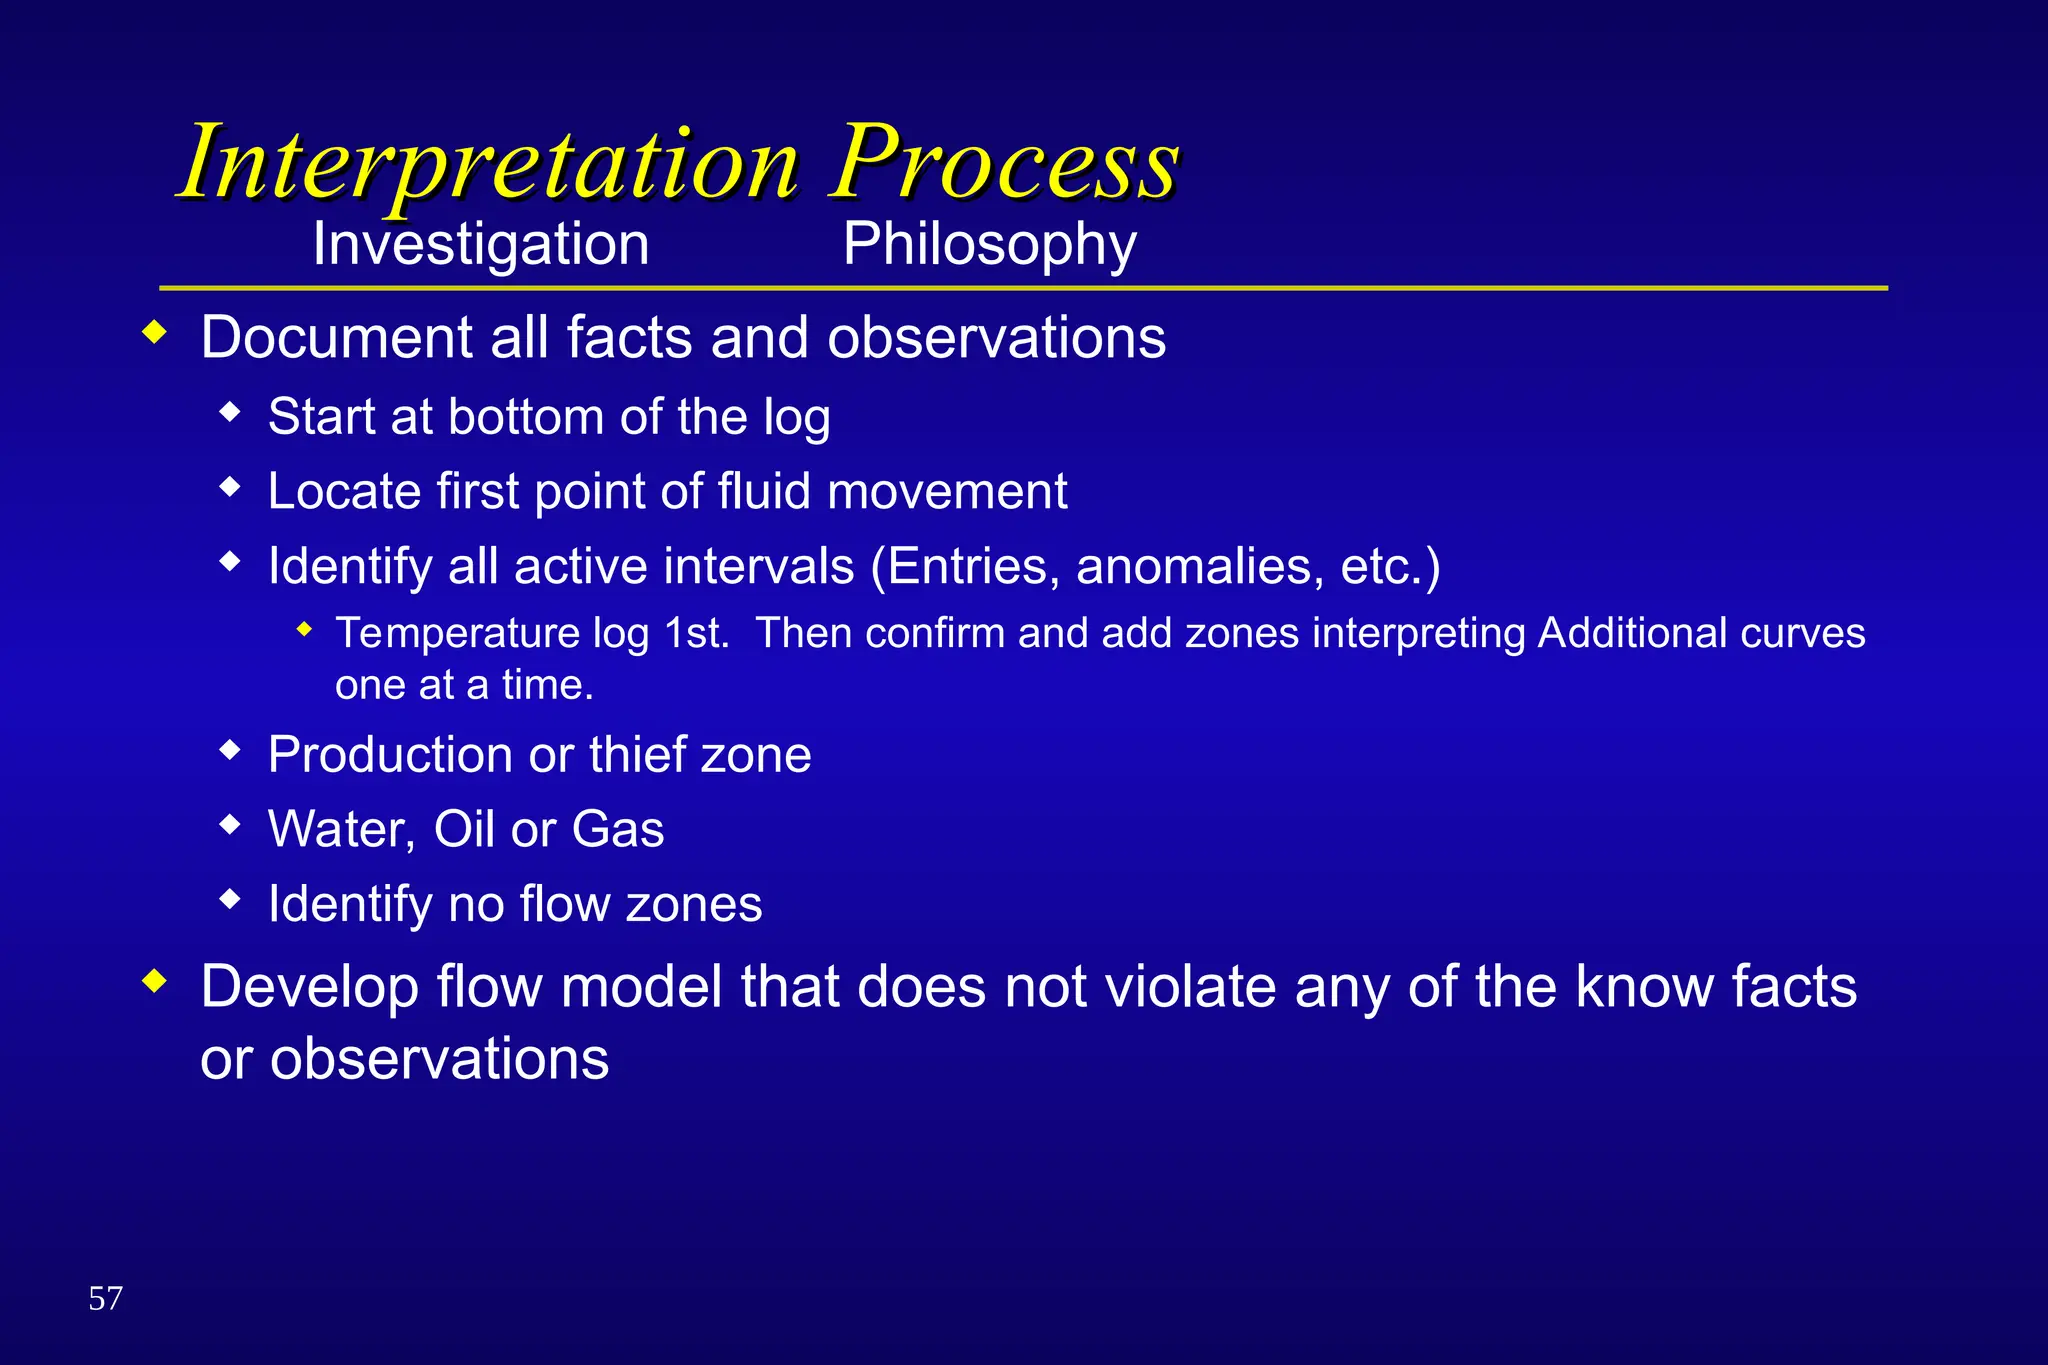
Interpretation Process
Interpretation Process
InvestigationPhilosophy
Document all facts and observations
Start at bottom of the log
Locate first point of fluid movement
Identify all active intervals (Entries, anomalies, etc.)
Temperature log 1st. Then confirm and add zones interpreting Additional curves
one at a time.
Production or thief zone
Water, Oil or Gas
Identify no flow zones
Develop flow model that does not violate any of the know facts
or observations
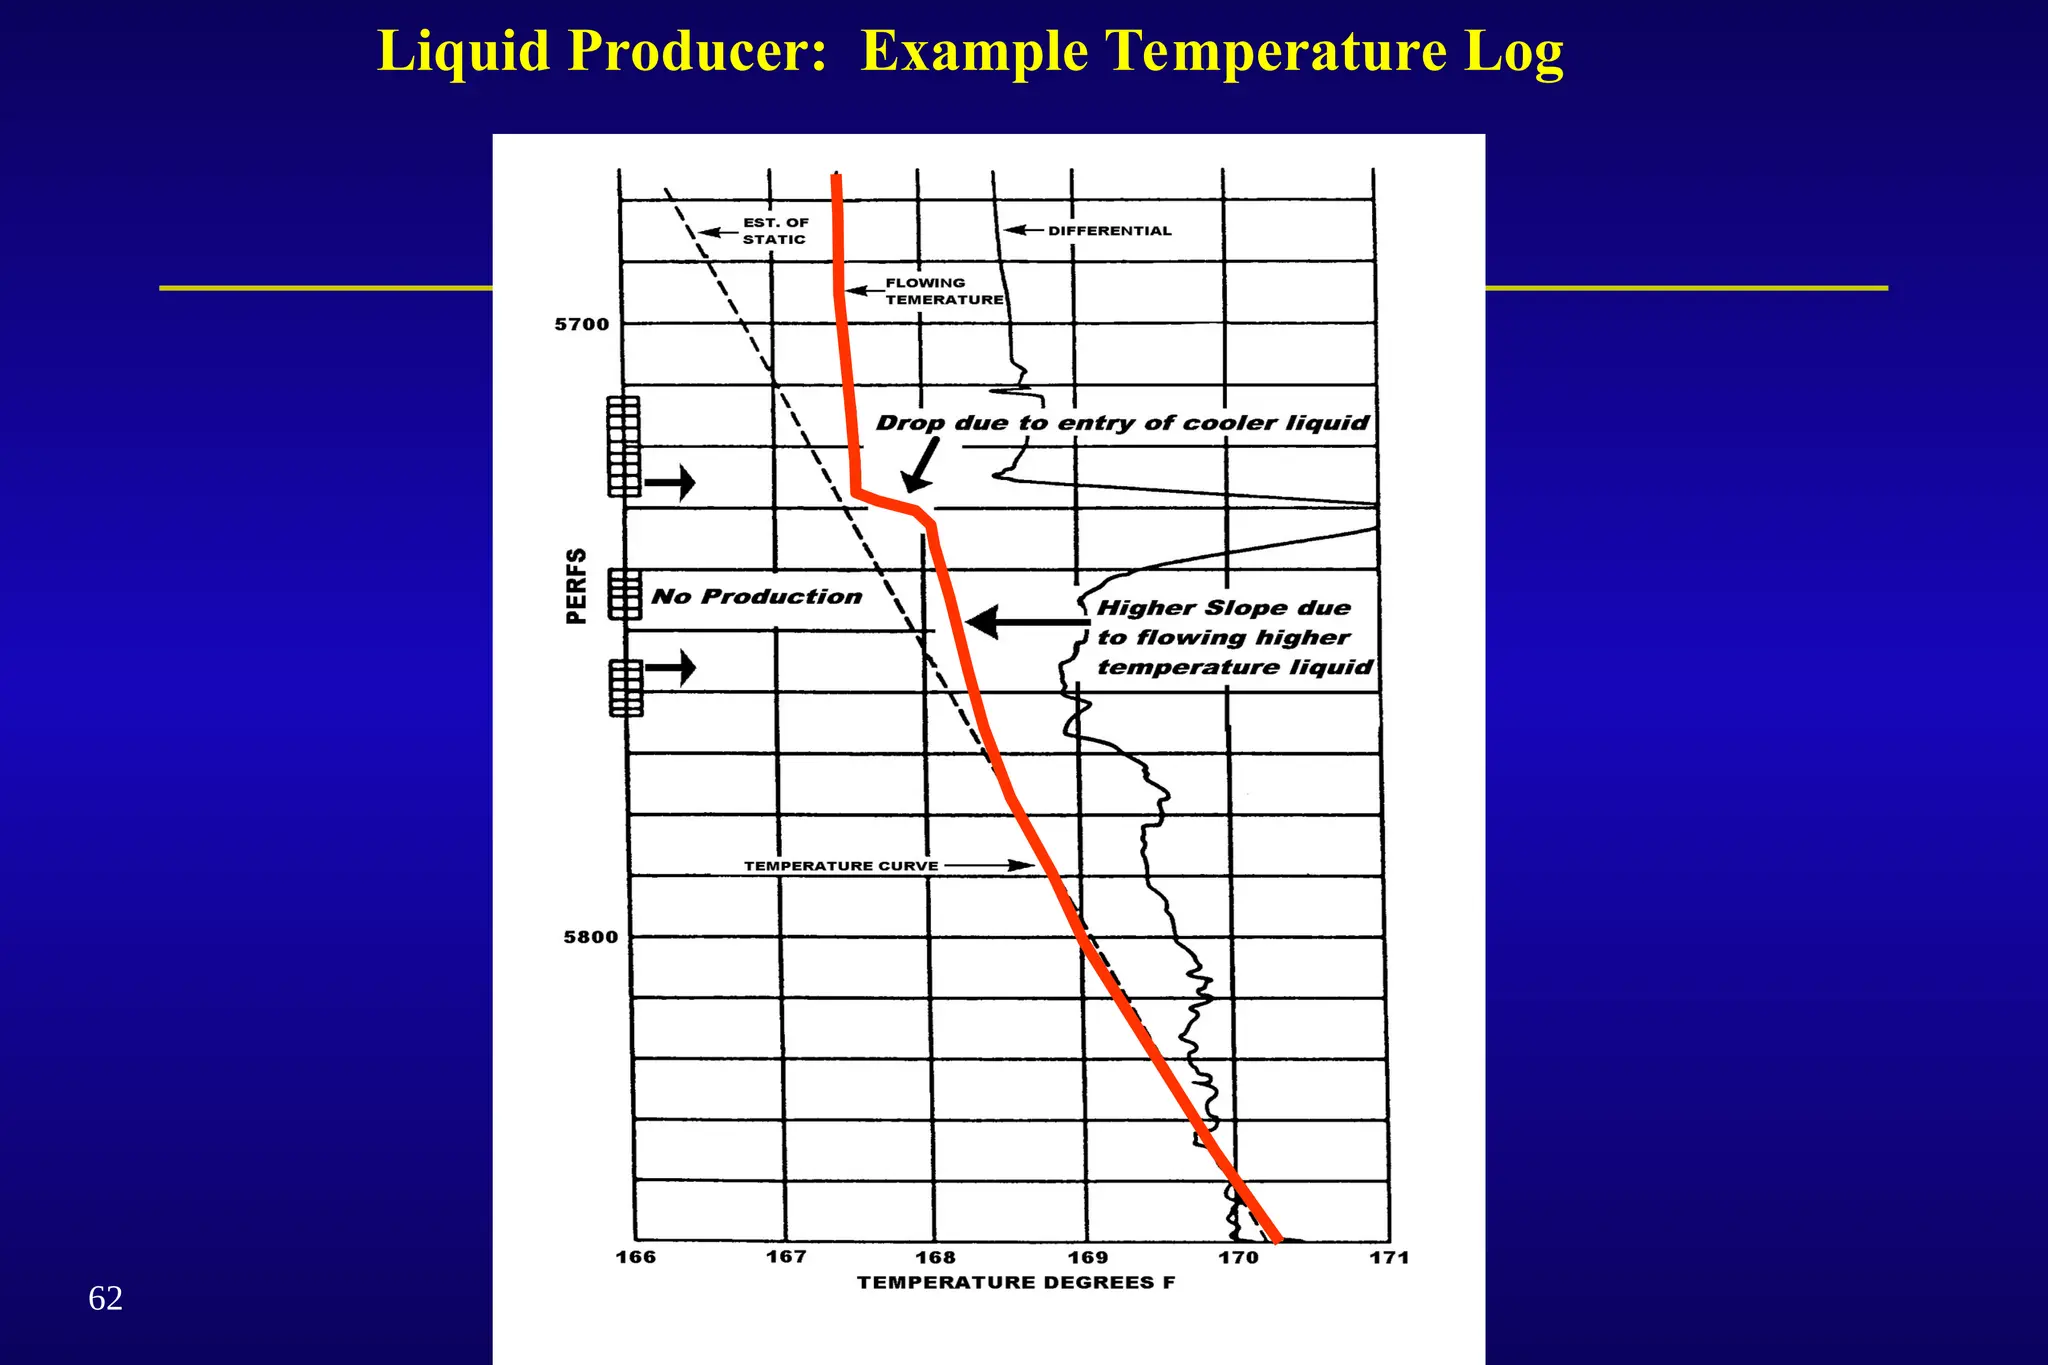
58.
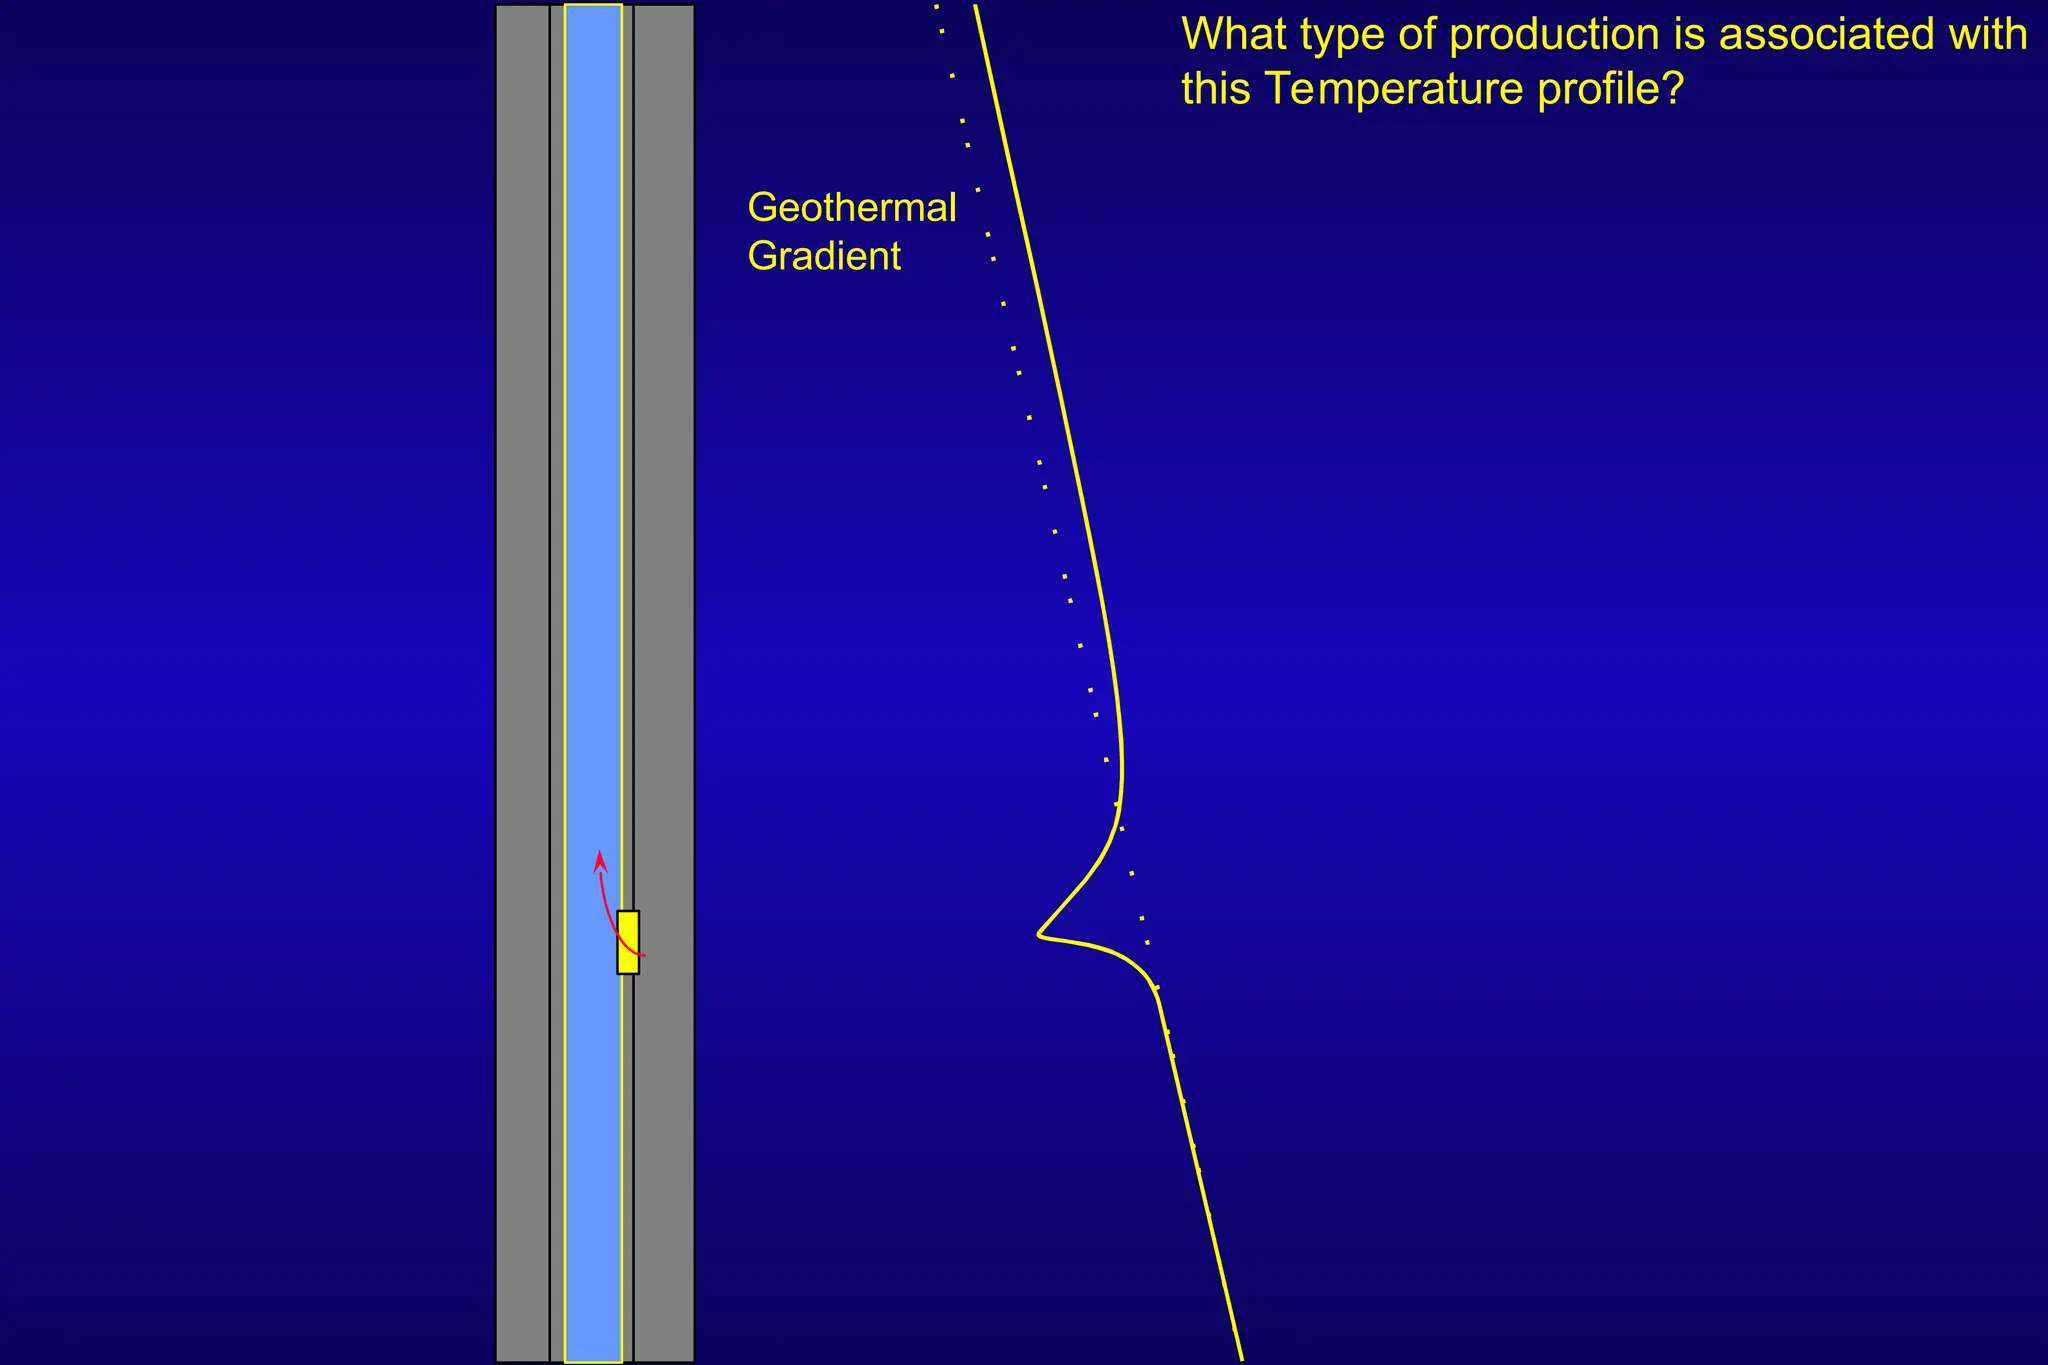
What type ofproduction is associated with
this Temperature profile?
Geothermal
Gradient
59.
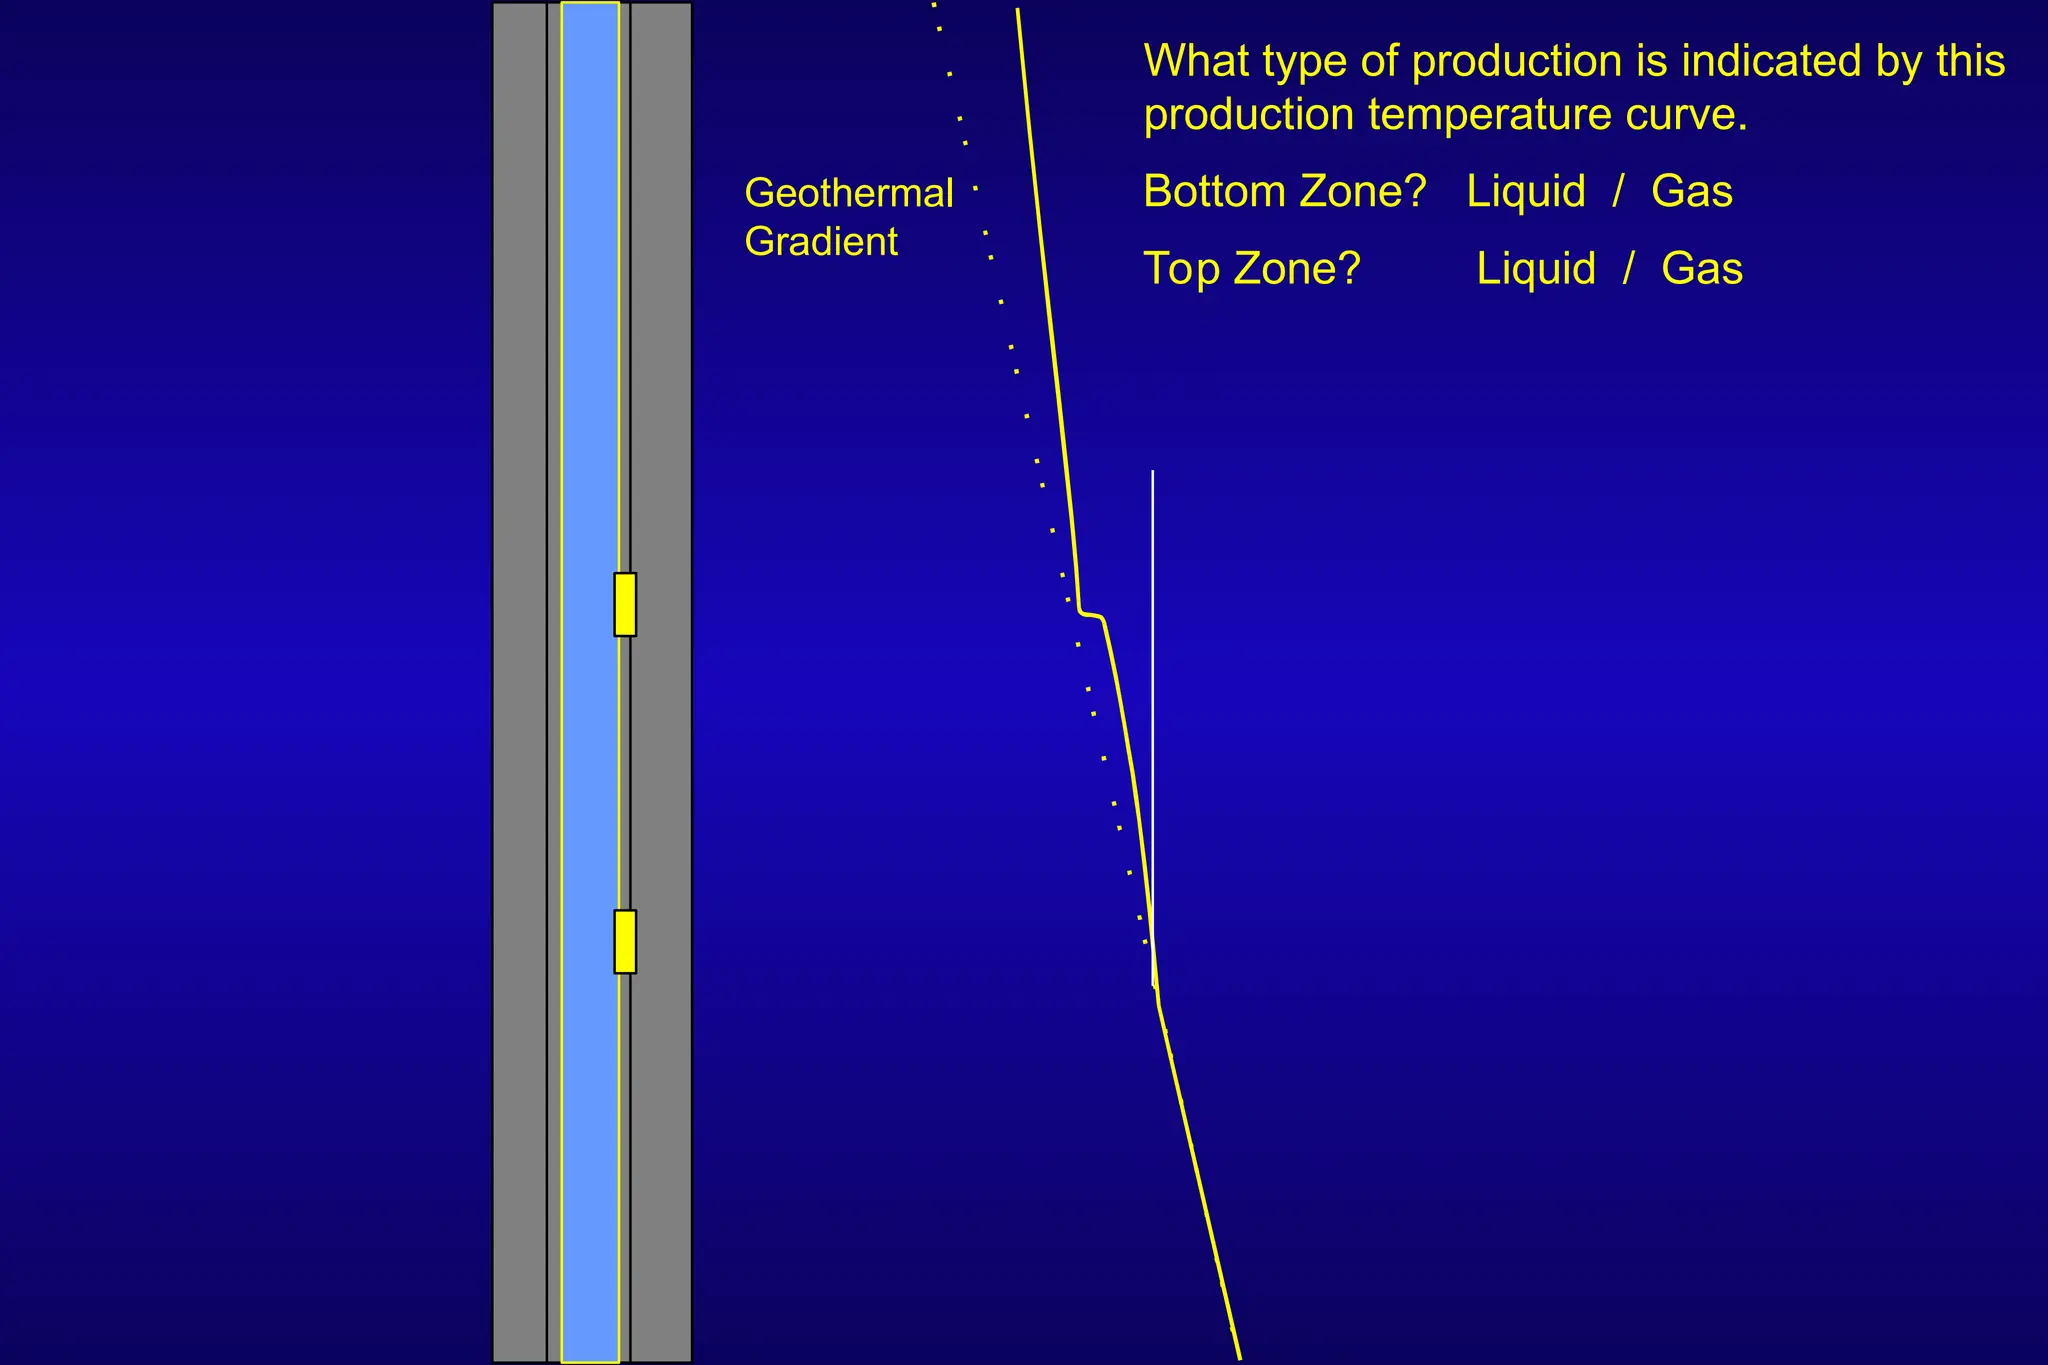
What type ofproduction is indicated by this
production temperature curve.
Bottom Zone? Liquid / Gas
Top Zone? Liquid / Gas
Geothermal
Gradient
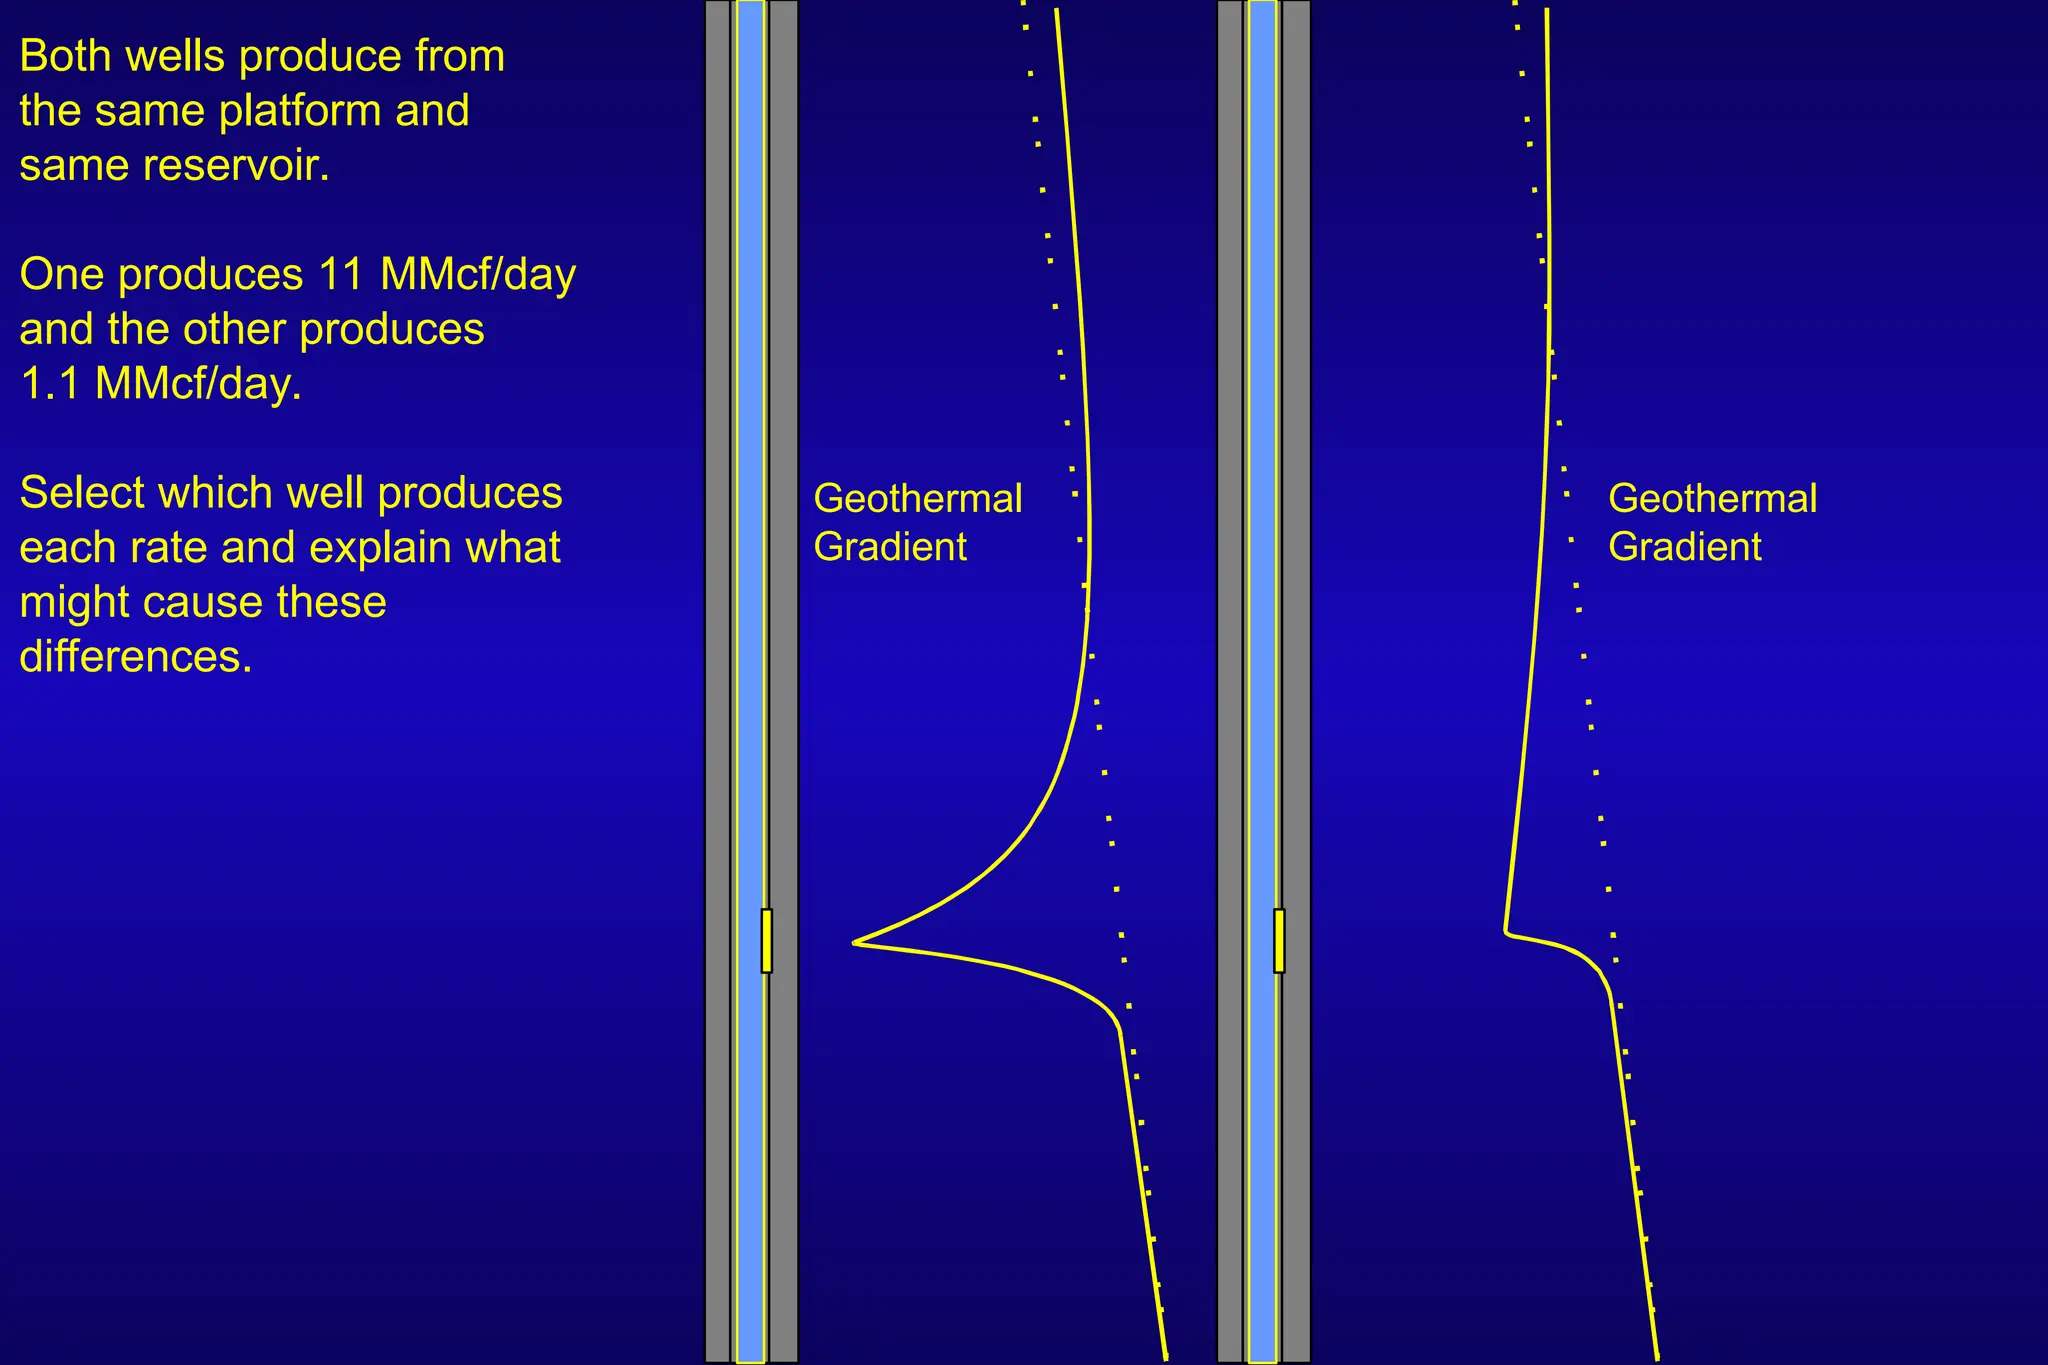
Both wells producefrom
the same platform and
same reservoir.
One produces 11 MMcf/day
and the other produces
1.1 MMcf/day.
Select which well produces
each rate and explain what
might cause these
differences.
Geothermal
Gradient
Geothermal
Gradient
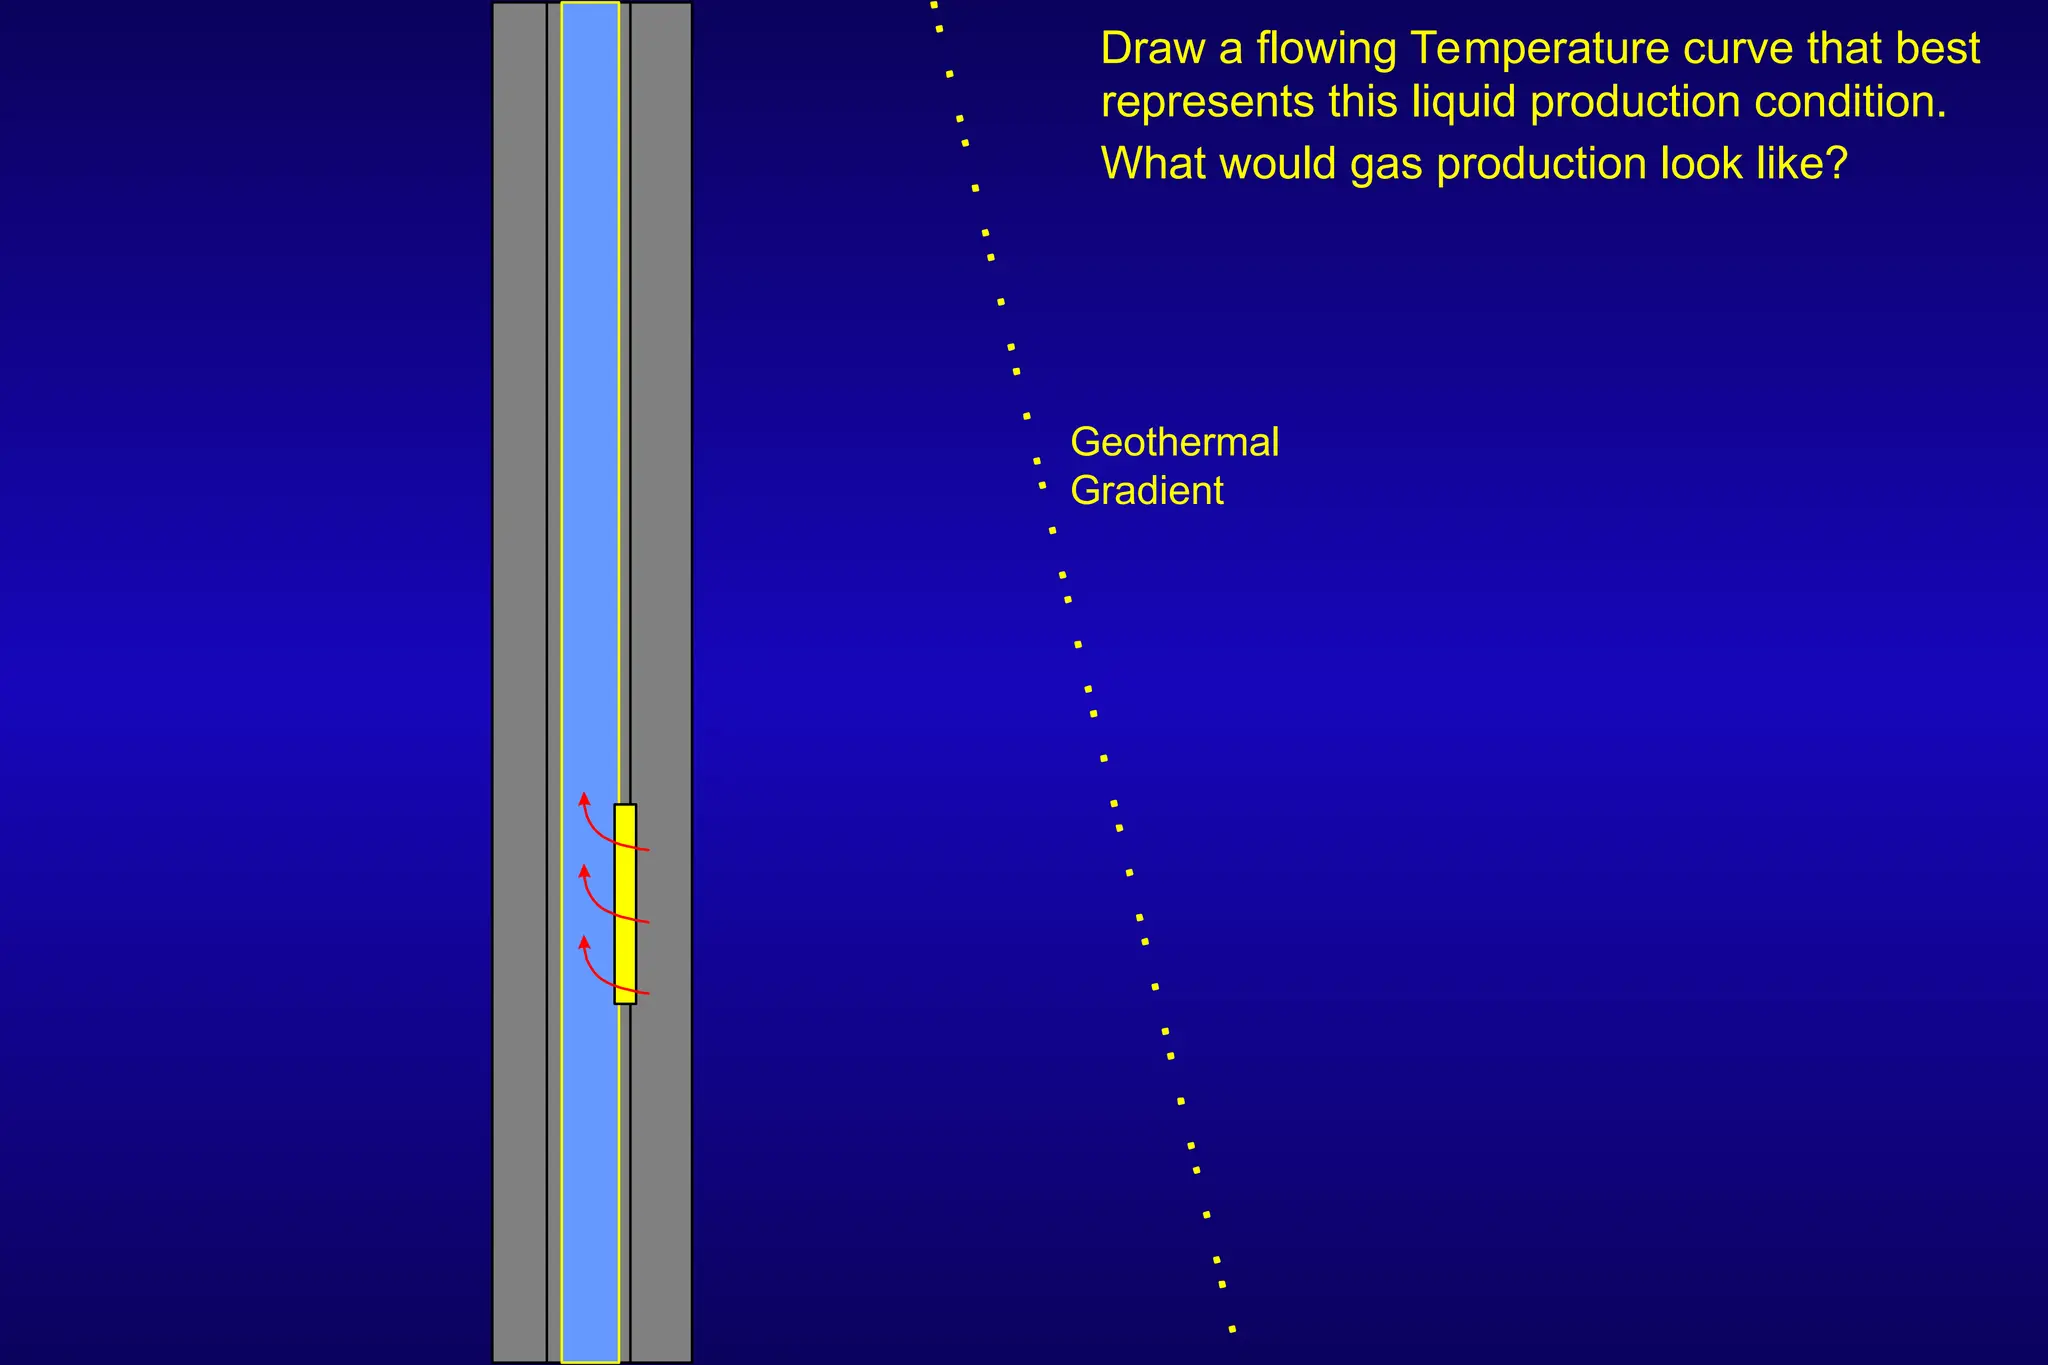
64.
Draw a flowingTemperature curve that best
represents this liquid production condition.
What would gas production look like?
Geothermal
Gradient
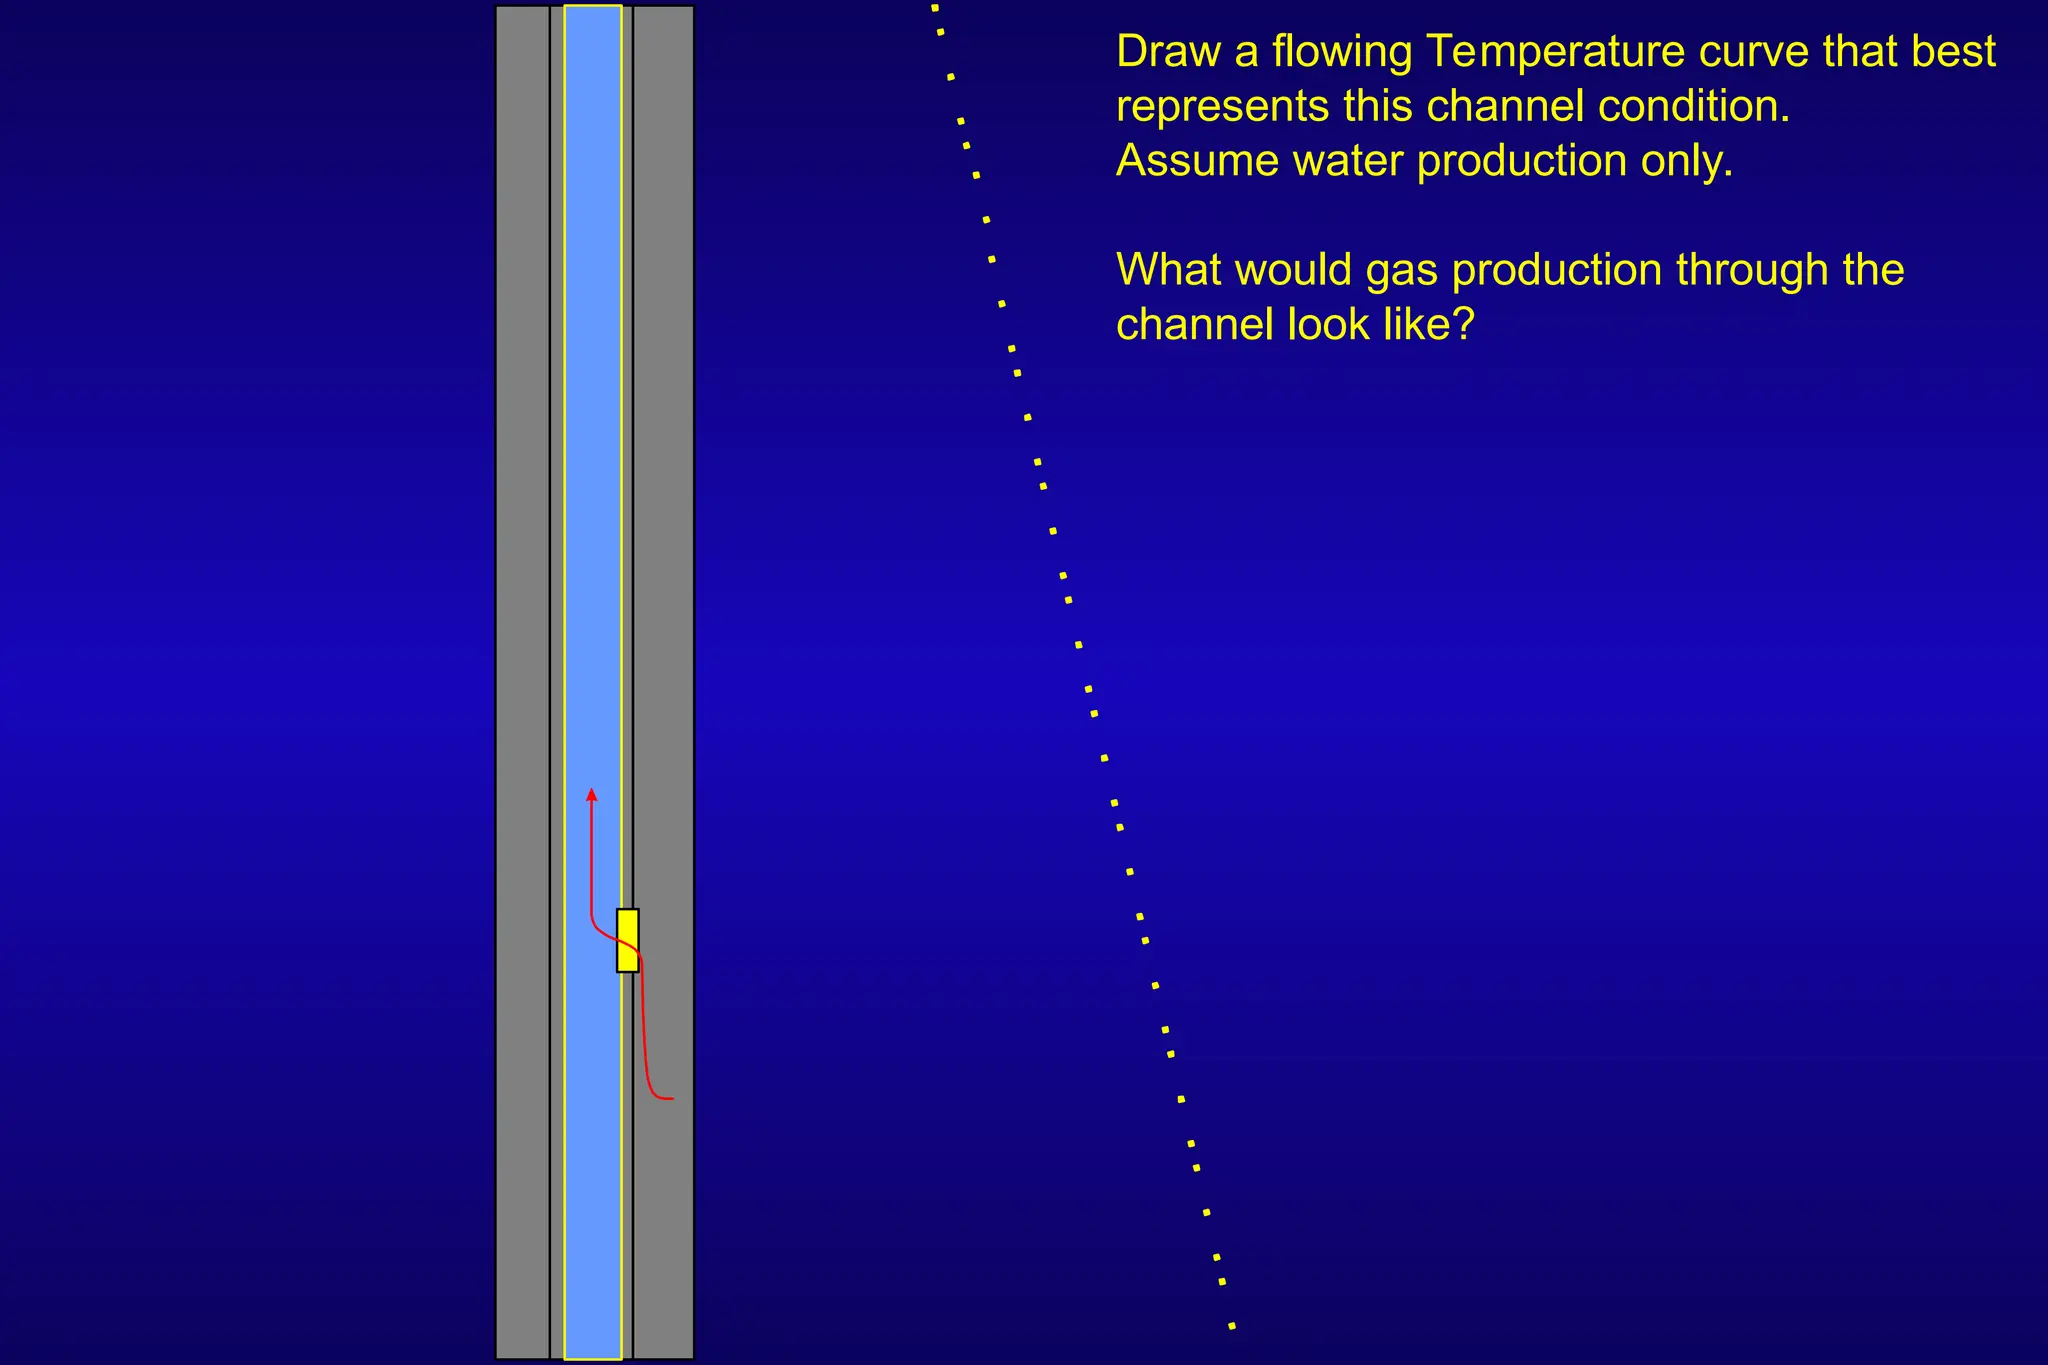
65.
Draw a flowingTemperature curve that best
represents this channel condition.
Assume water production only.
What would gas production through the
channel look like?
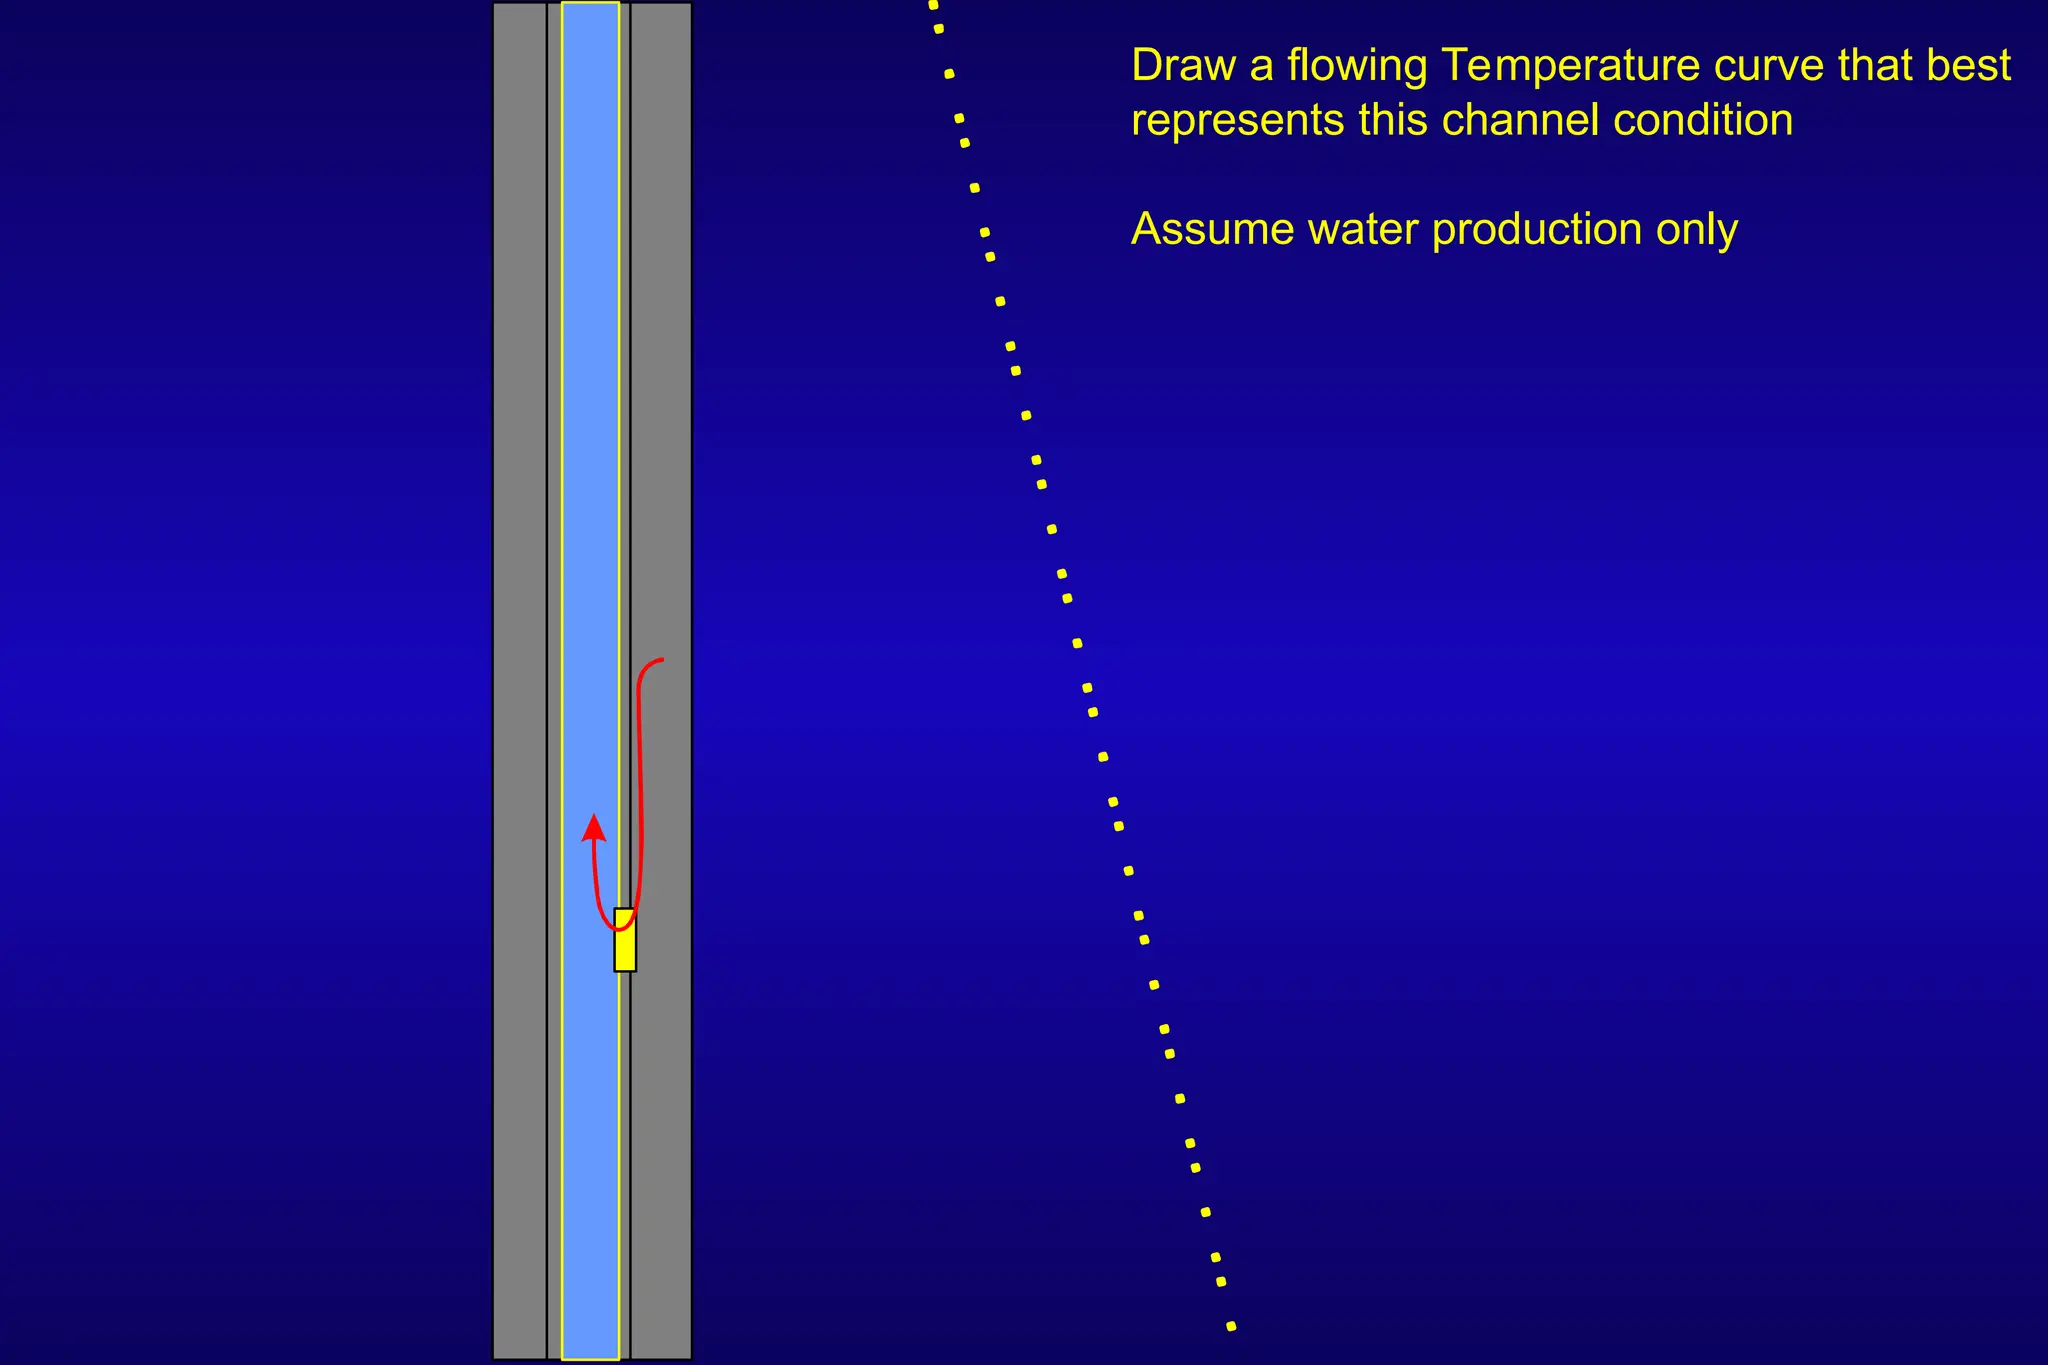
66.
Draw a flowingTemperature curve that best
represents this channel condition
Assume water production only
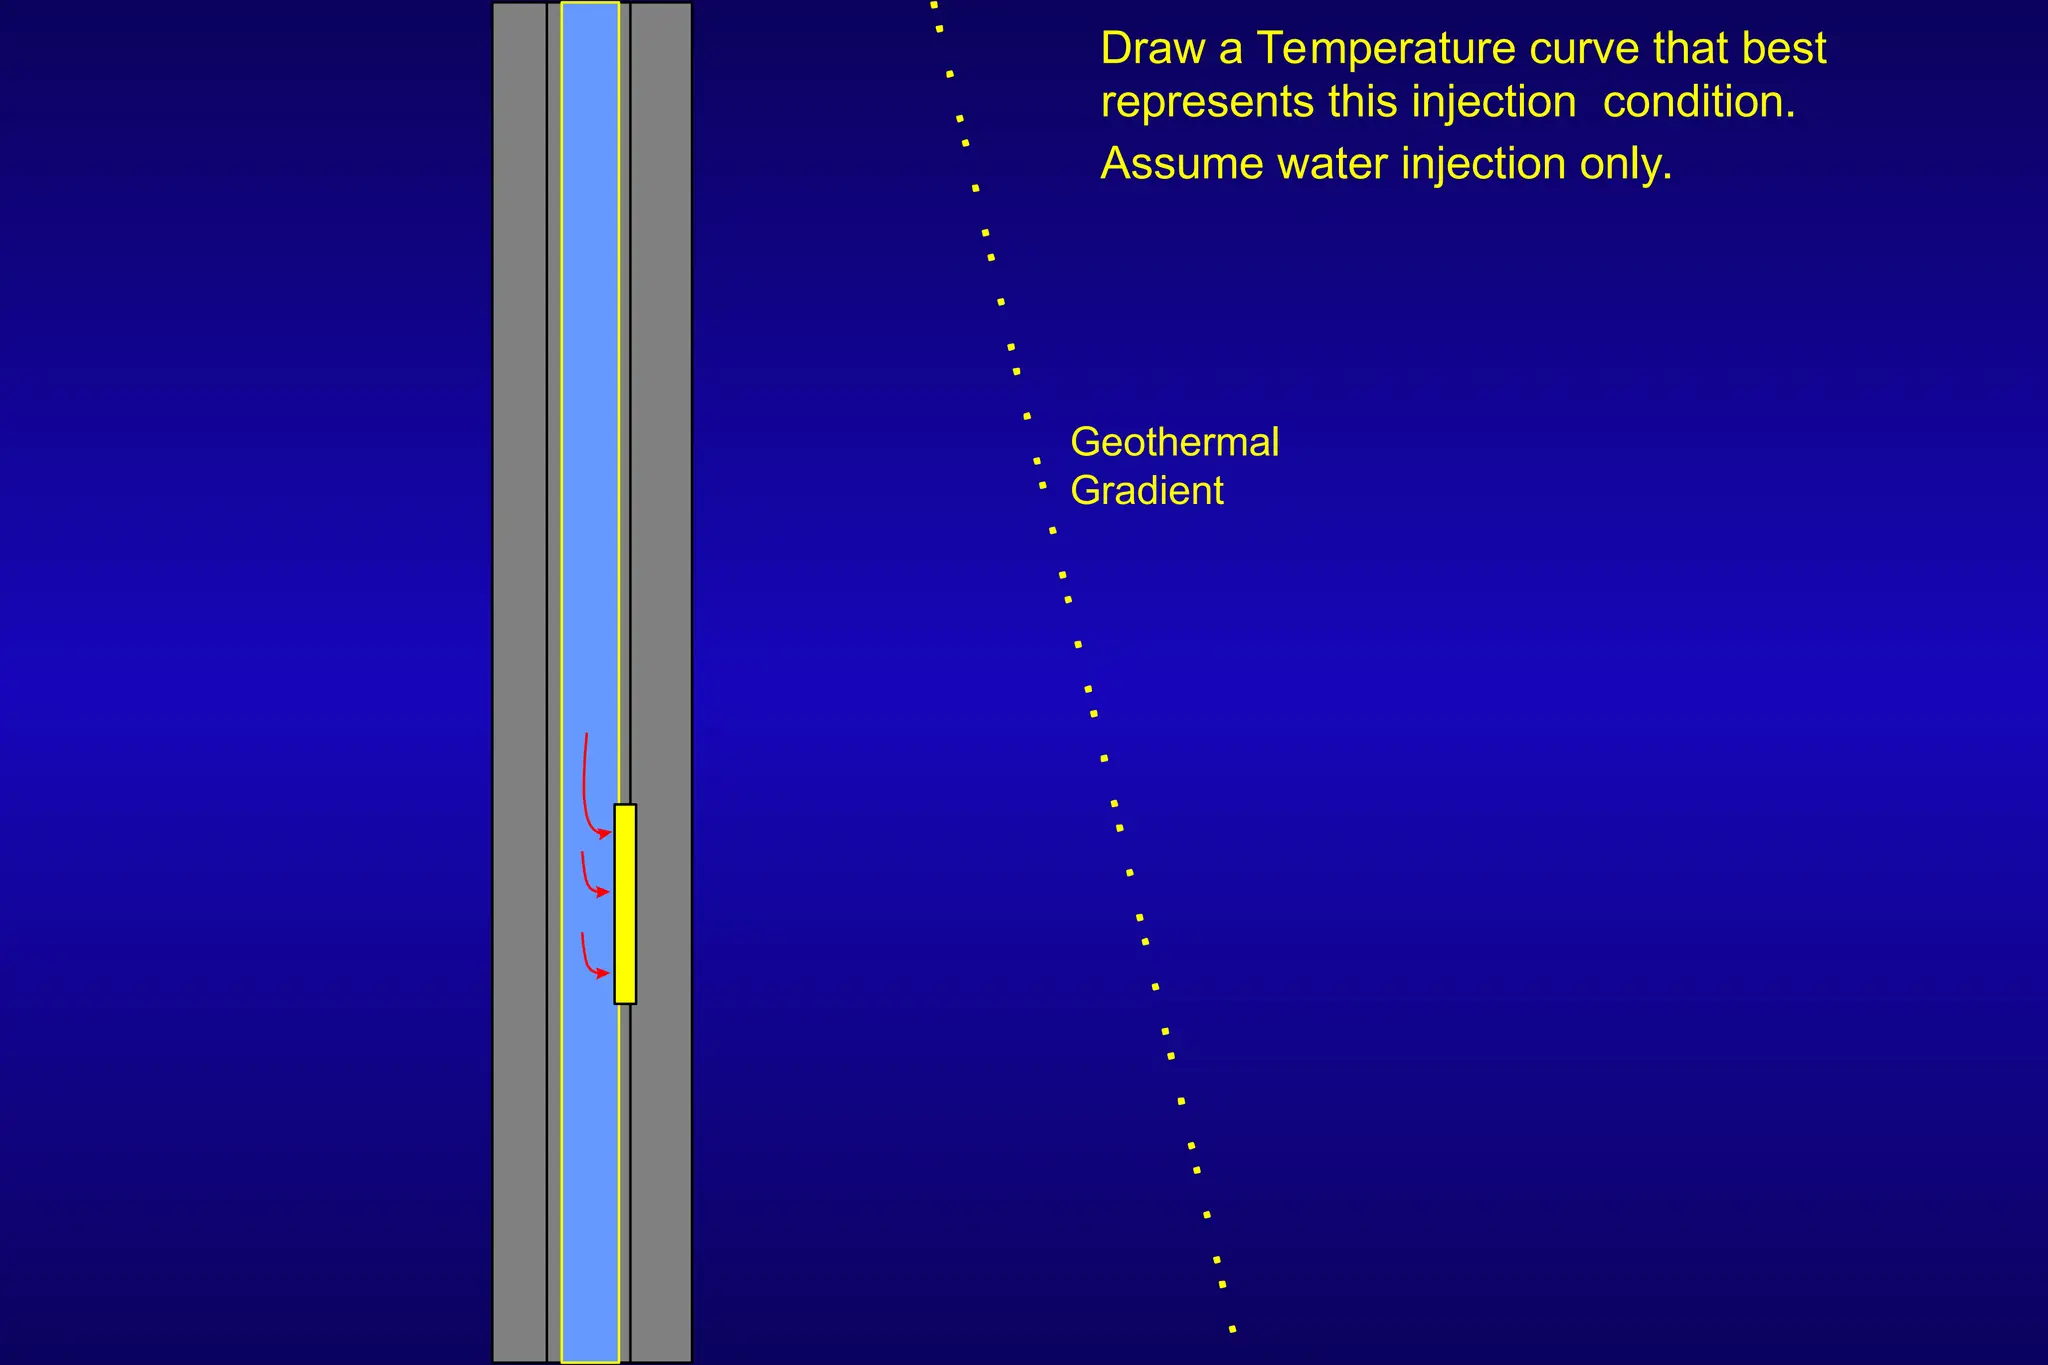
67.
Draw a Temperaturecurve that best
represents this injection condition.
Assume water injection only.
Geothermal
Gradient
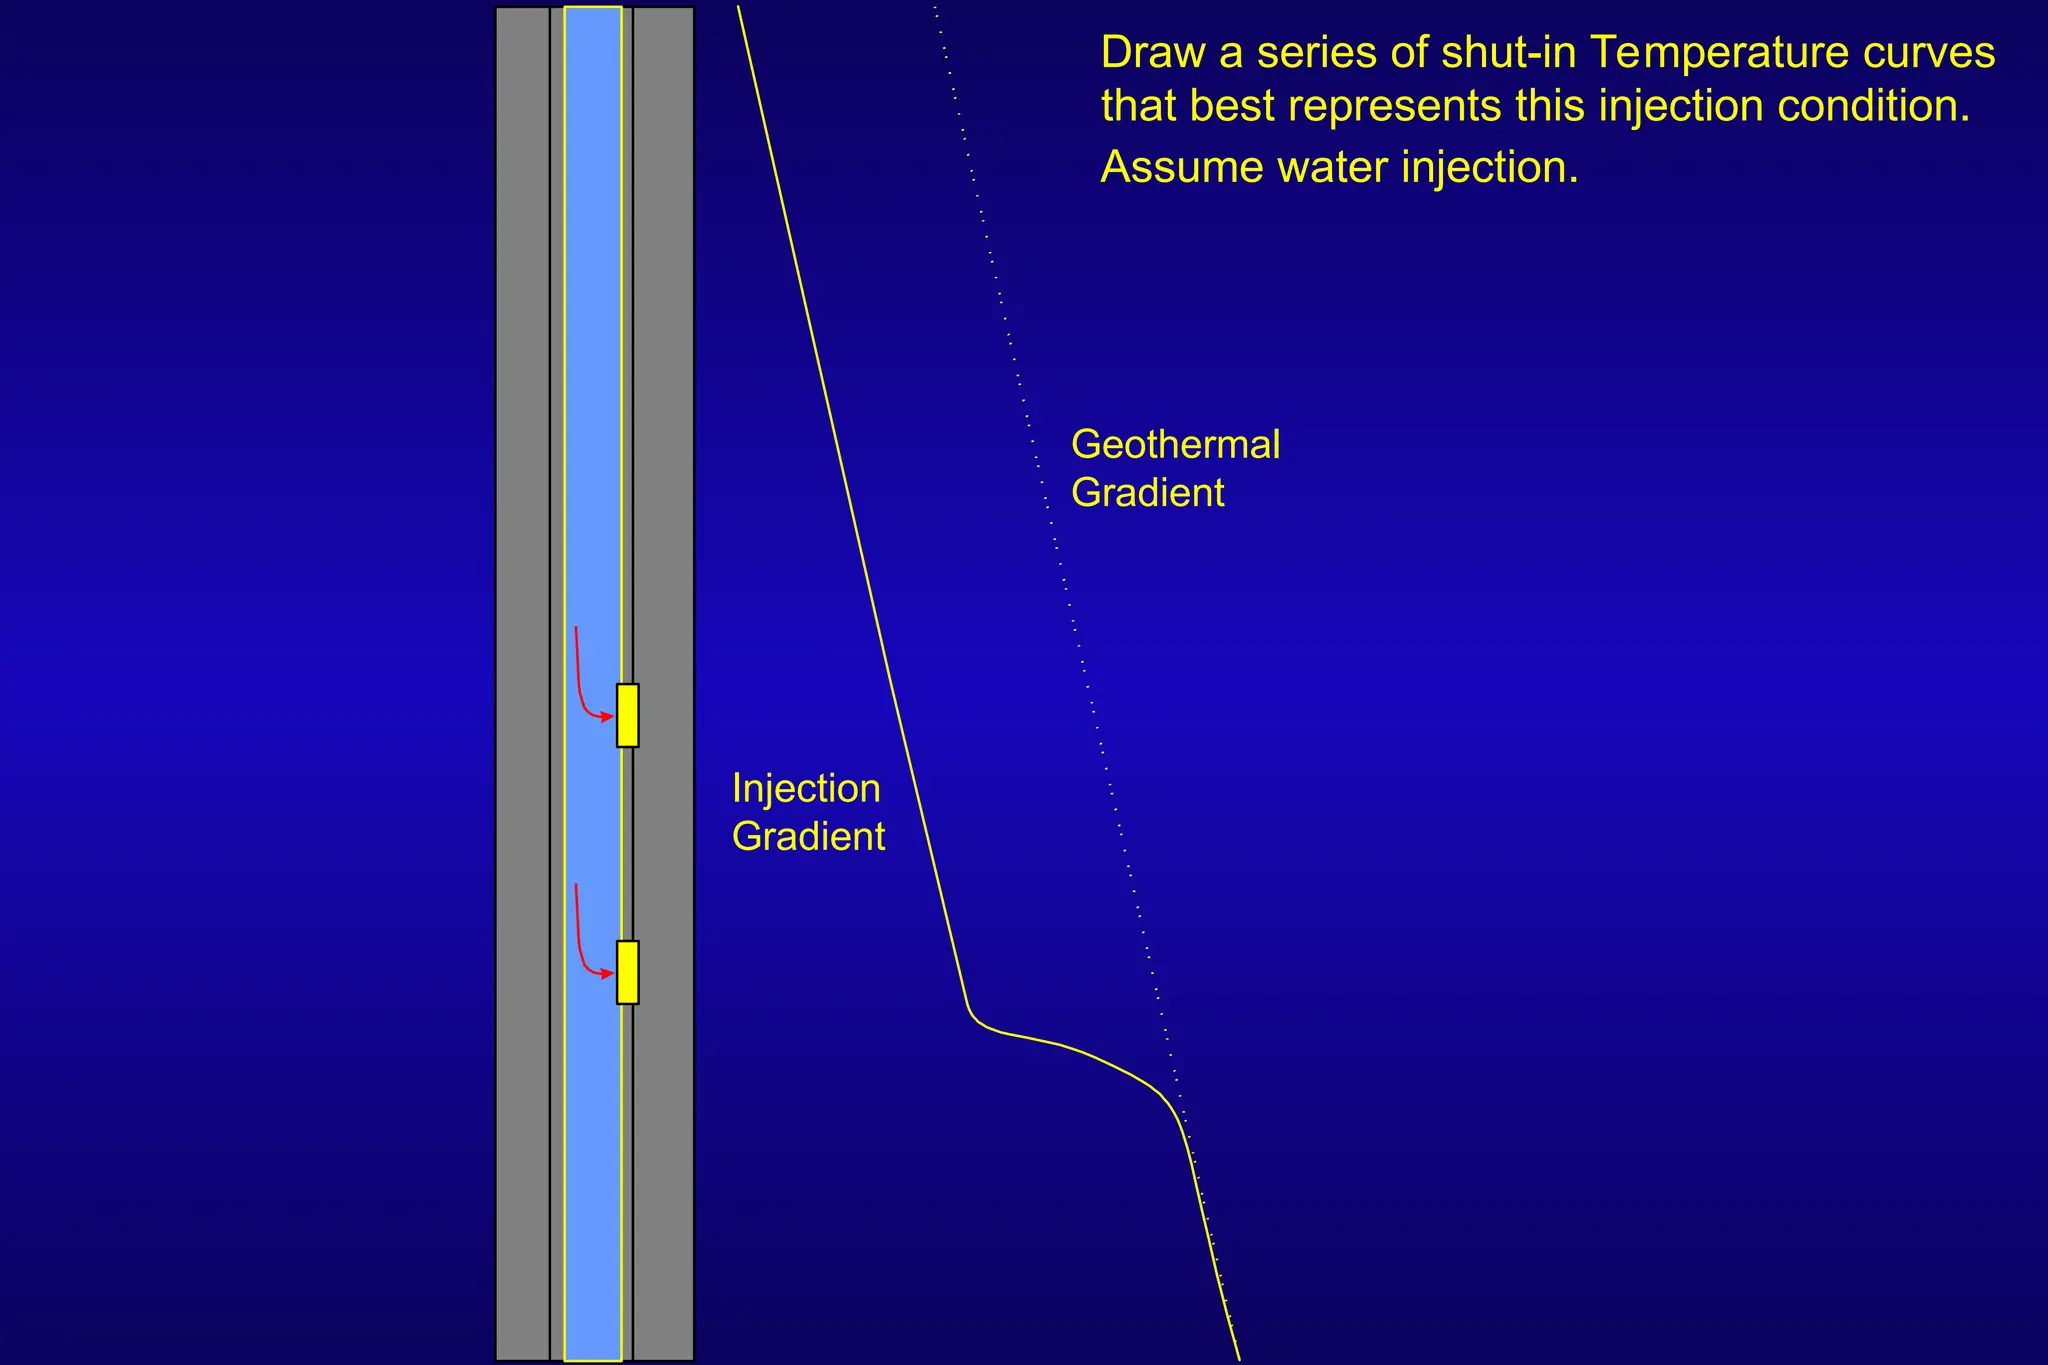
68.
Draw a seriesof shut-in Temperature curves
that best represents this injection condition.
Assume water injection.
Geothermal
Gradient
Injection
Gradient
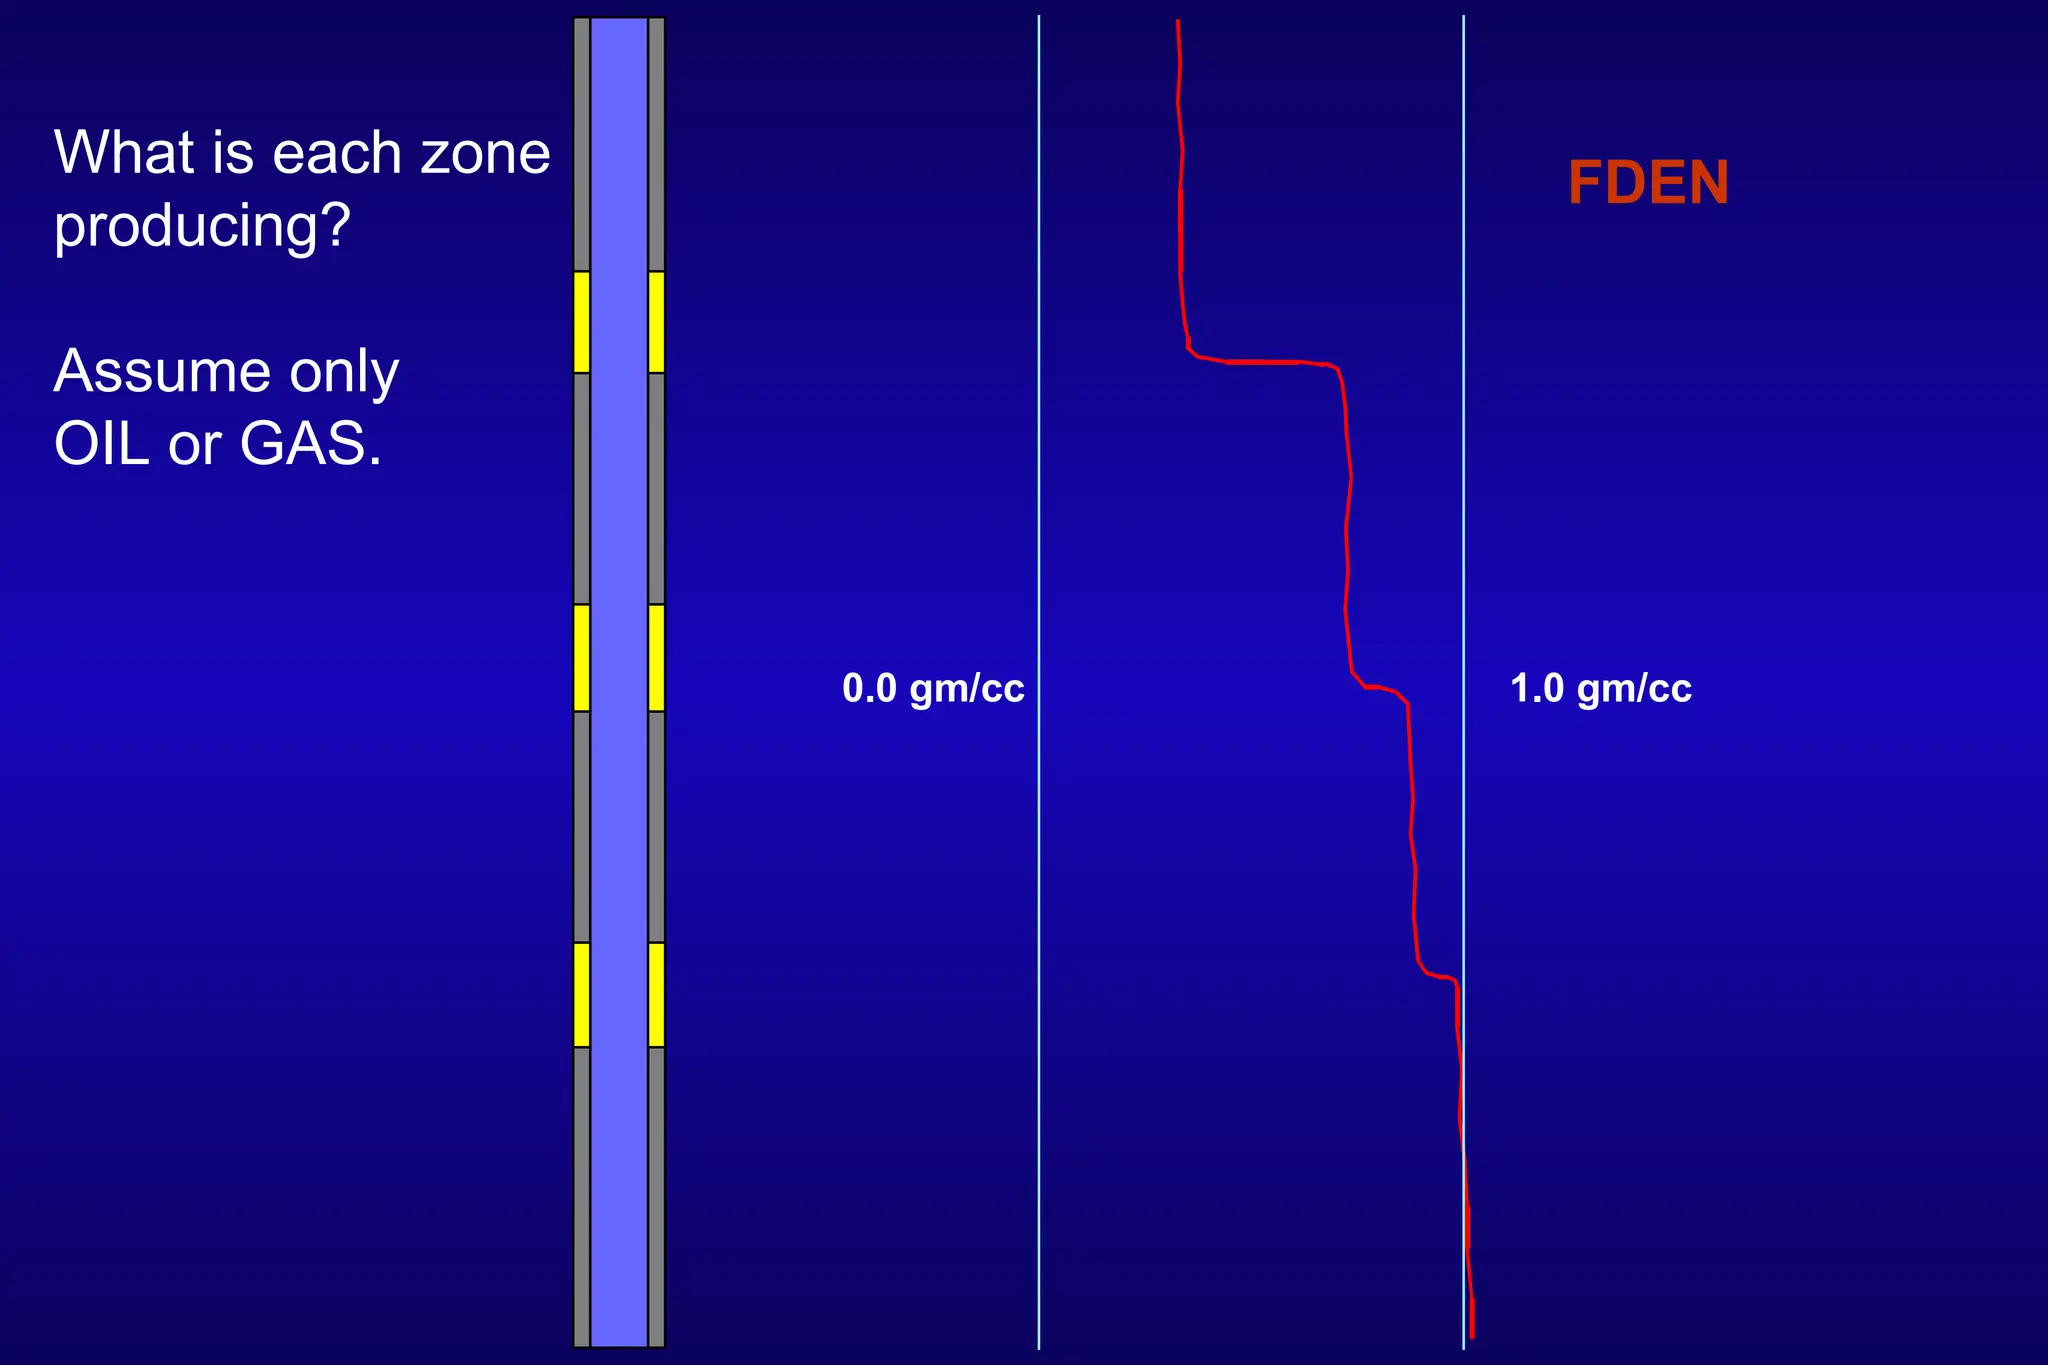
69.
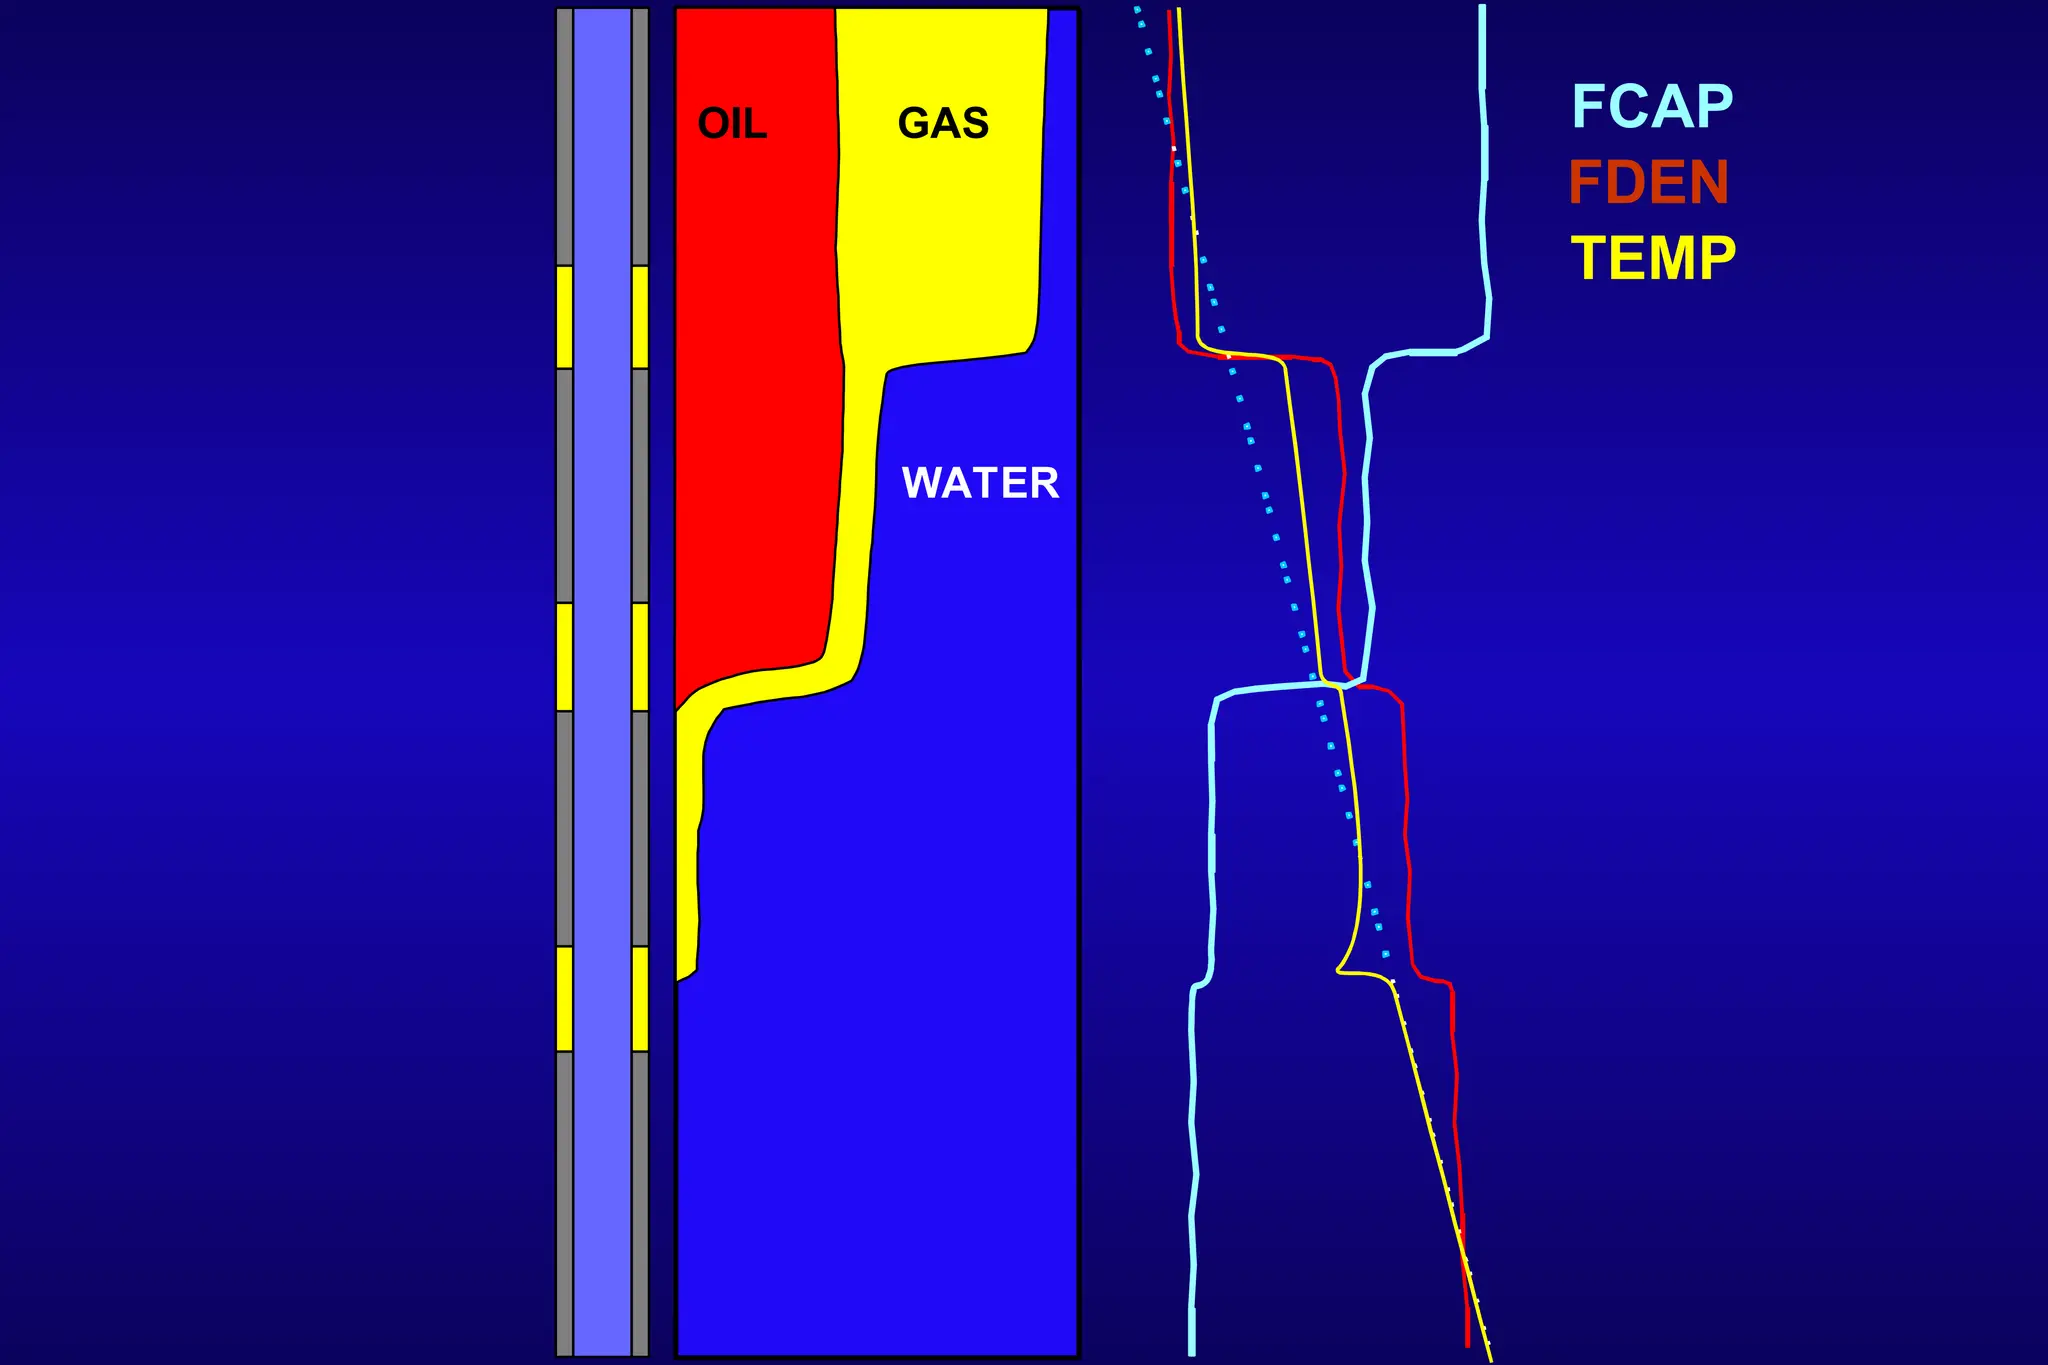
FDEN
What is eachzone
producing?
Assume only
OIL or GAS.
0.0 gm/cc 1.0 gm/cc
74
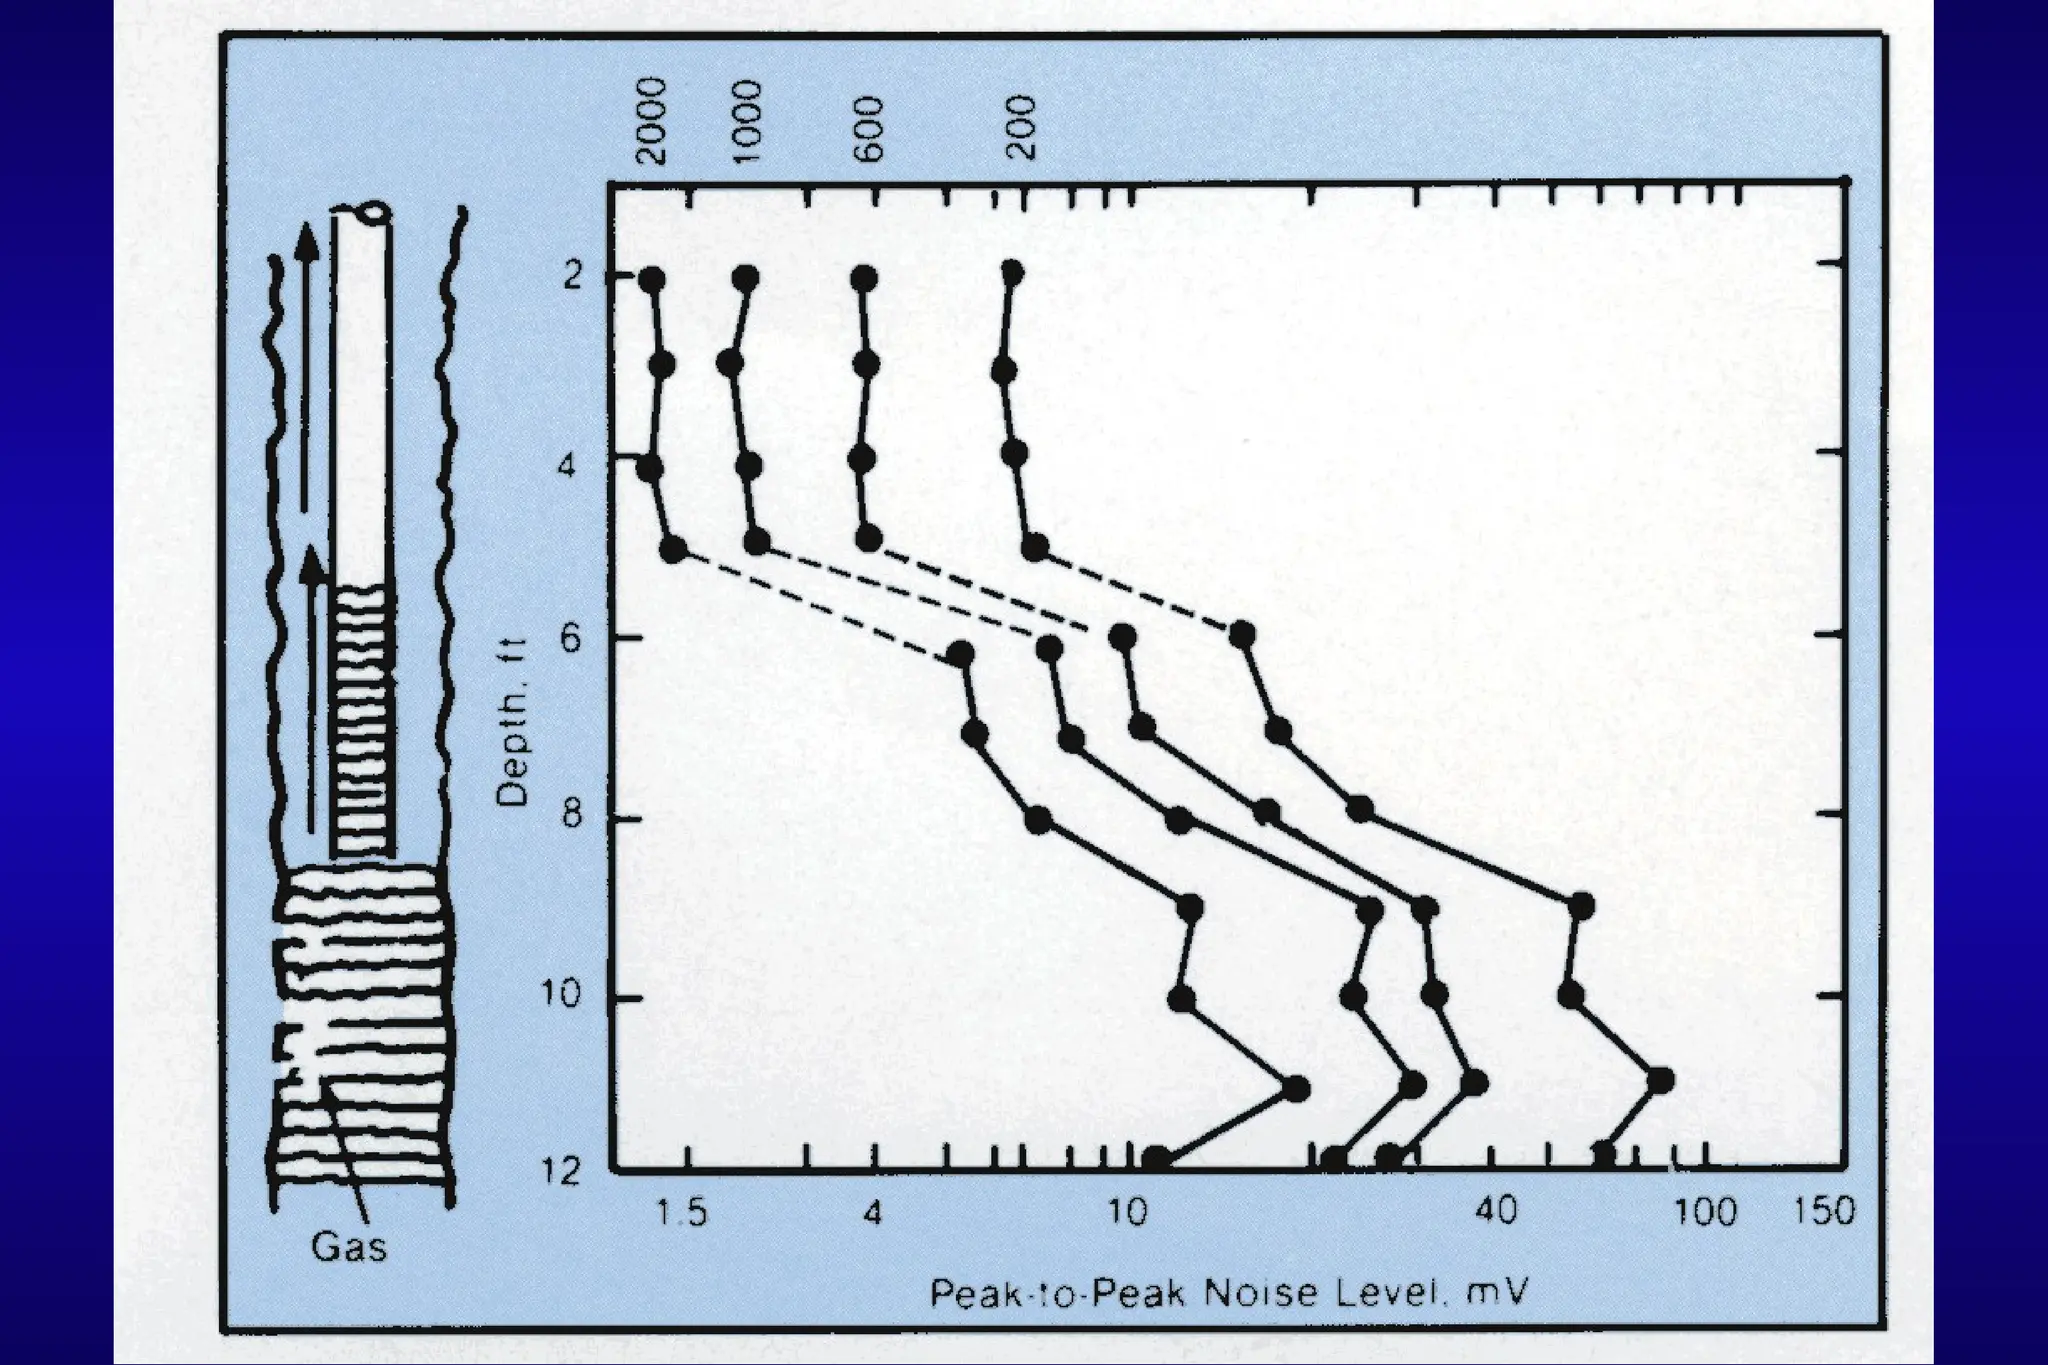
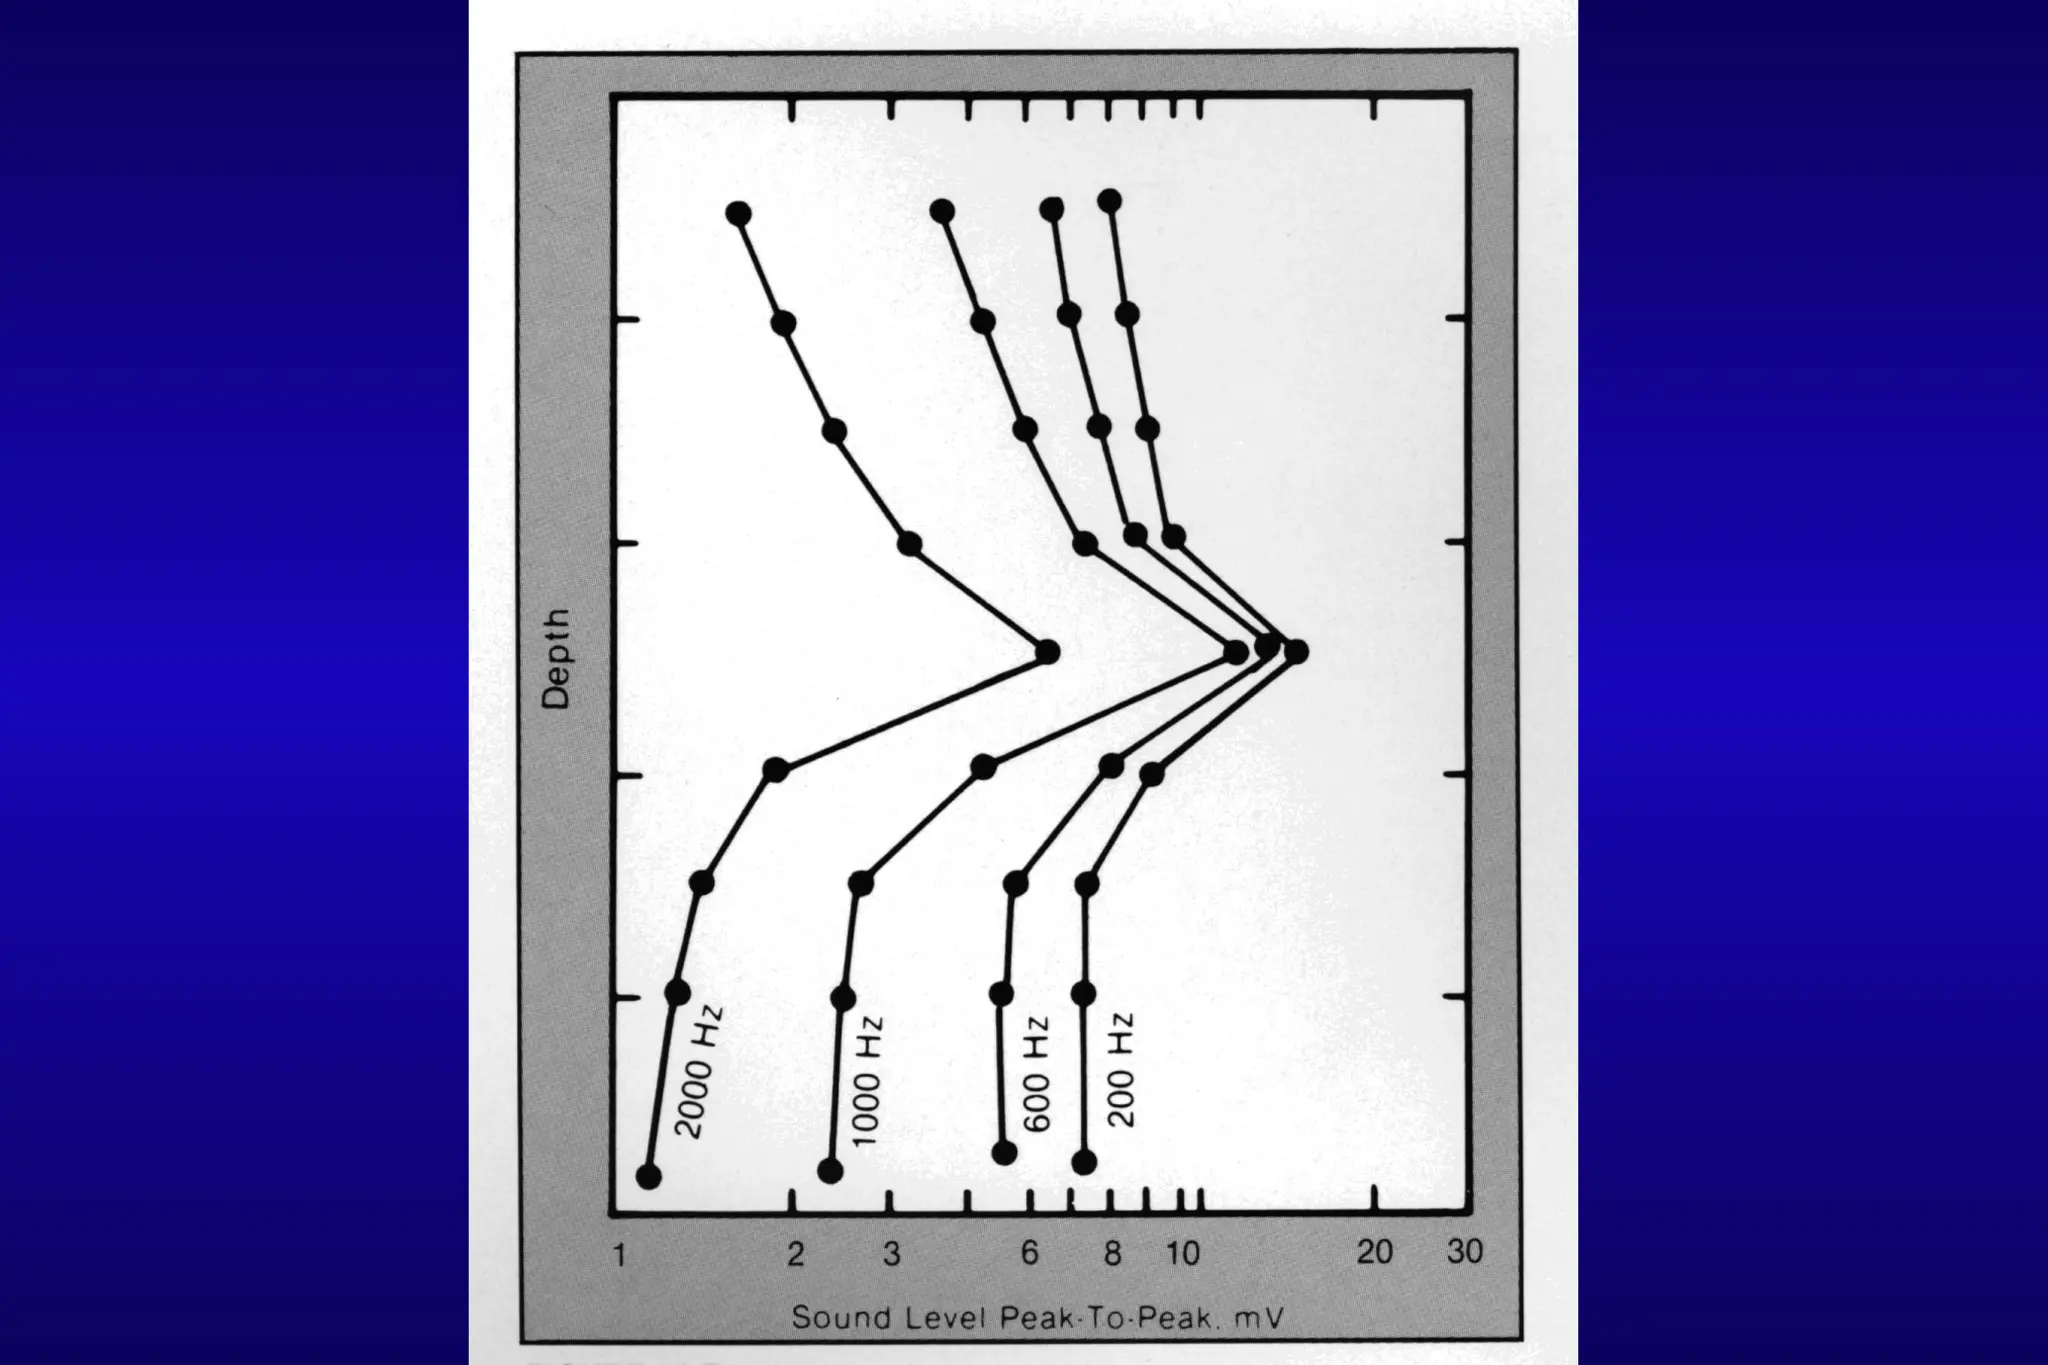
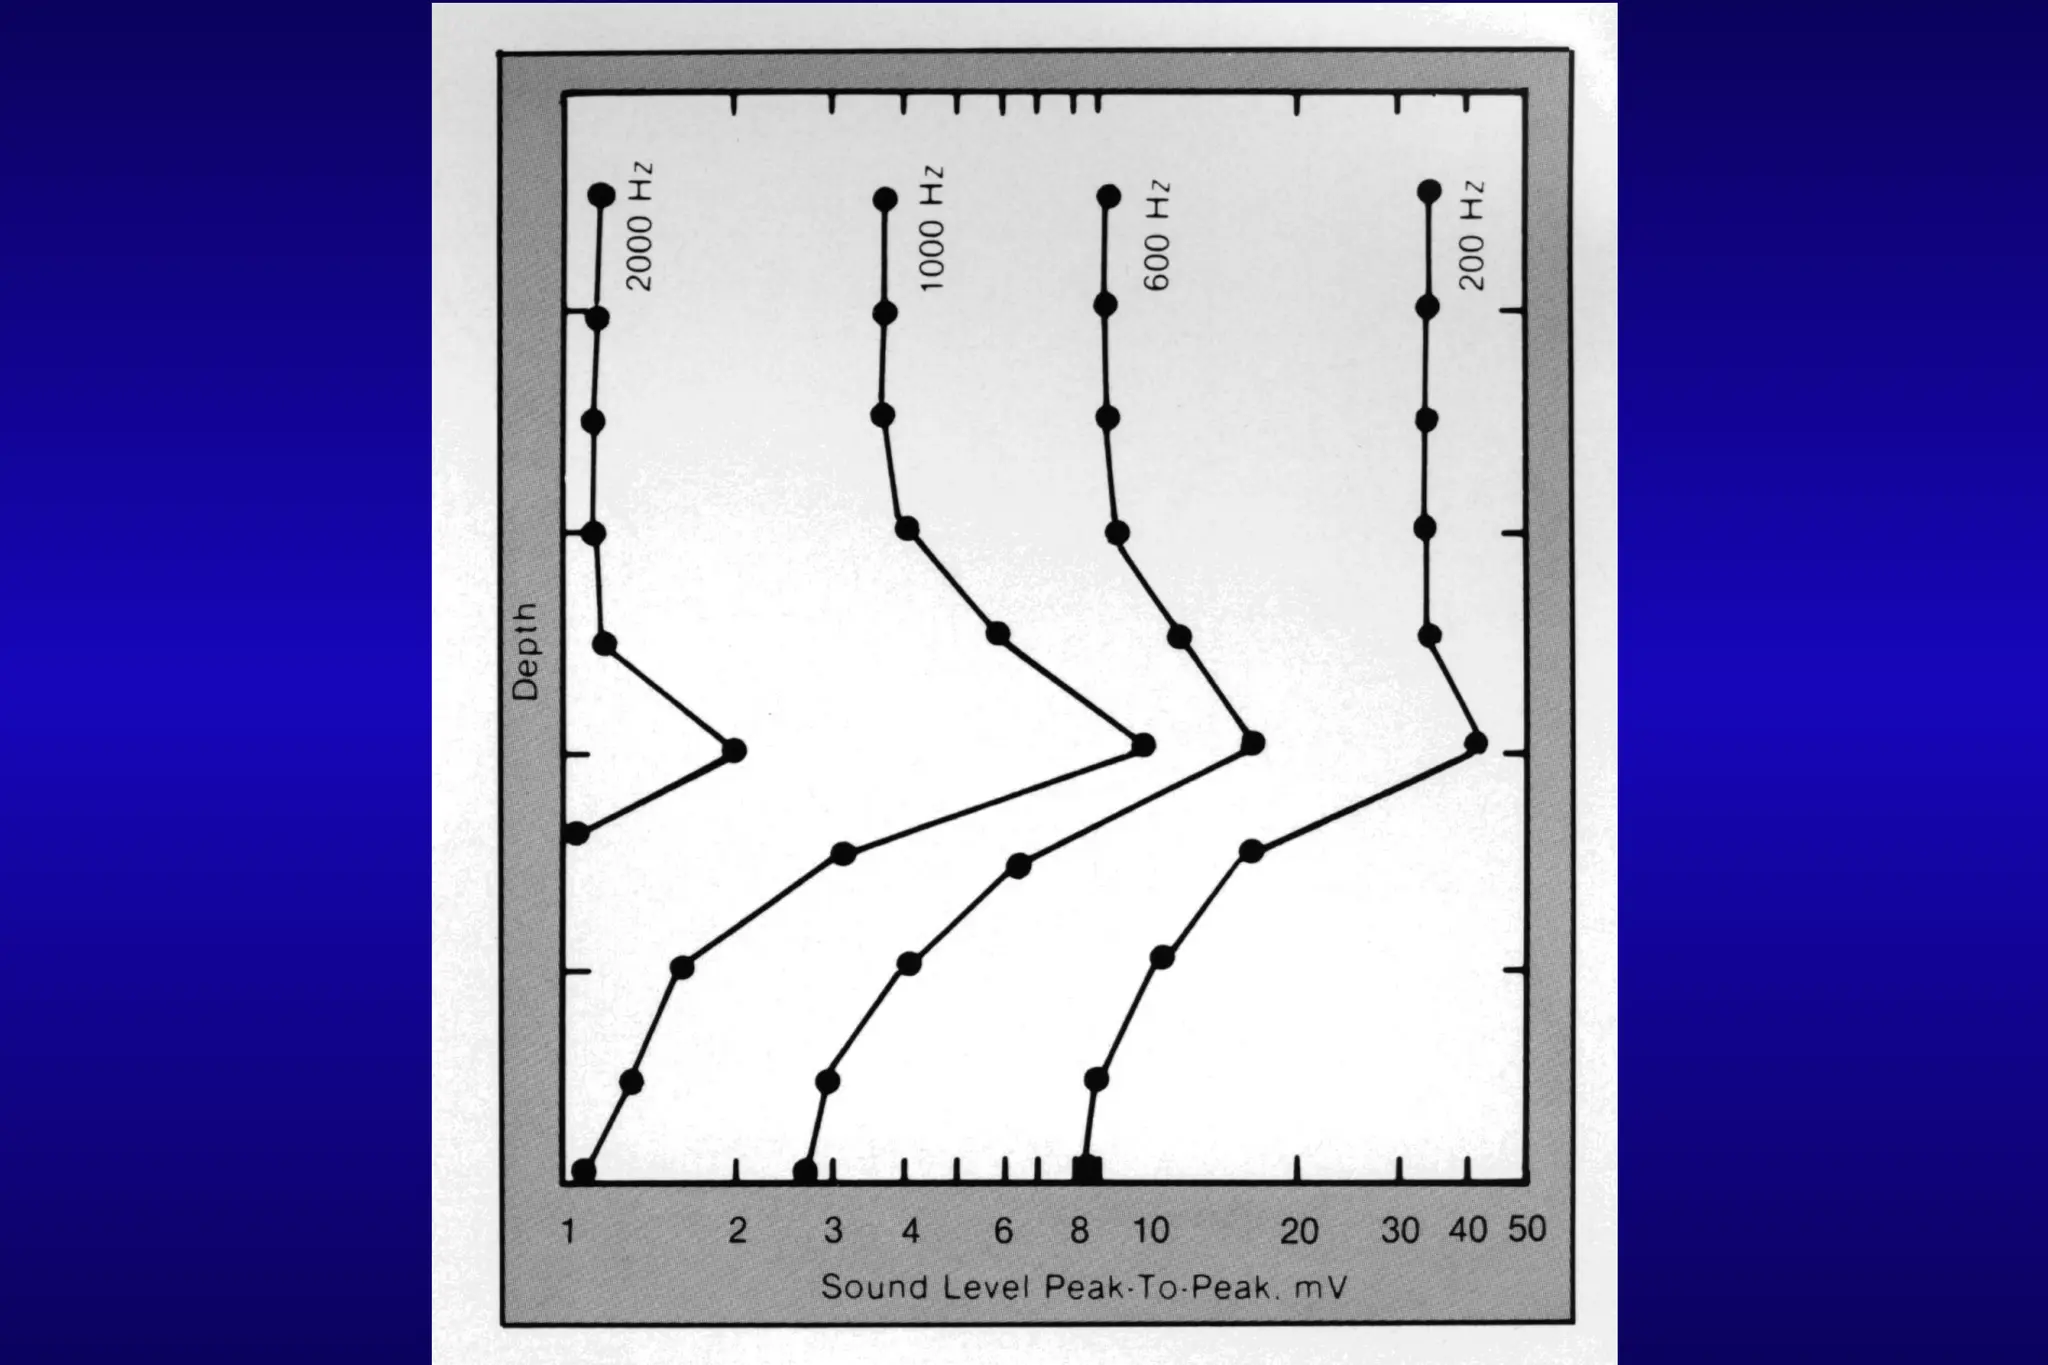
Qualitative Interpretation
Qualitative Interpretation
There are two primary things that affect the
measured sound energy.
Pressure drop dictates the source sound level
Attenuation decrease the source sound level as
the sound travels through surrounding medium to
the microphone.
Sound attenuates more in gas than in liquid.
High acoustic impedance contrasts reflect the sound
signals reducing the transmission of the sound energy.
78.
79
Tracer Flo-Log Applications
TracerFlo-Log Applications
Injection and Production Profiles
Detect channels
Locate leaks -- Plug, tubing, etc
Detect casing and squeeze cement failures
Locate lost circulation zones
79.
80
Measurement Principles
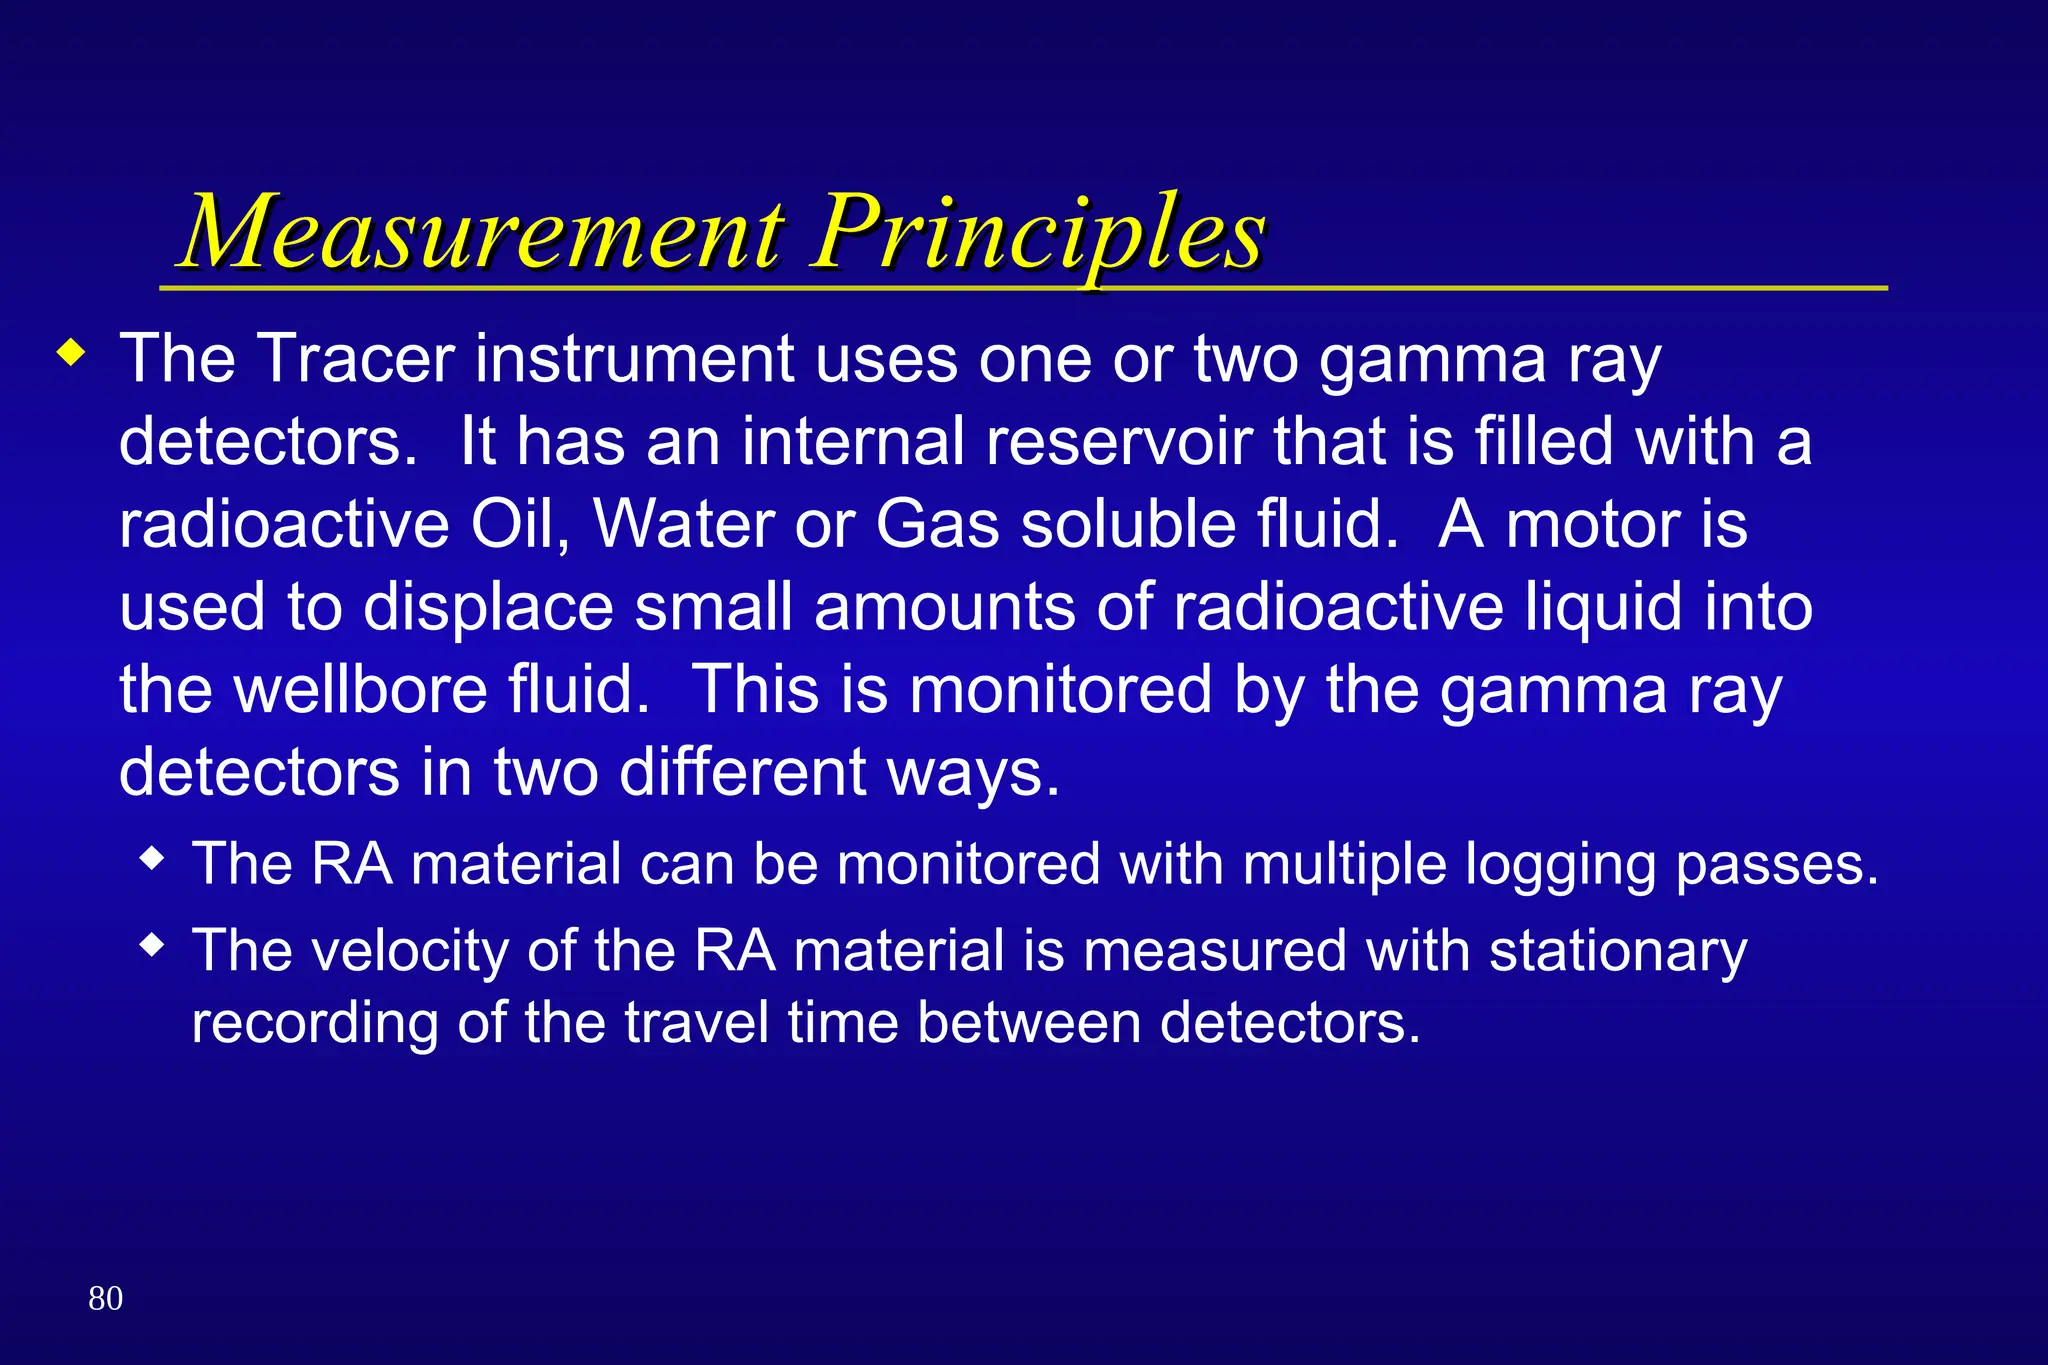
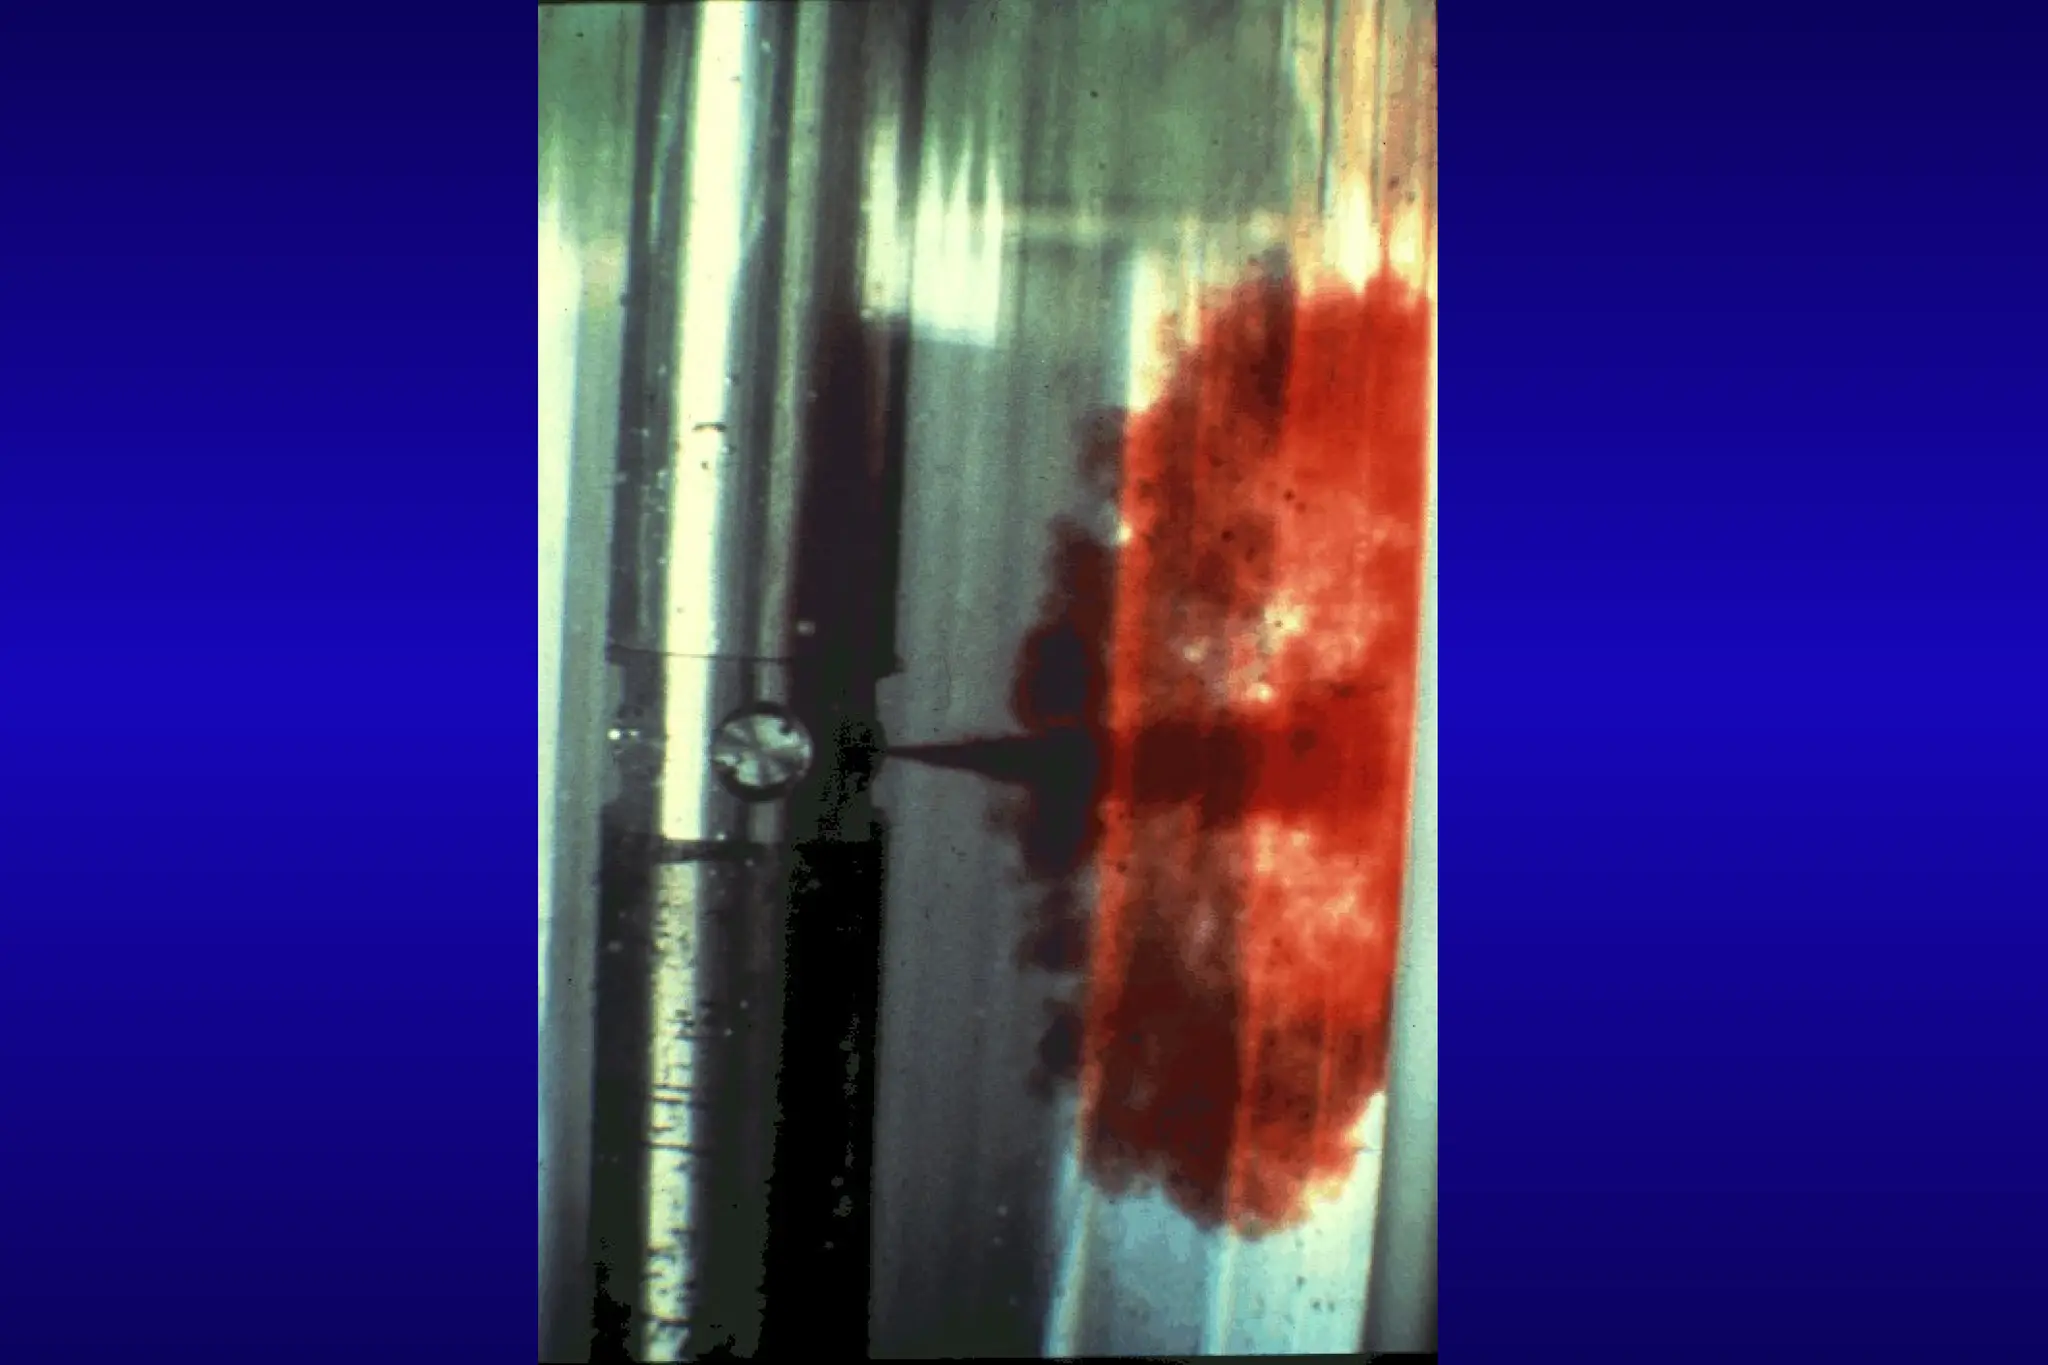
Measurement Principles
The Tracer instrument uses one or two gamma ray
detectors. It has an internal reservoir that is filled with a
radioactive Oil, Water or Gas soluble fluid. A motor is
used to displace small amounts of radioactive liquid into
the wellbore fluid. This is monitored by the gamma ray
detectors in two different ways.
The RA material can be monitored with multiple logging passes.
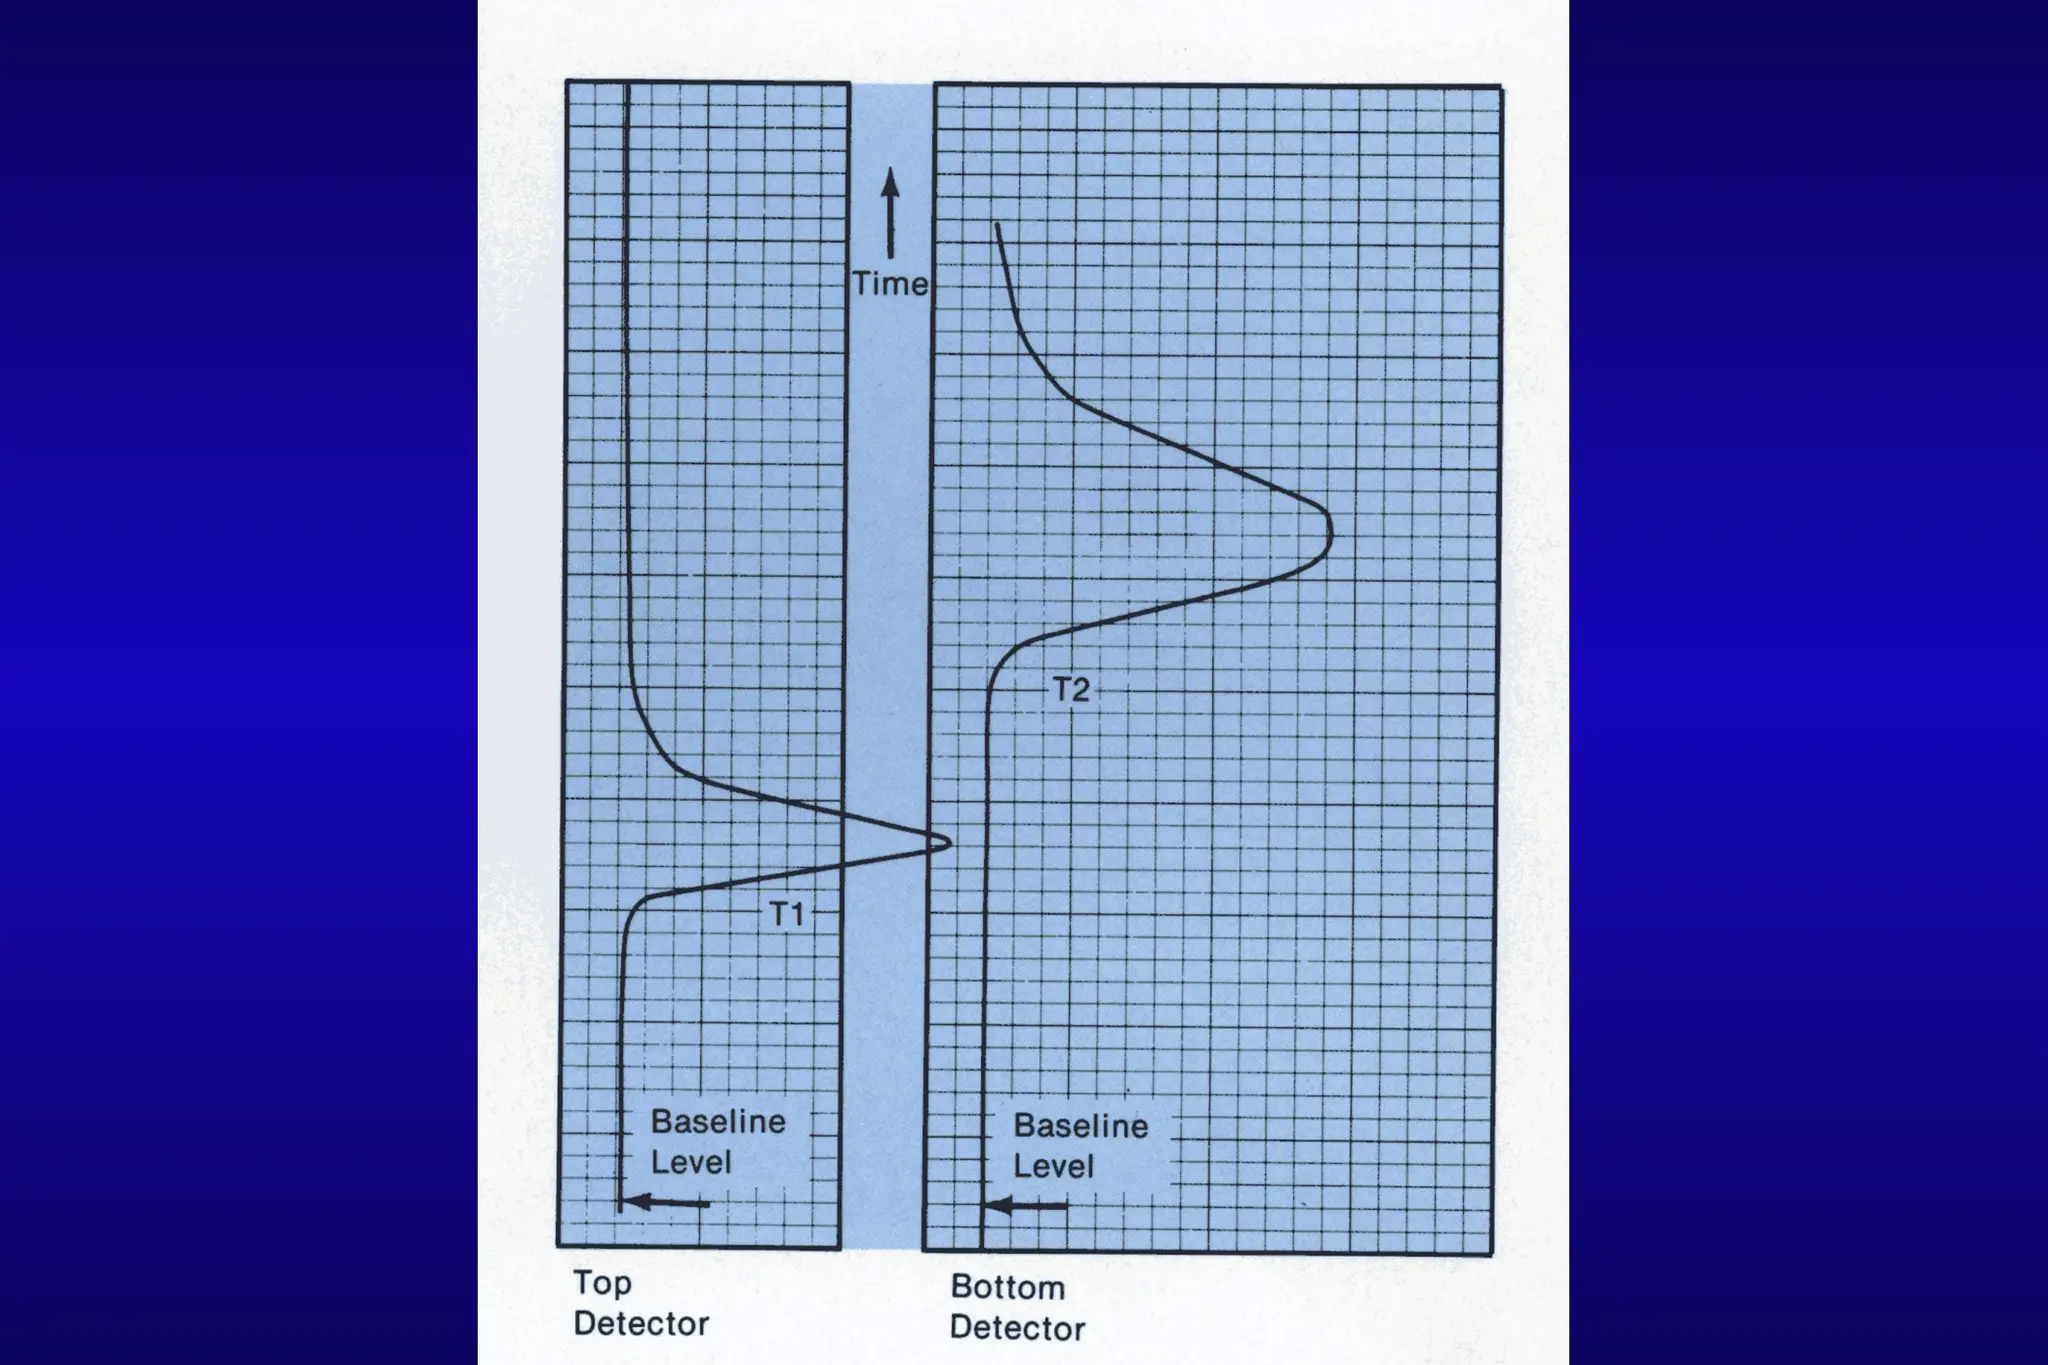
The velocity of the RA material is measured with stationary
recording of the travel time between detectors.
84
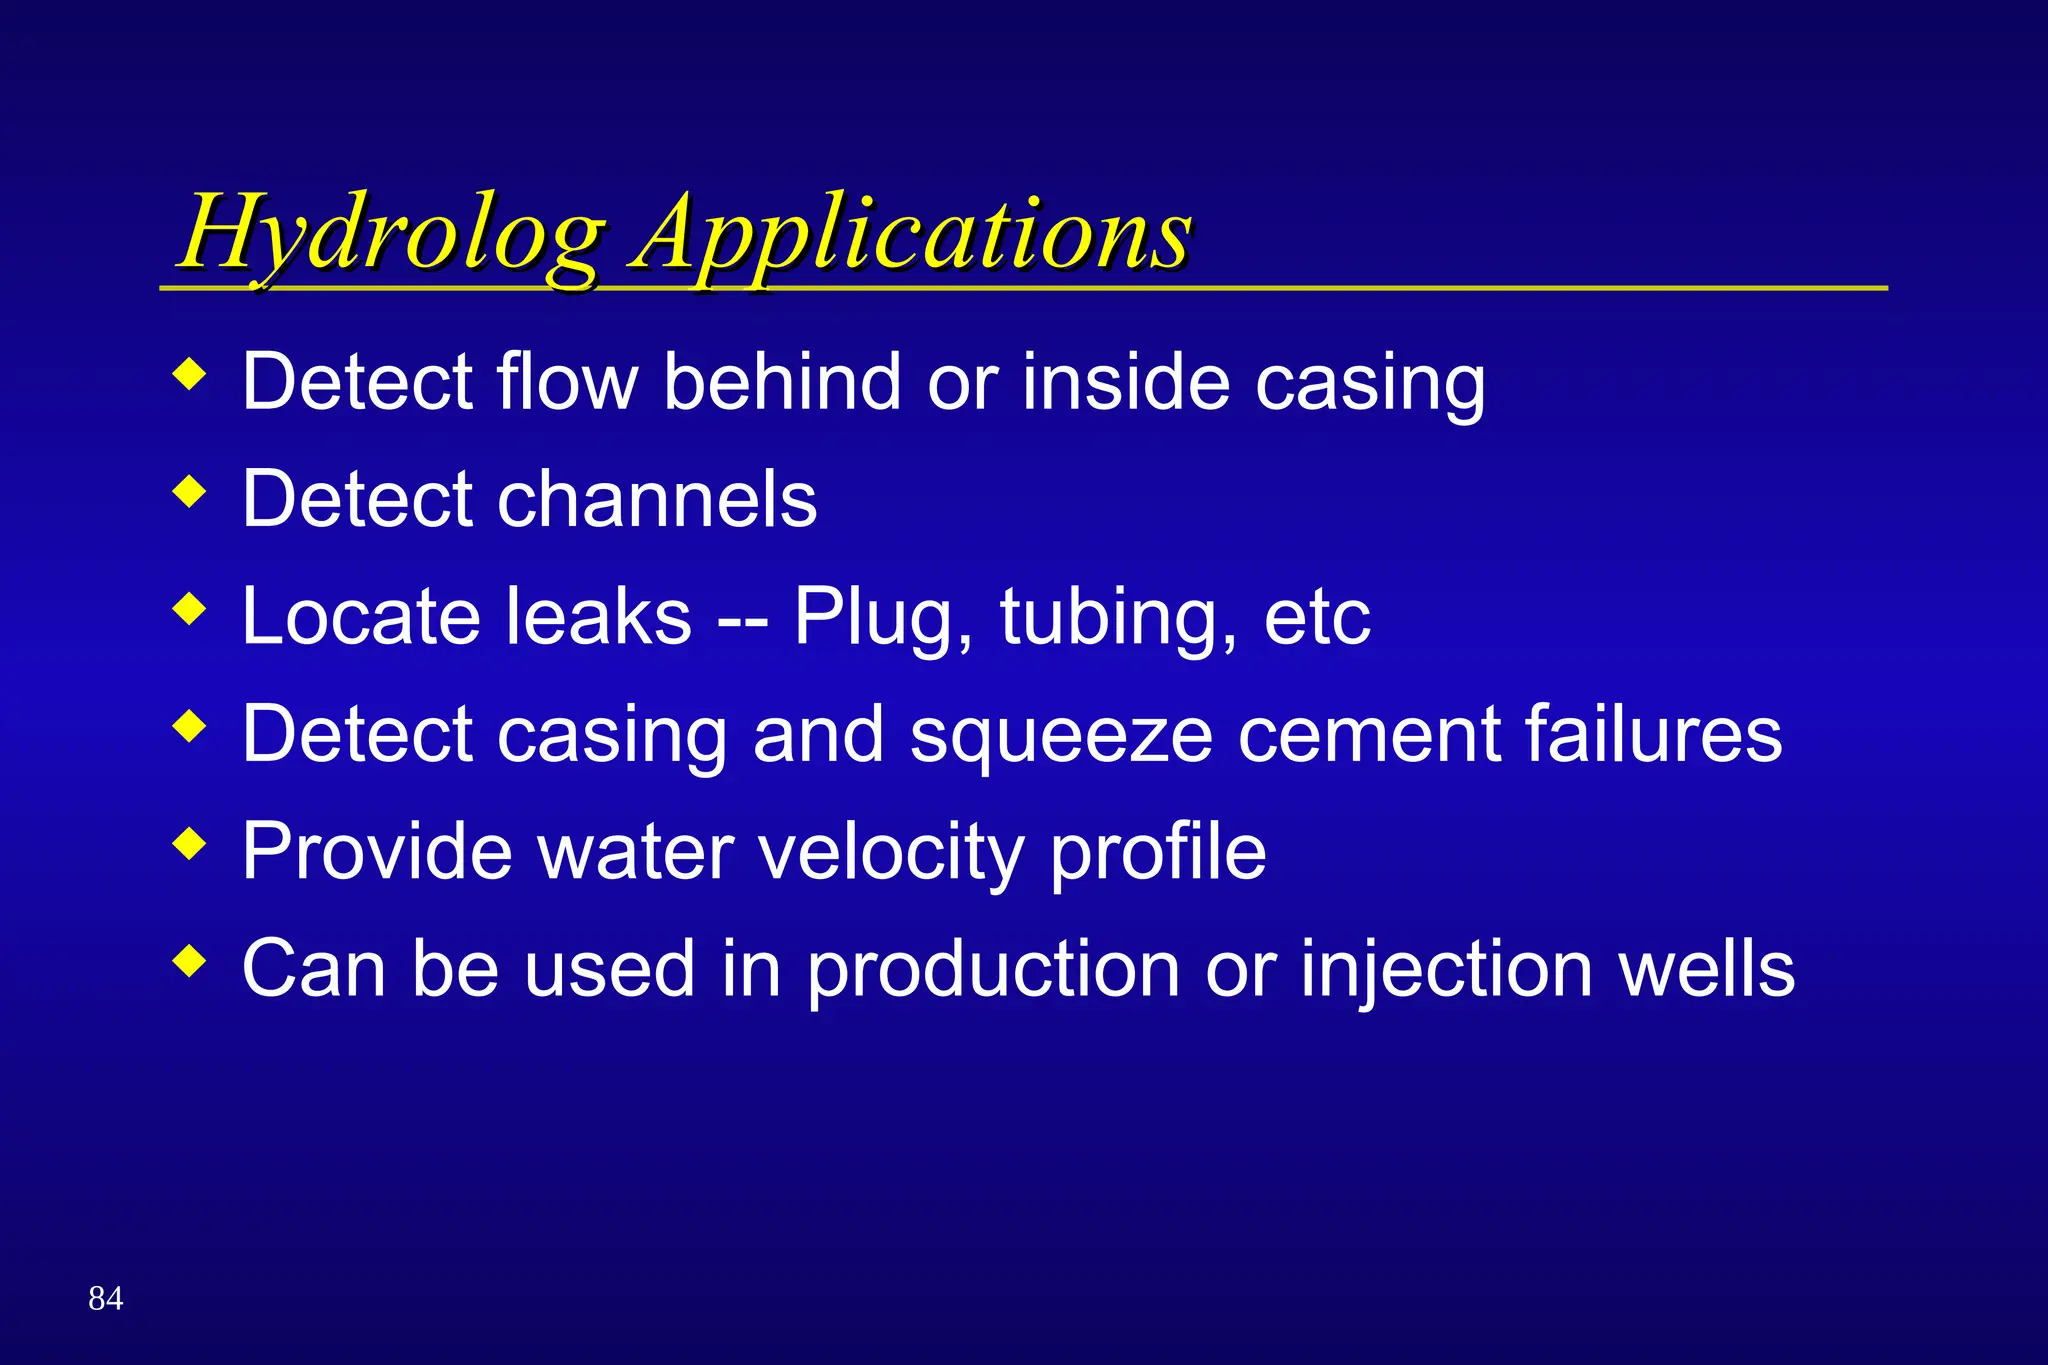
Hydrolog Applications
Hydrolog Applications
Detect flow behind or inside casing
Detect channels
Locate leaks -- Plug, tubing, etc
Detect casing and squeeze cement failures
Provide water velocity profile
Can be used in production or injection wells
84.
85
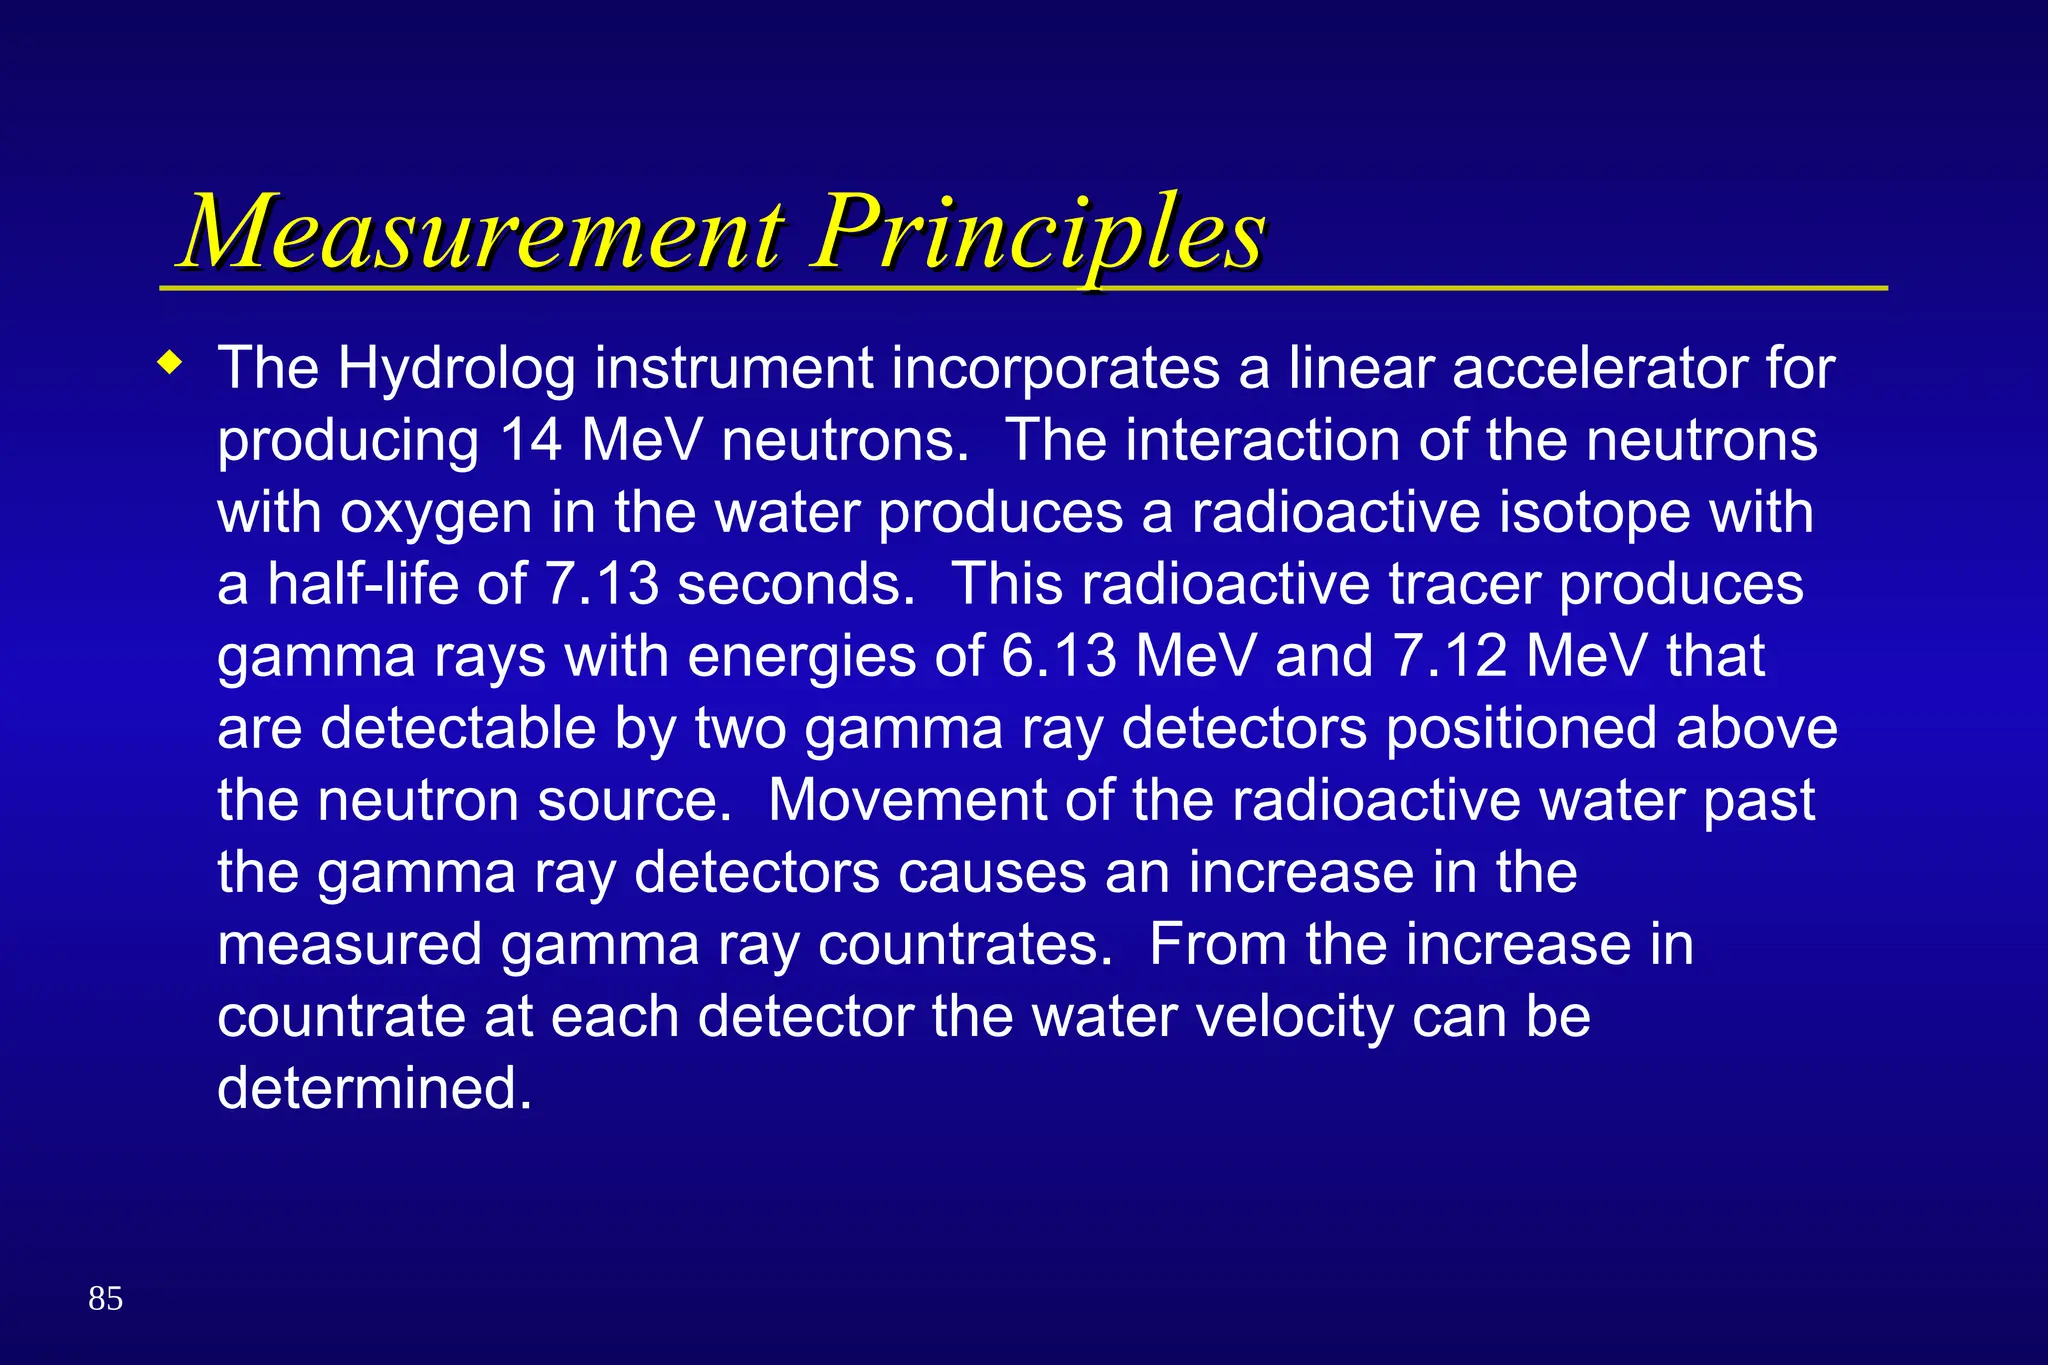
Measurement Principles
Measurement Principles
The Hydrolog instrument incorporates a linear accelerator for
producing 14 MeV neutrons. The interaction of the neutrons
with oxygen in the water produces a radioactive isotope with
a half-life of 7.13 seconds. This radioactive tracer produces
gamma rays with energies of 6.13 MeV and 7.12 MeV that
are detectable by two gamma ray detectors positioned above
the neutron source. Movement of the radioactive water past
the gamma ray detectors causes an increase in the
measured gamma ray countrates. From the increase in
countrate at each detector the water velocity can be
determined.
85.
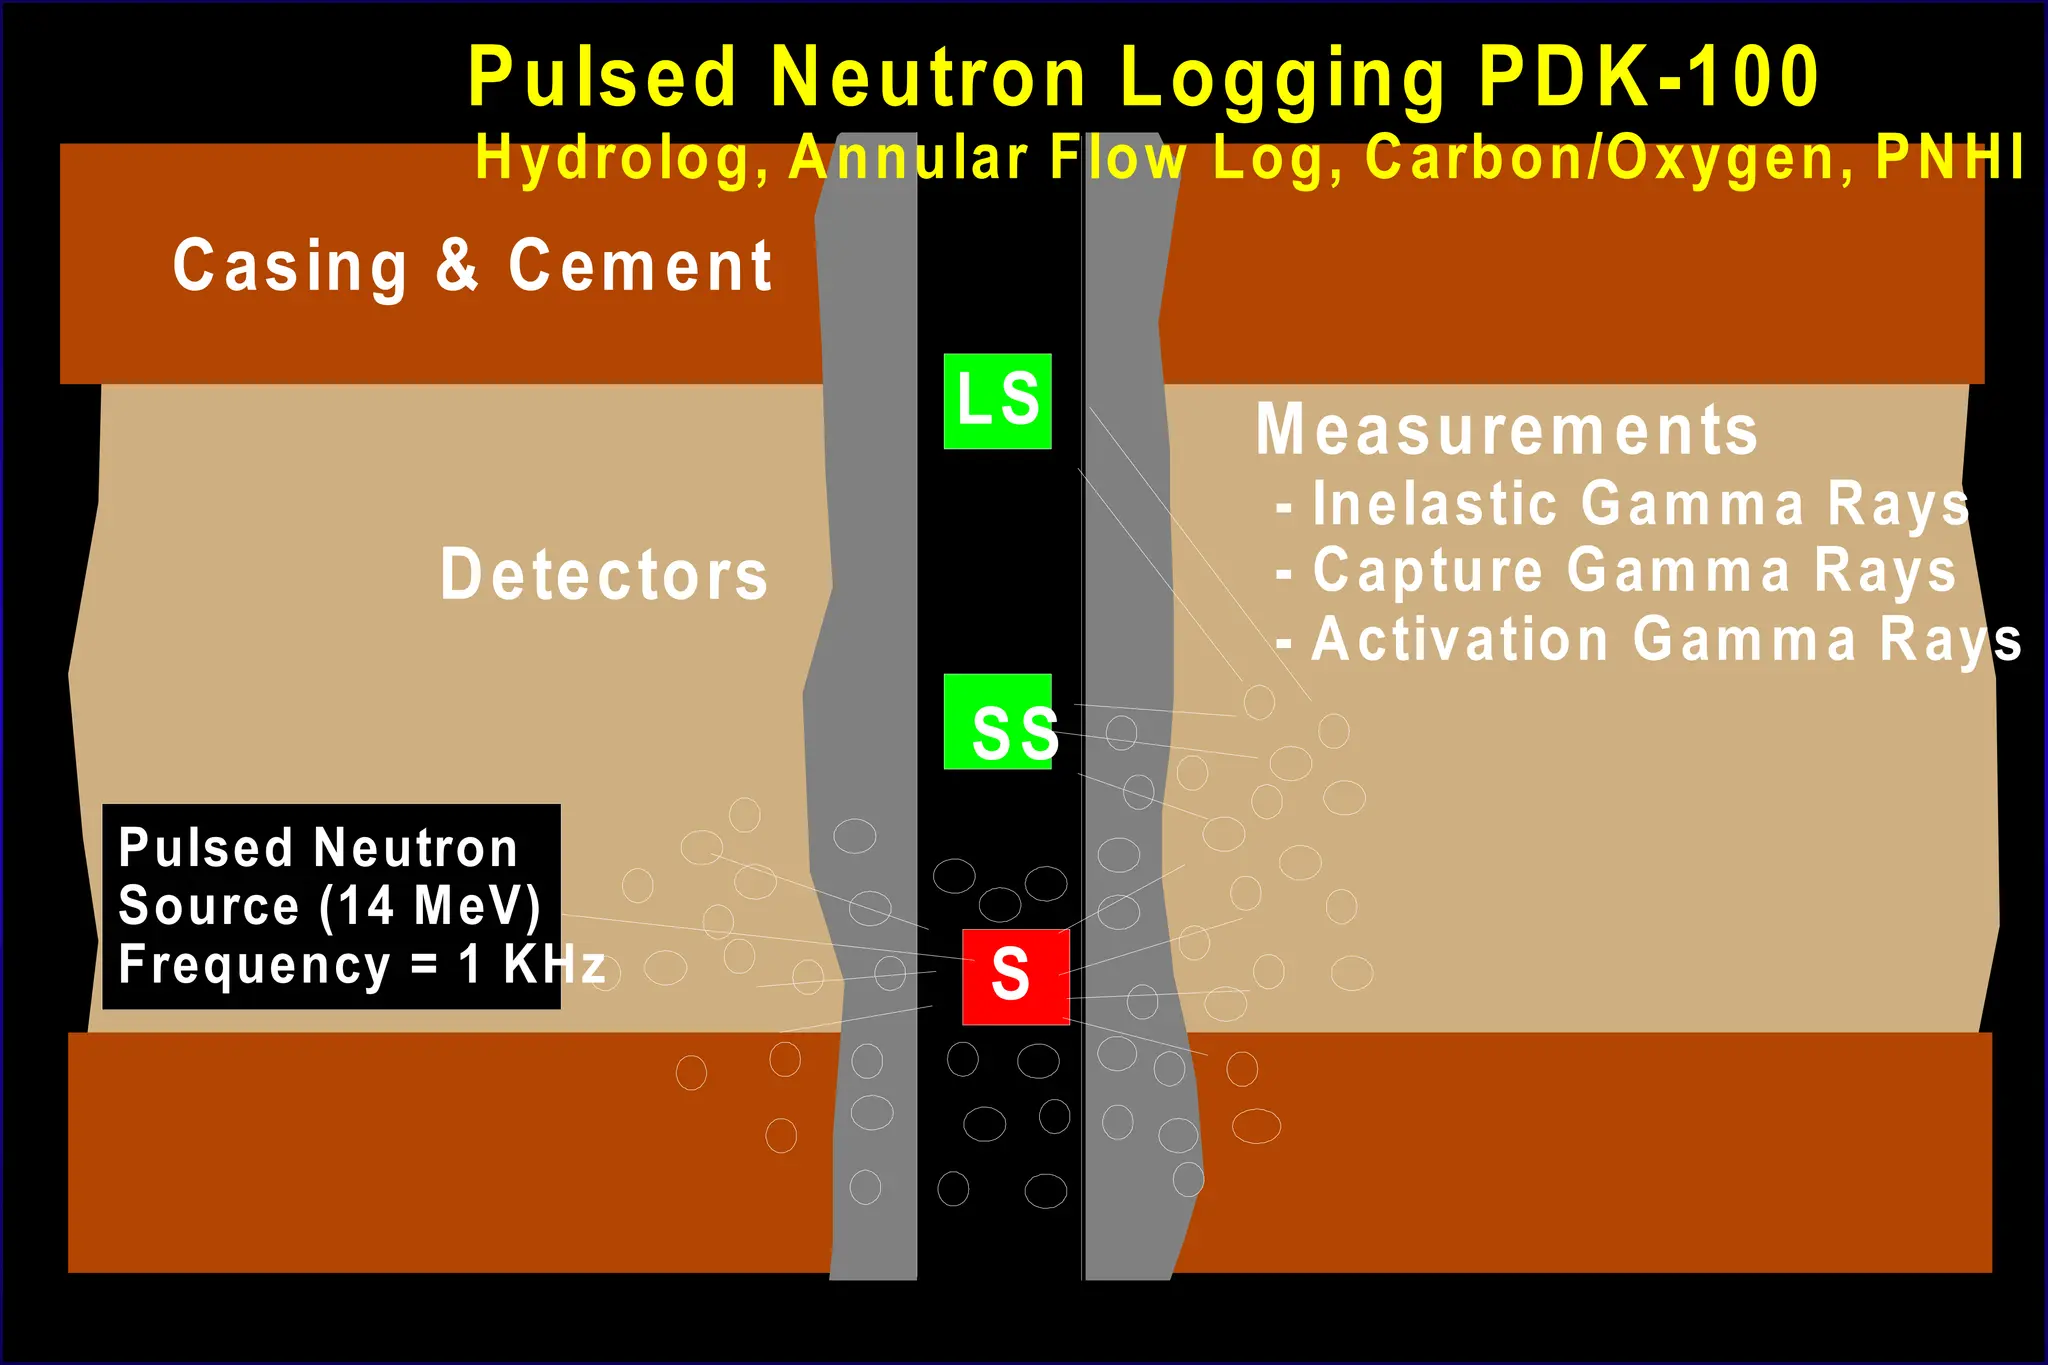
Detectors
Casing & Cement
Measurements
-Inelastic Gamma Rays
- Capture Gamma Rays
- Activation Gamma Rays
LS
S
SS
Pulsed Neutron
Source (14 MeV)
Frequency = 1 KHz
Pulsed Neutron Logging PDK-100
Hydrolog, Annular Flow Log, Carbon/Oxygen, PNHI
86.
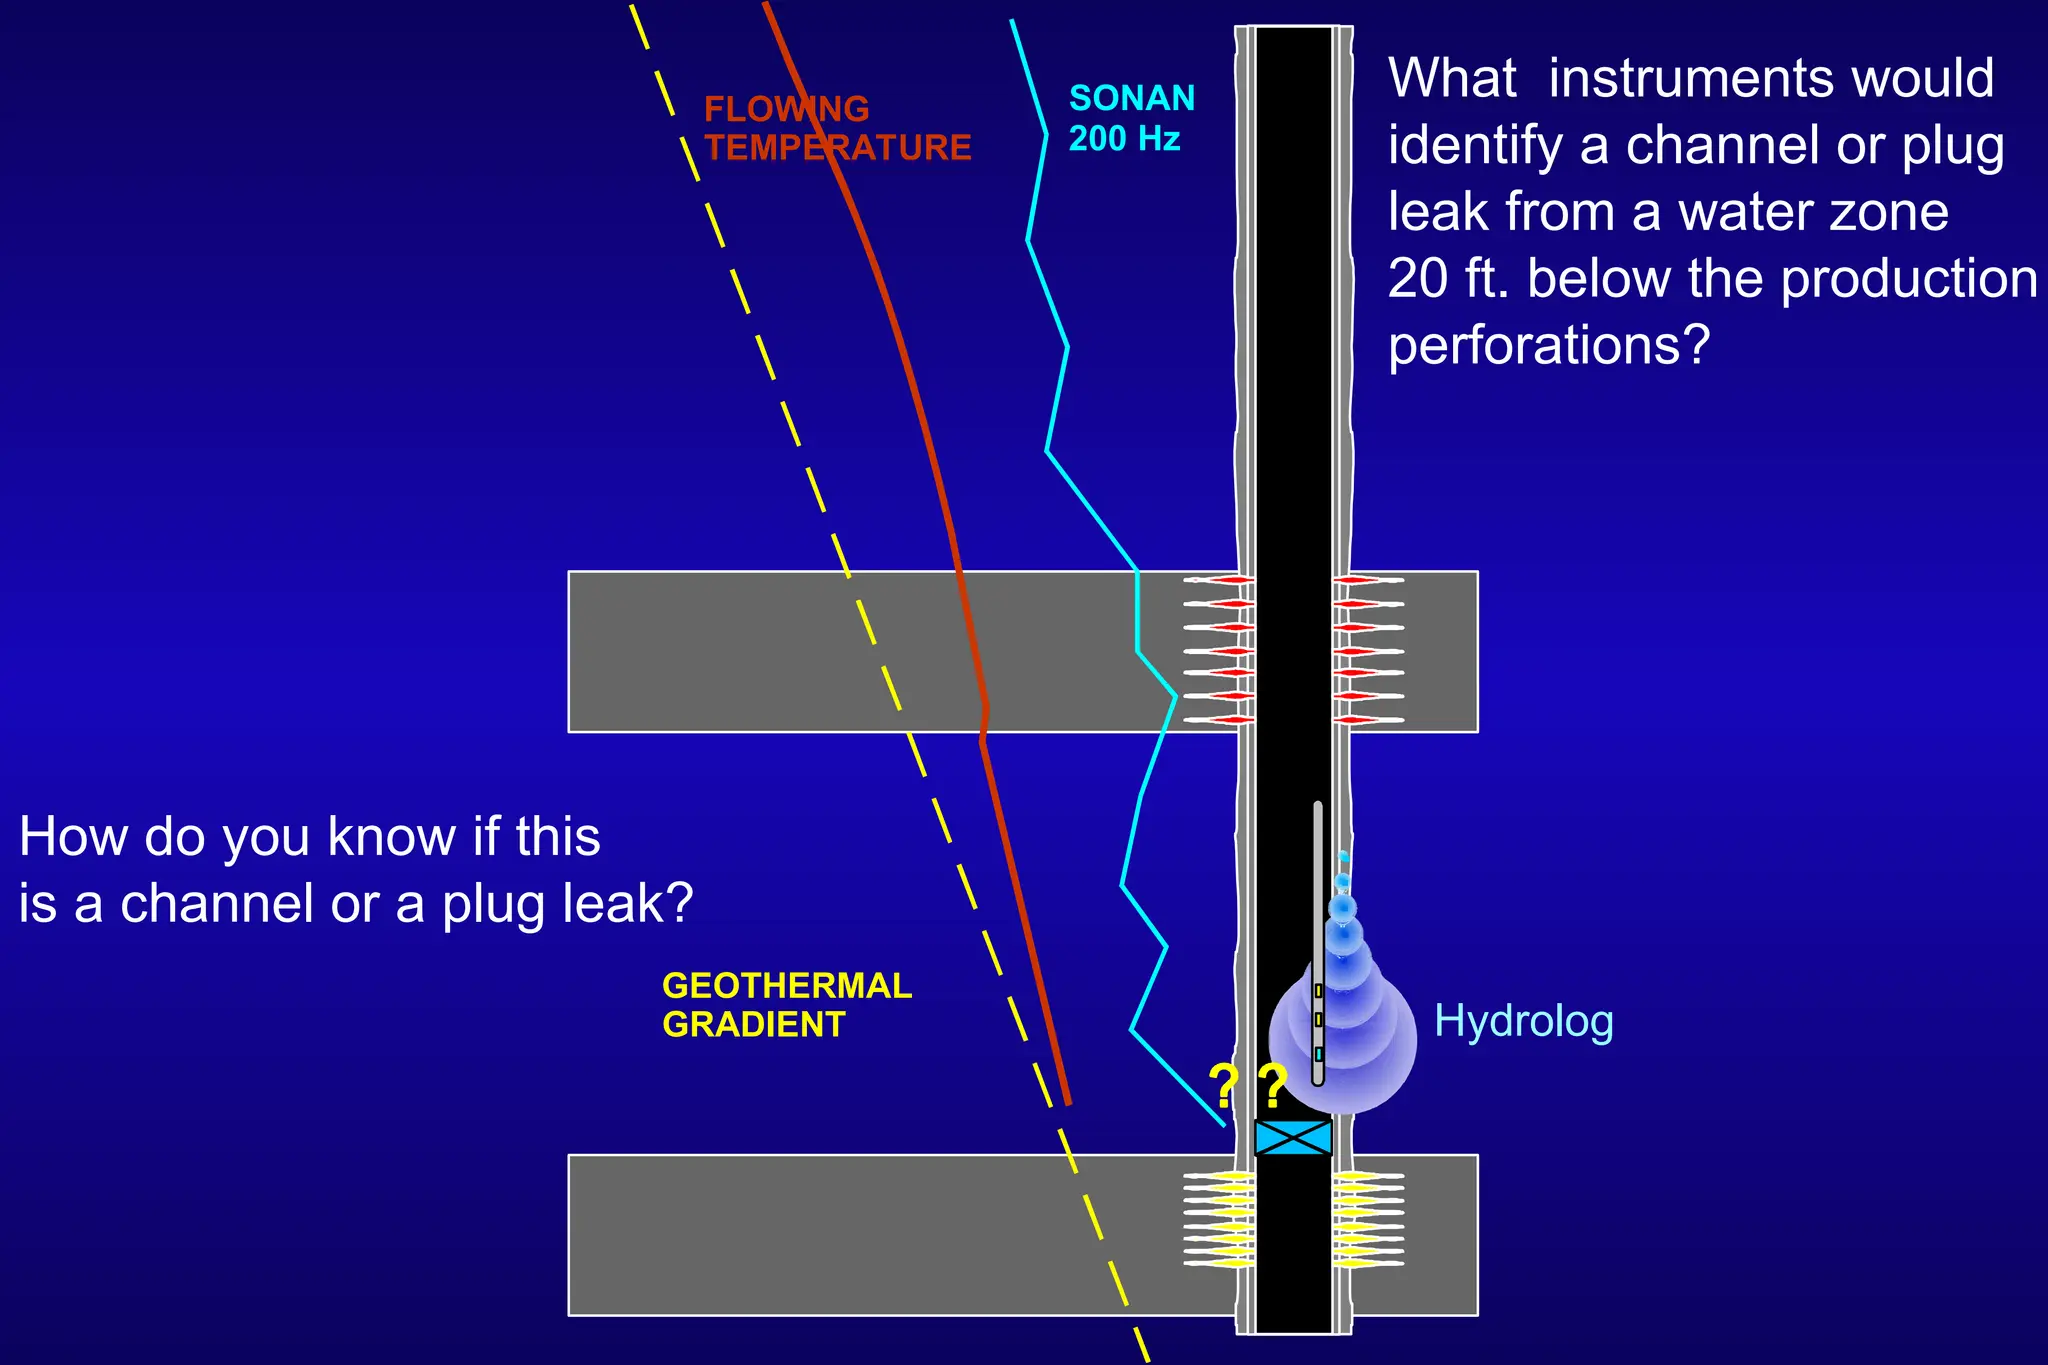
How do youknow if this
is a channel or a plug leak?
What instruments would
identify a channel or plug
leak from a water zone
20 ft. below the production
perforations?
FLOWING
TEMPERATURE
GEOTHERMAL
GRADIENT
SONAN
200 Hz
Hydrolog
87.
92
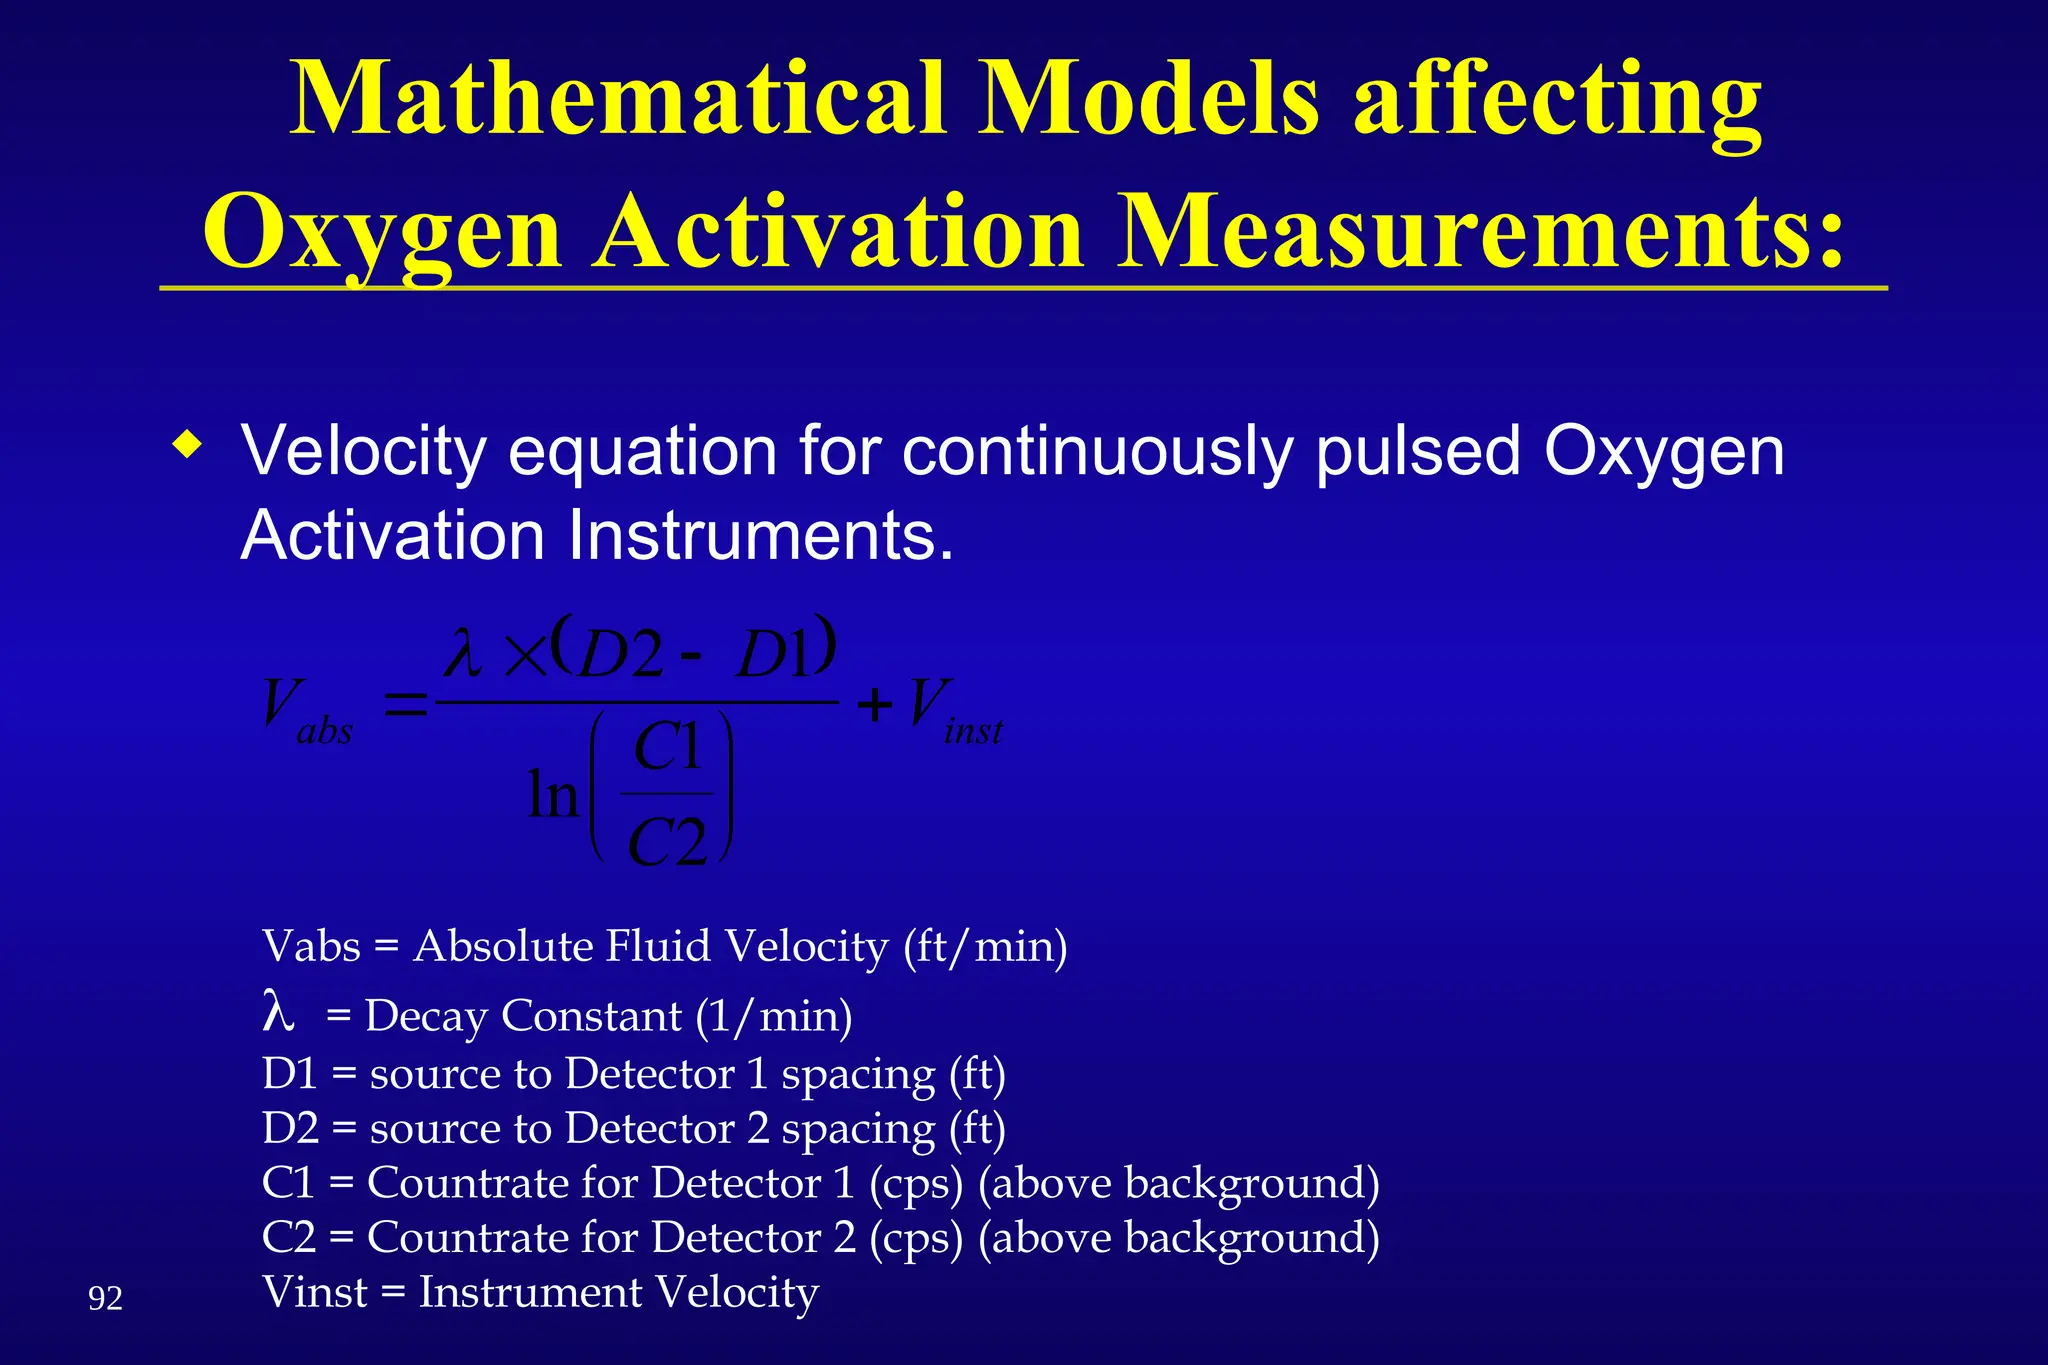
Mathematical Models affecting
OxygenActivation Measurements:
Velocity equation for continuously pulsed Oxygen
Activation Instruments.
V
D D
C
C
V
abs inst
2 1
1
2
ln
Vabs = Absolute Fluid Velocity (ft/min)
= Decay Constant (1/min)
D1 = source to Detector 1 spacing (ft)
D2 = source to Detector 2 spacing (ft)
C1 = Countrate for Detector 1 (cps) (above background)
C2 = Countrate for Detector 2 (cps) (above background)
Vinst = Instrument Velocity
88.
93
Prism Applications
Prism Applications
Evaluate Hydraulic Fracturing Treatments
Evaluate chemical stimulation's
Evaluate cement squeeze operations
Evaluate gravel pack operations
Evaluate effectiveness of diverting agents.
Monitor any single or multiple stage injection
operation.
89.
94
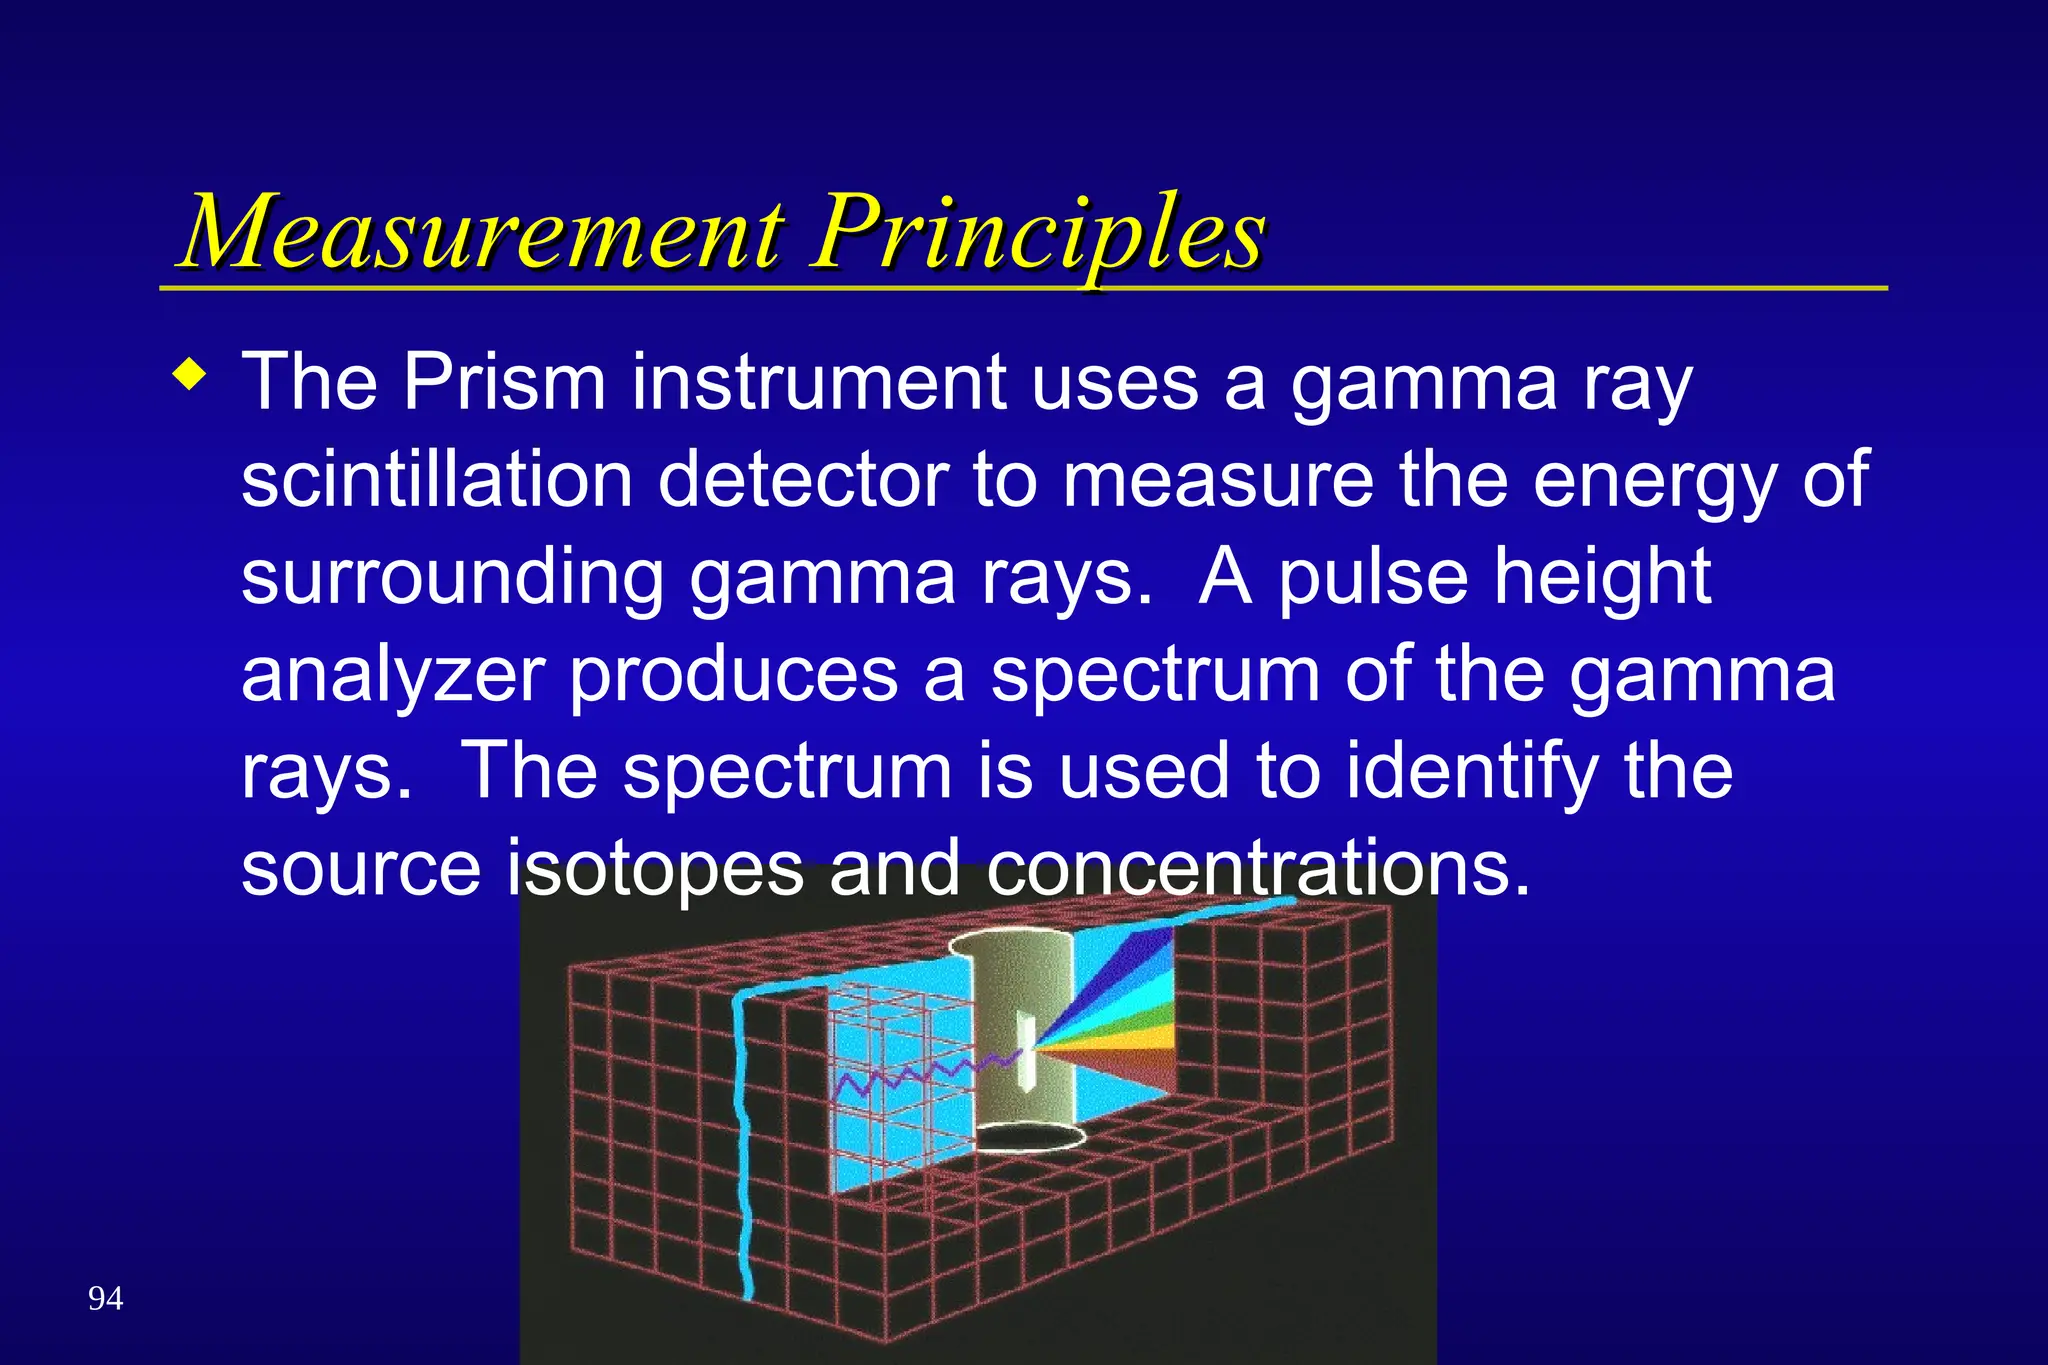
Measurement Principles
Measurement Principles
The Prism instrument uses a gamma ray
scintillation detector to measure the energy of
surrounding gamma rays. A pulse height
analyzer produces a spectrum of the gamma
rays. The spectrum is used to identify the
source isotopes and concentrations.
90.
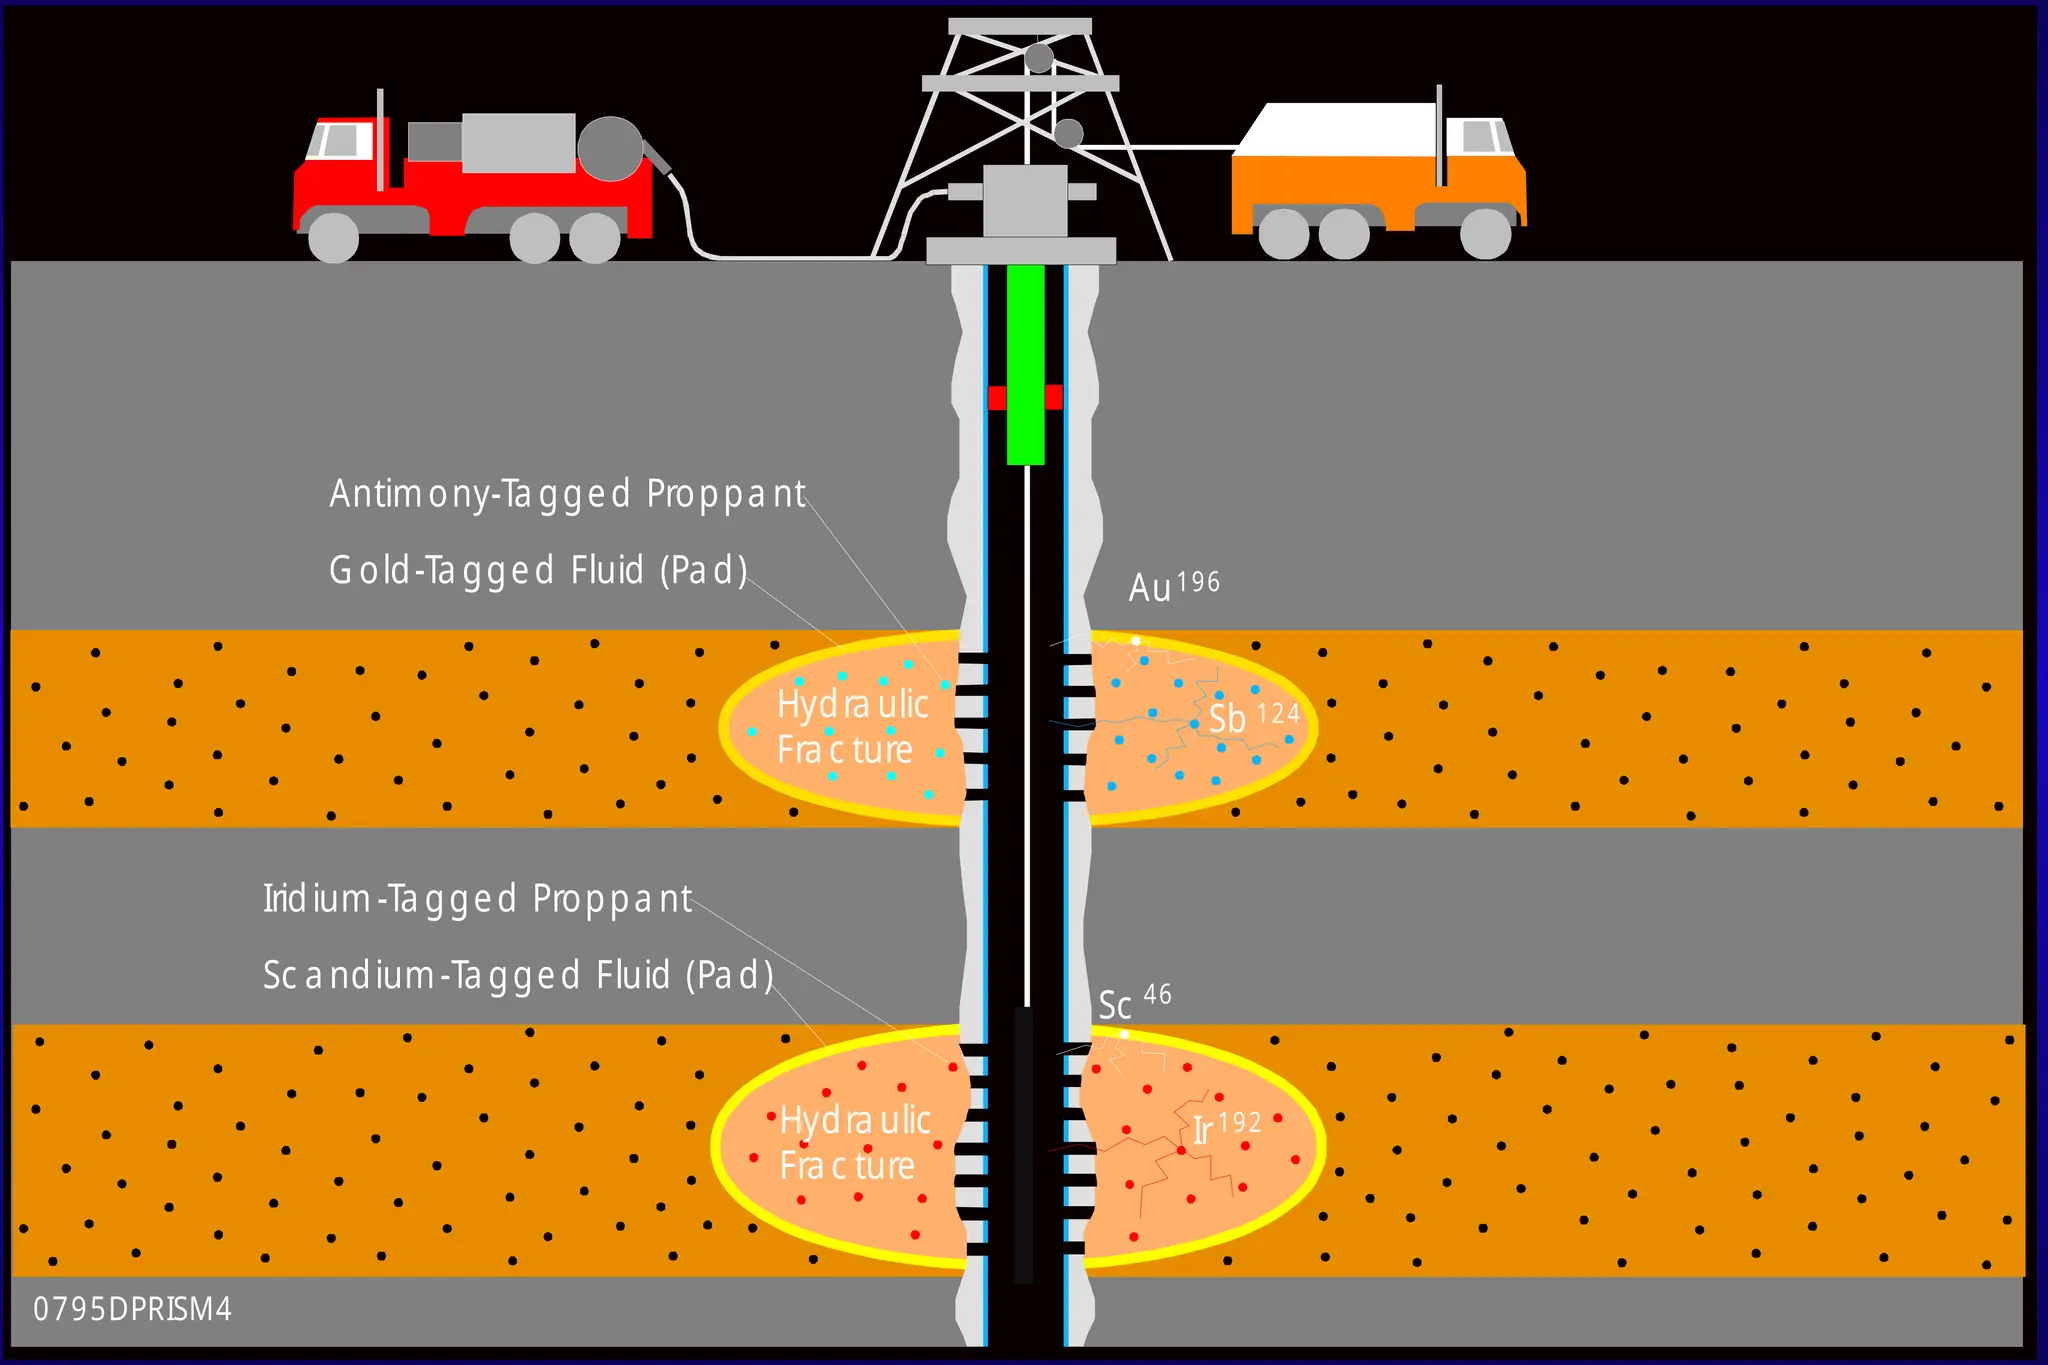
Au196
Sb 124
Hydra ulic
Frac ture
Antimony-Ta gged Proppa nt
G old-Ta gged Fluid (Pa d)
Ir192
Sc 46
Iridium -Ta gged Proppa nt
Sc a ndium-Ta gged Fluid (Pa d)
Hydra ulic
Fra c ture
0795DPRISM4
91.
96
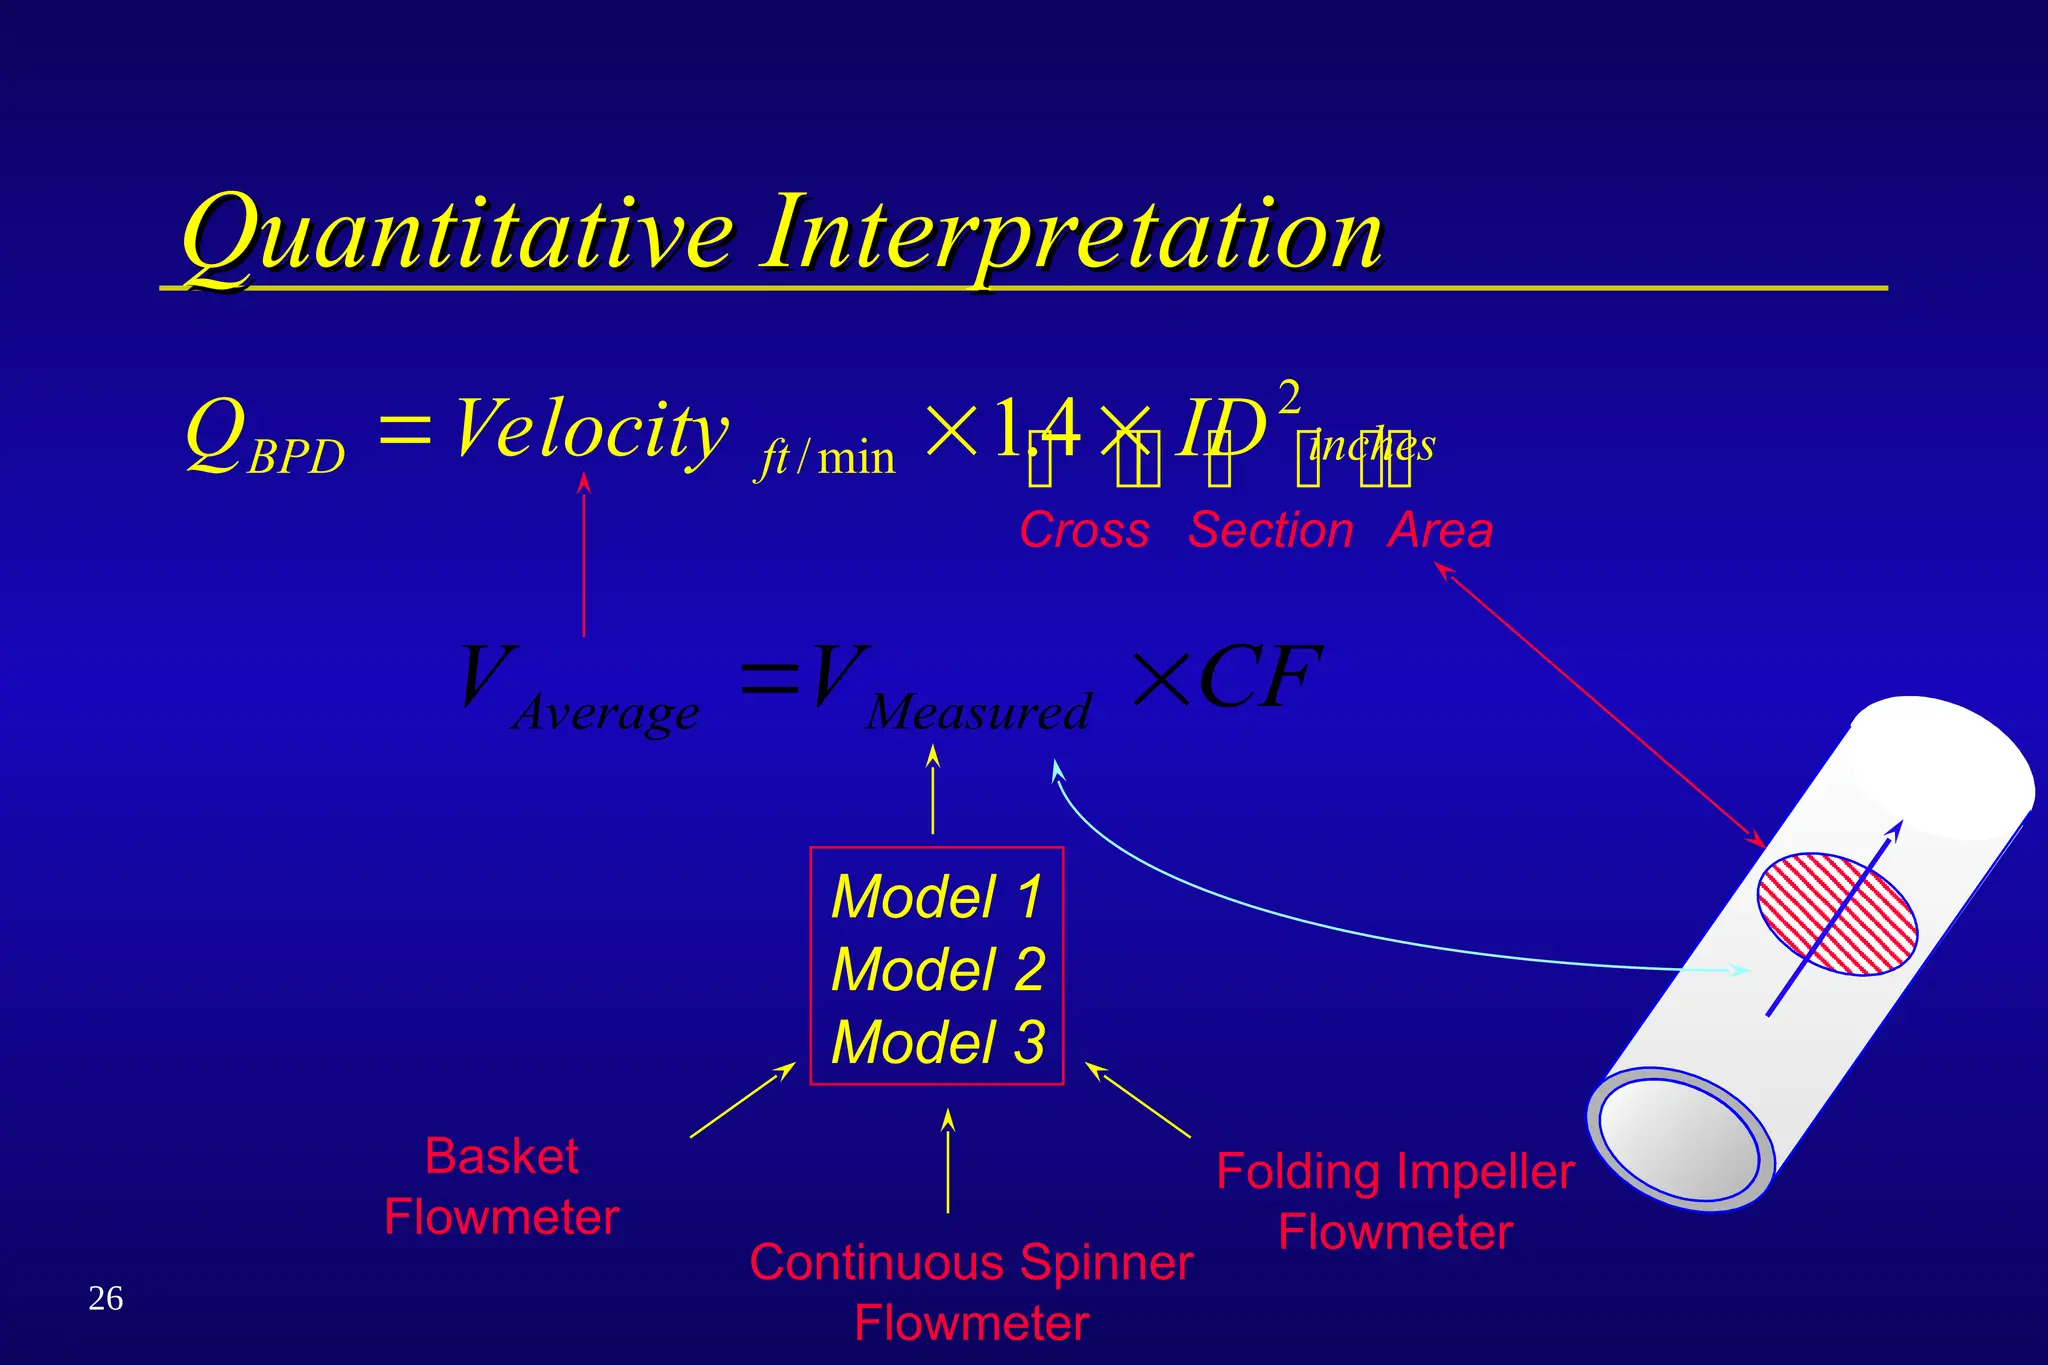
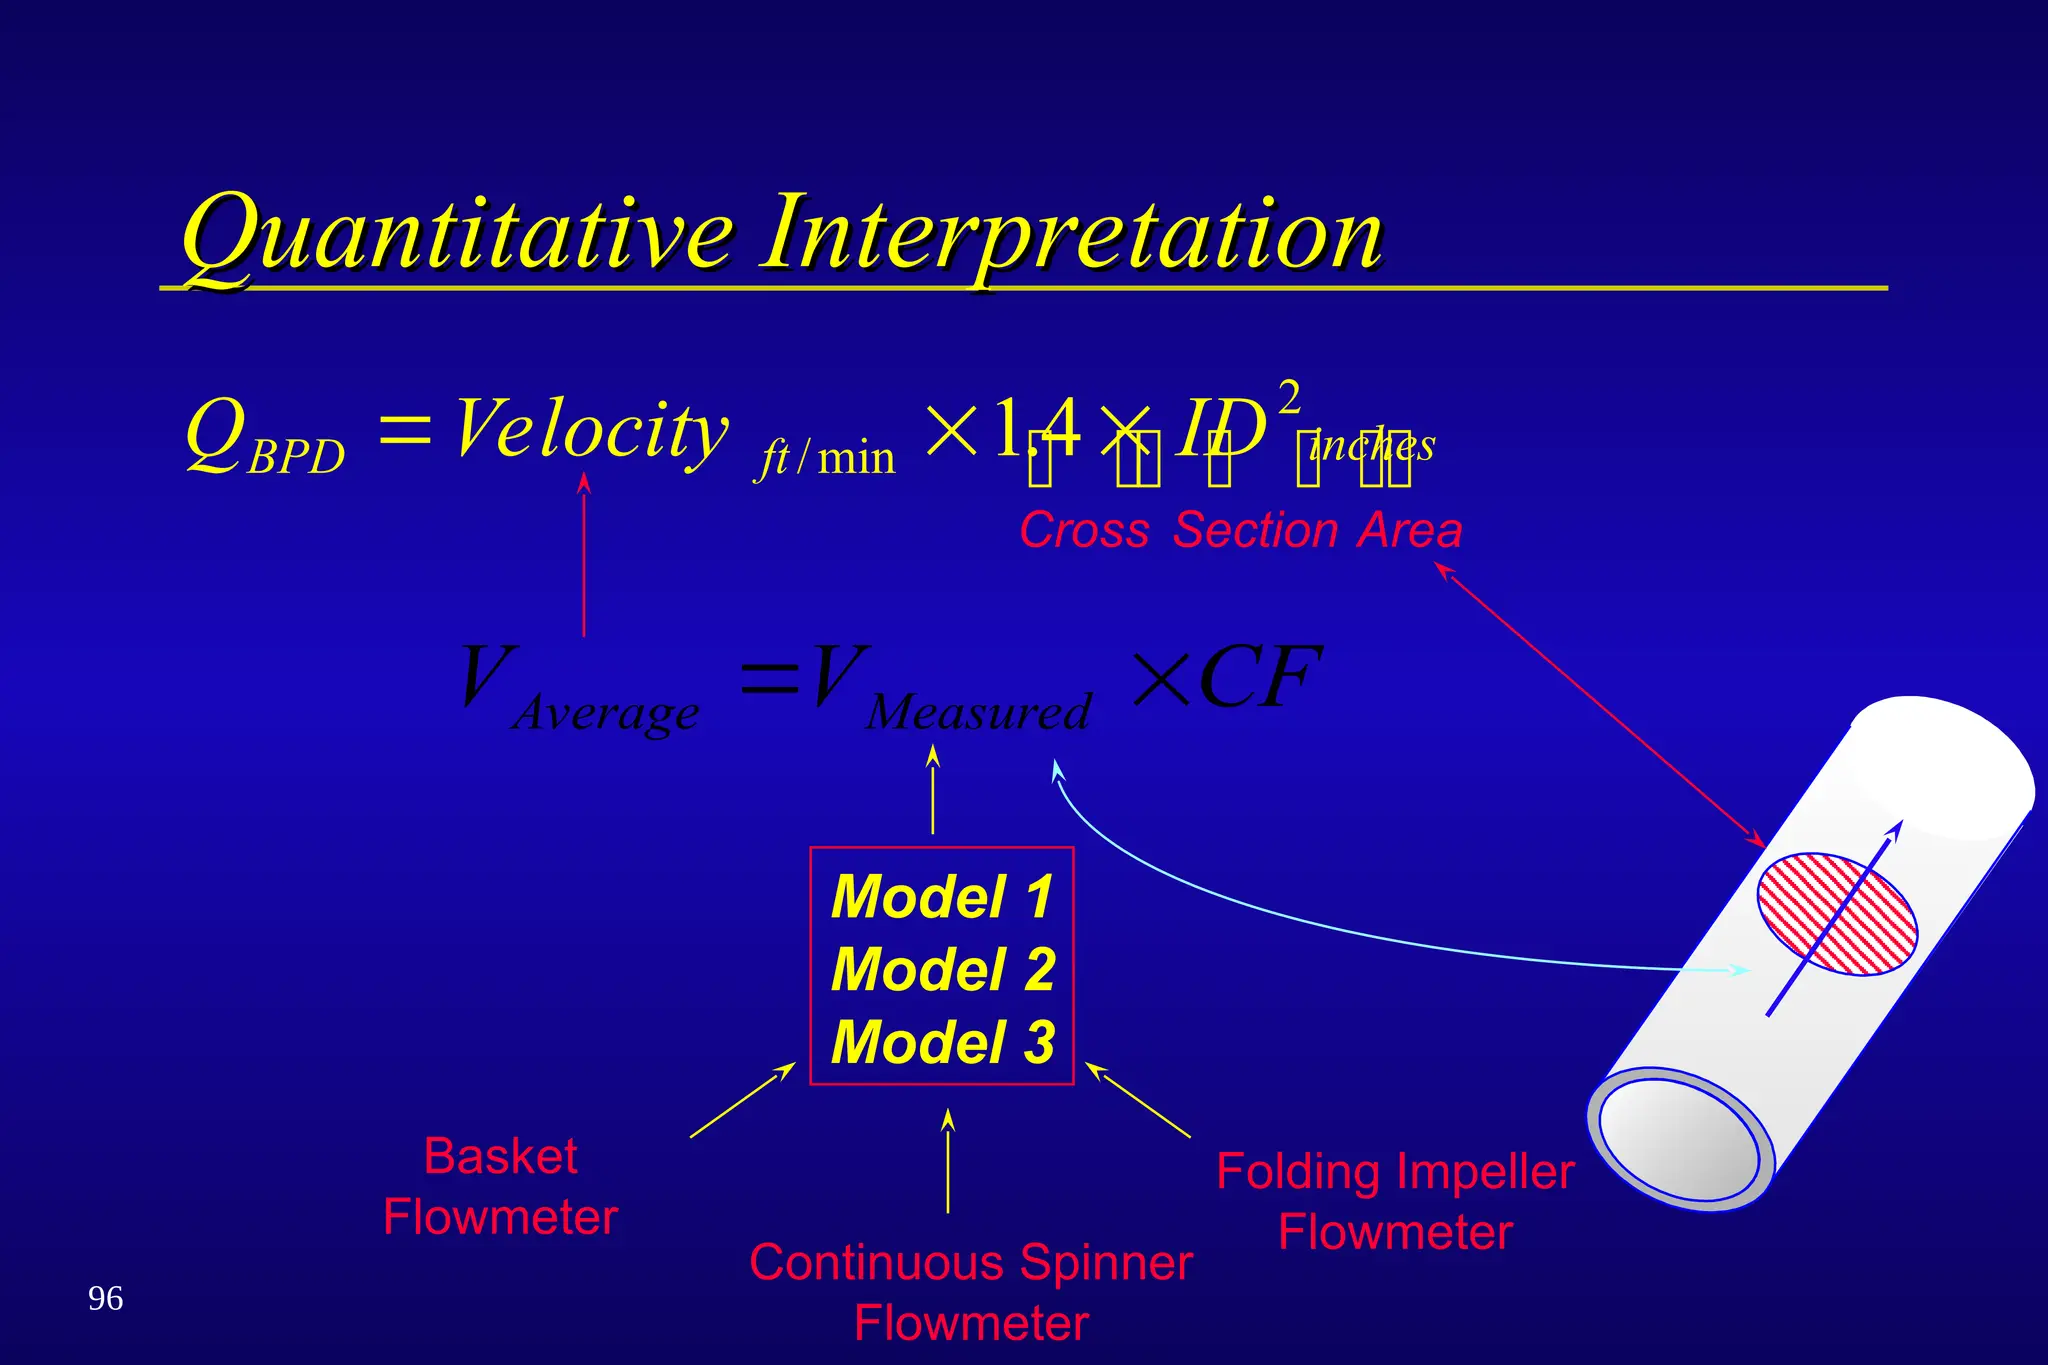
Quantitative Interpretation
Quantitative Interpretation
QVelocity ID
BPD ft inches
Cross Section Area
/min .
14 2
V V CF
Average Measured
Model 1
Model 2
Model 3
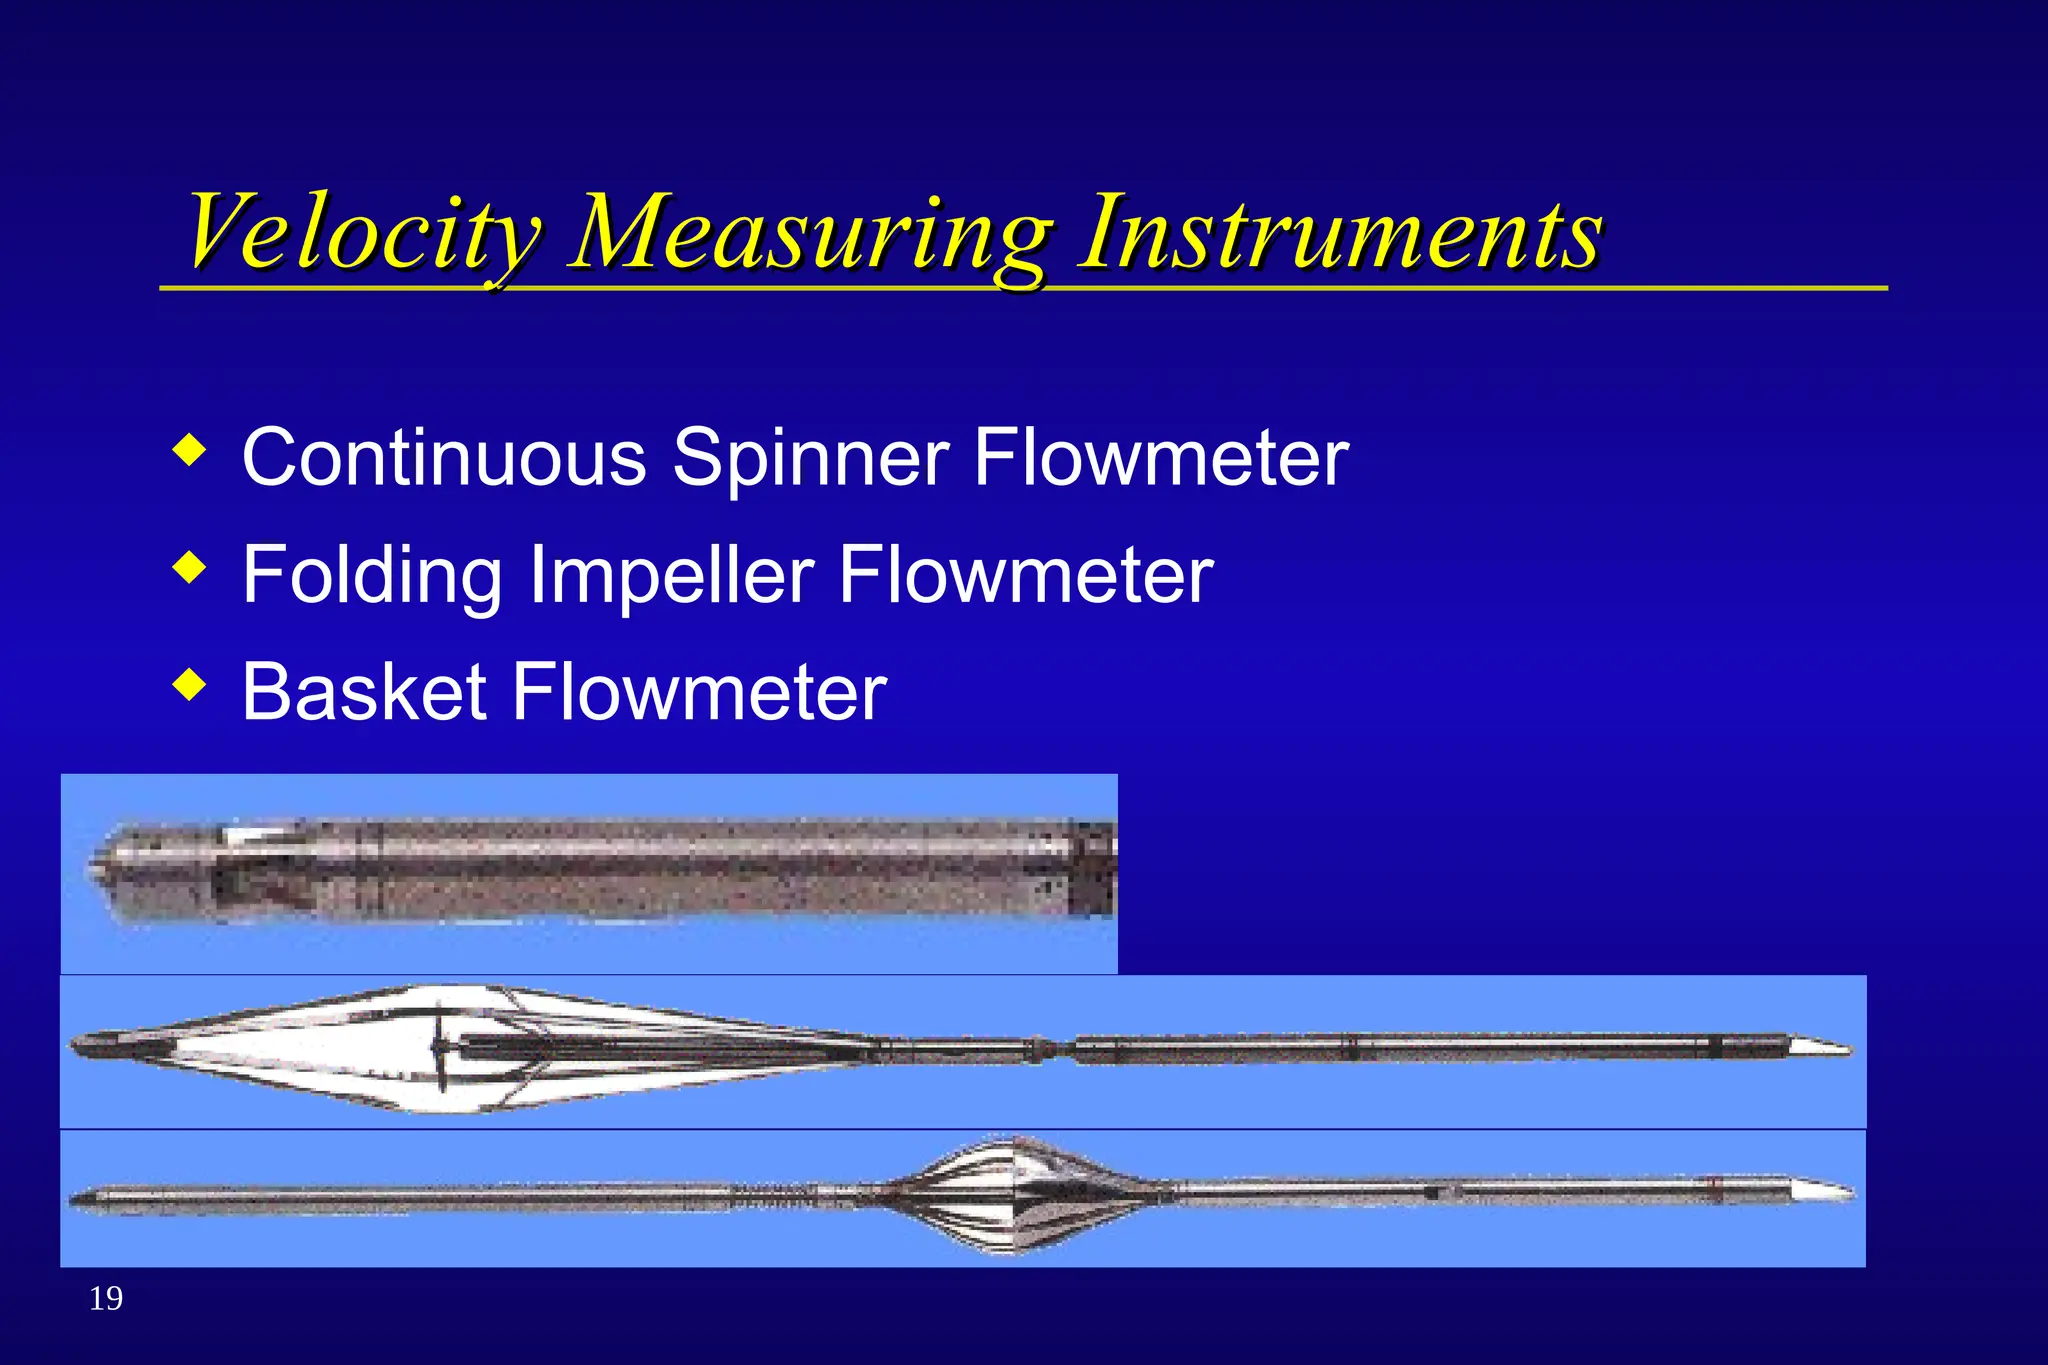
Folding Impeller
Flowmeter
Continuous Spinner
Flowmeter
Basket
Flowmeter
92.
97
Aw
Ag
Ao
Vw
Vo
Vg
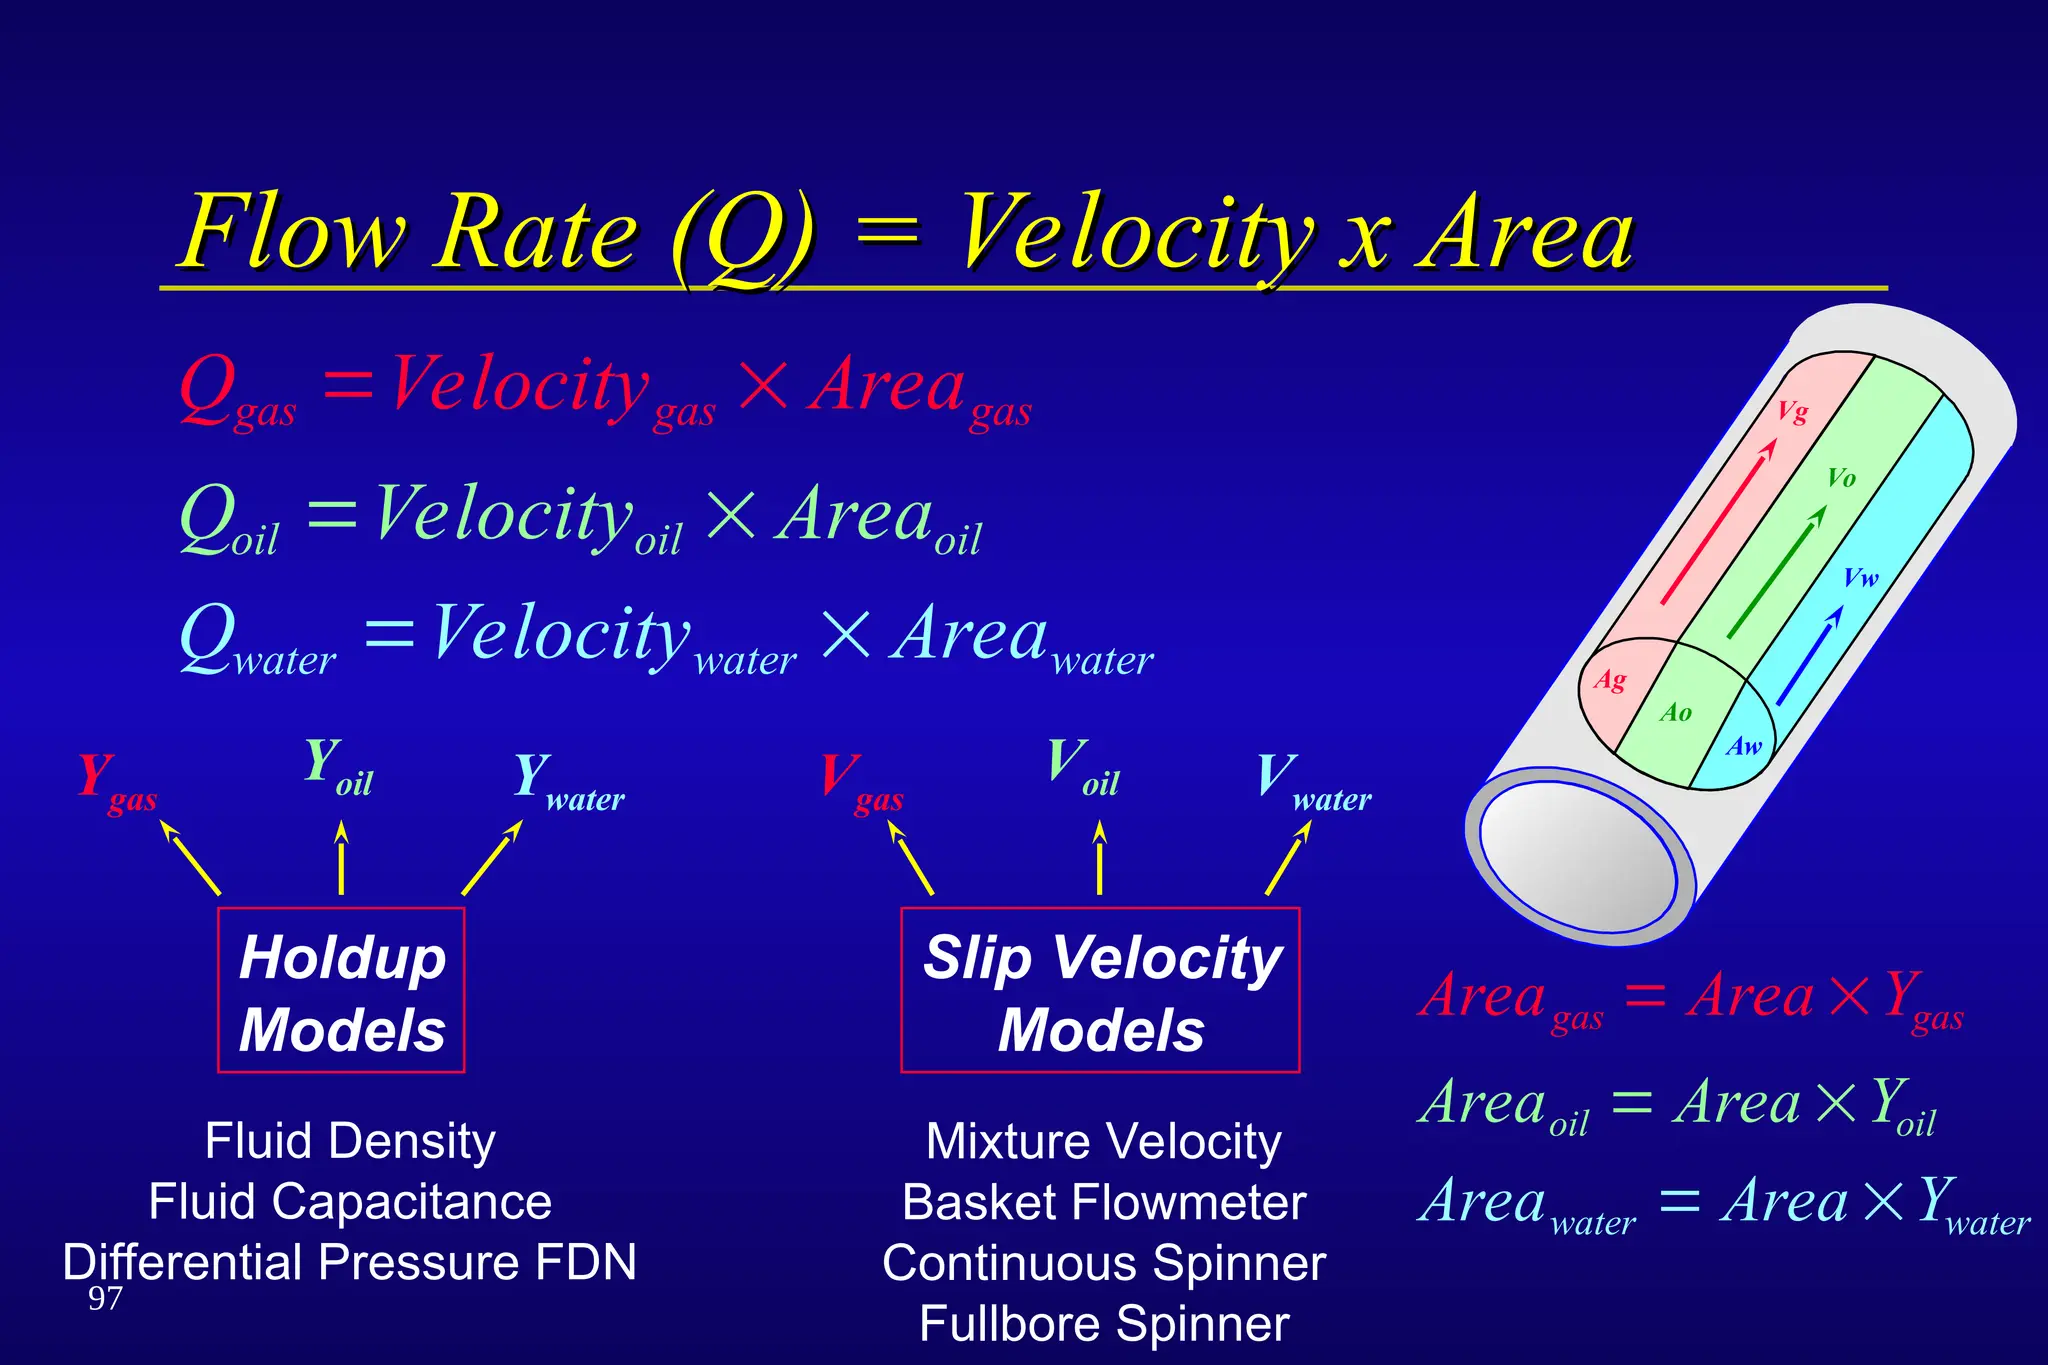
Flow Rate (Q)= Velocity x Area
Flow Rate (Q) = Velocity x Area
Area Area Y
Area Area Y
Area Area Y
gas gas
oil oil
water water
Q Velocity Area
Q Velocity Area
Q Velocity Area
gas gas gas
oil oil oil
water water water
Slip Velocity
Models
Holdup
Models
Voil Vwater
Vgas
Yoil Ywater
Ygas
Mixture Velocity
Basket Flowmeter
Continuous Spinner
Fullbore Spinner
Fluid Density
Fluid Capacitance
Differential Pressure FDN
93.
98
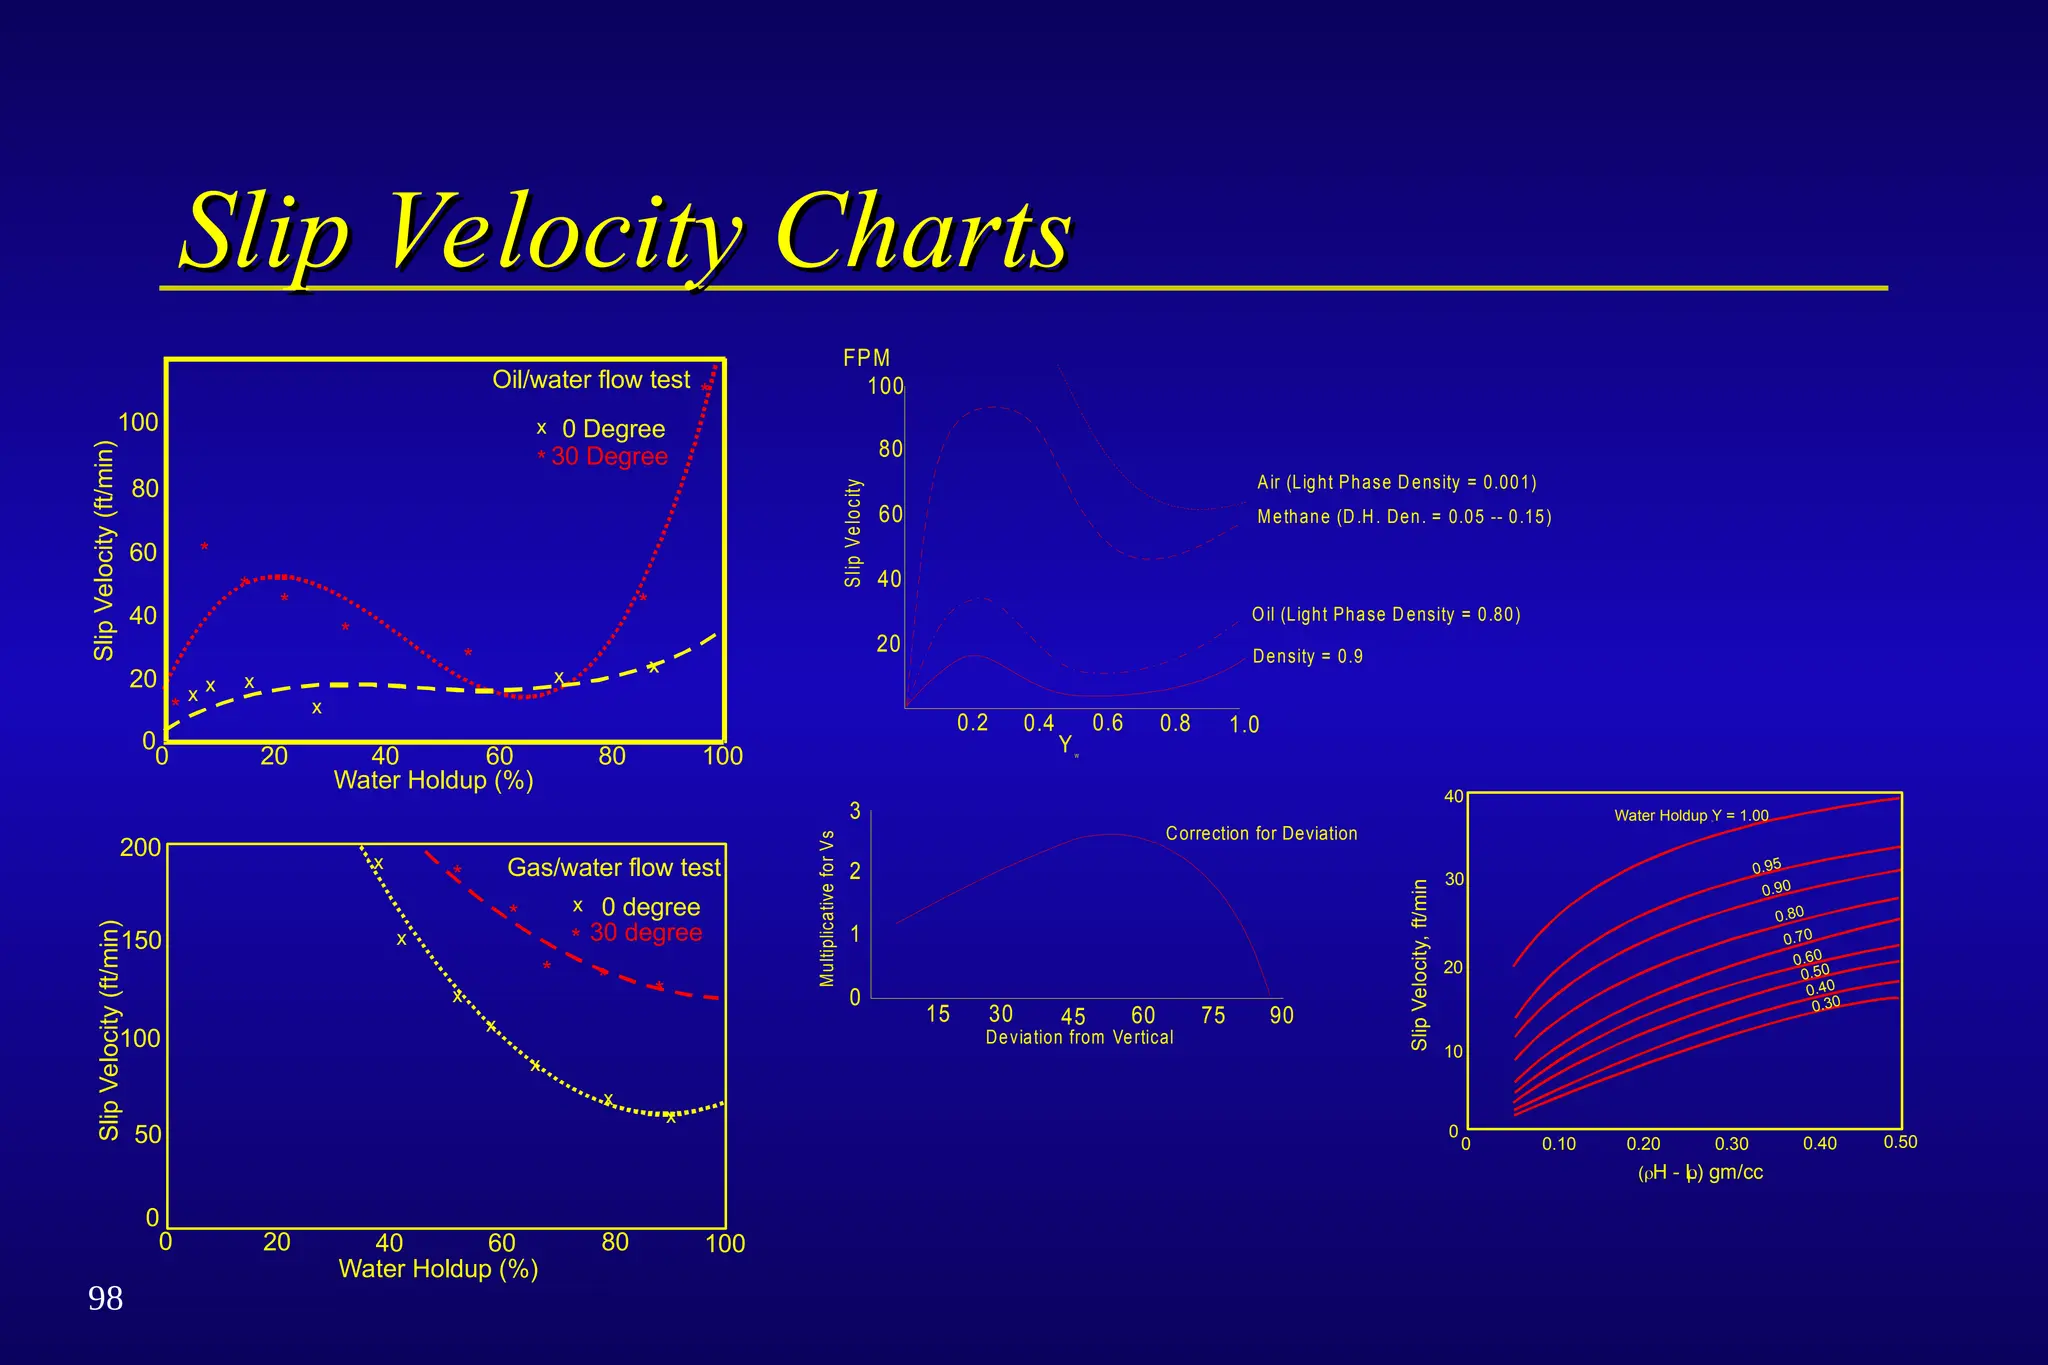
Slip Velocity Charts
SlipVelocity Charts
*
*
*
*
*
*
*
*
*
x x x
x
x
x
x
x
0 20 40 60 80 100
0
20
40
60
80
100
Water Holdup (%)
Oil/water flow test
0 Degree
30 Degree
Slip
Velocity
(ft/min)
*
*
*
*
*
*
x
x
x
x
x
x
x
x
Gas/water flow test
0 degree
30 degree
0 20 40 60 80 100
Water Holdup (%)
0
50
100
150
200
Slip
Velocity
(ft/min)
0 0.10 0.20 0.30 0.40 0.50
0
10
20
30
40
Water Holdup Y = 1.00
H
0.95
0.80
0.90
0.70
0.60
0.40
0.50
0.30
(H - L) gm/cc
Slip
Velocity,
ft/min
0.2 0.4 0.6 0.8 1.0
20
40
60
80
100
FPM
YW
Air (Light Phase Density = 0.001)
Methane (D.H. Den. = 0.05 -- 0.15)
Oil (Light Phase D ensity = 0.80)
Density = 0.9
S
lip
Ve
lo
city
15 30 45 60 75 90
0
1
2
3
Correction for Deviation
Multiplicative
for
Vs
Deviation from Vertical
94.
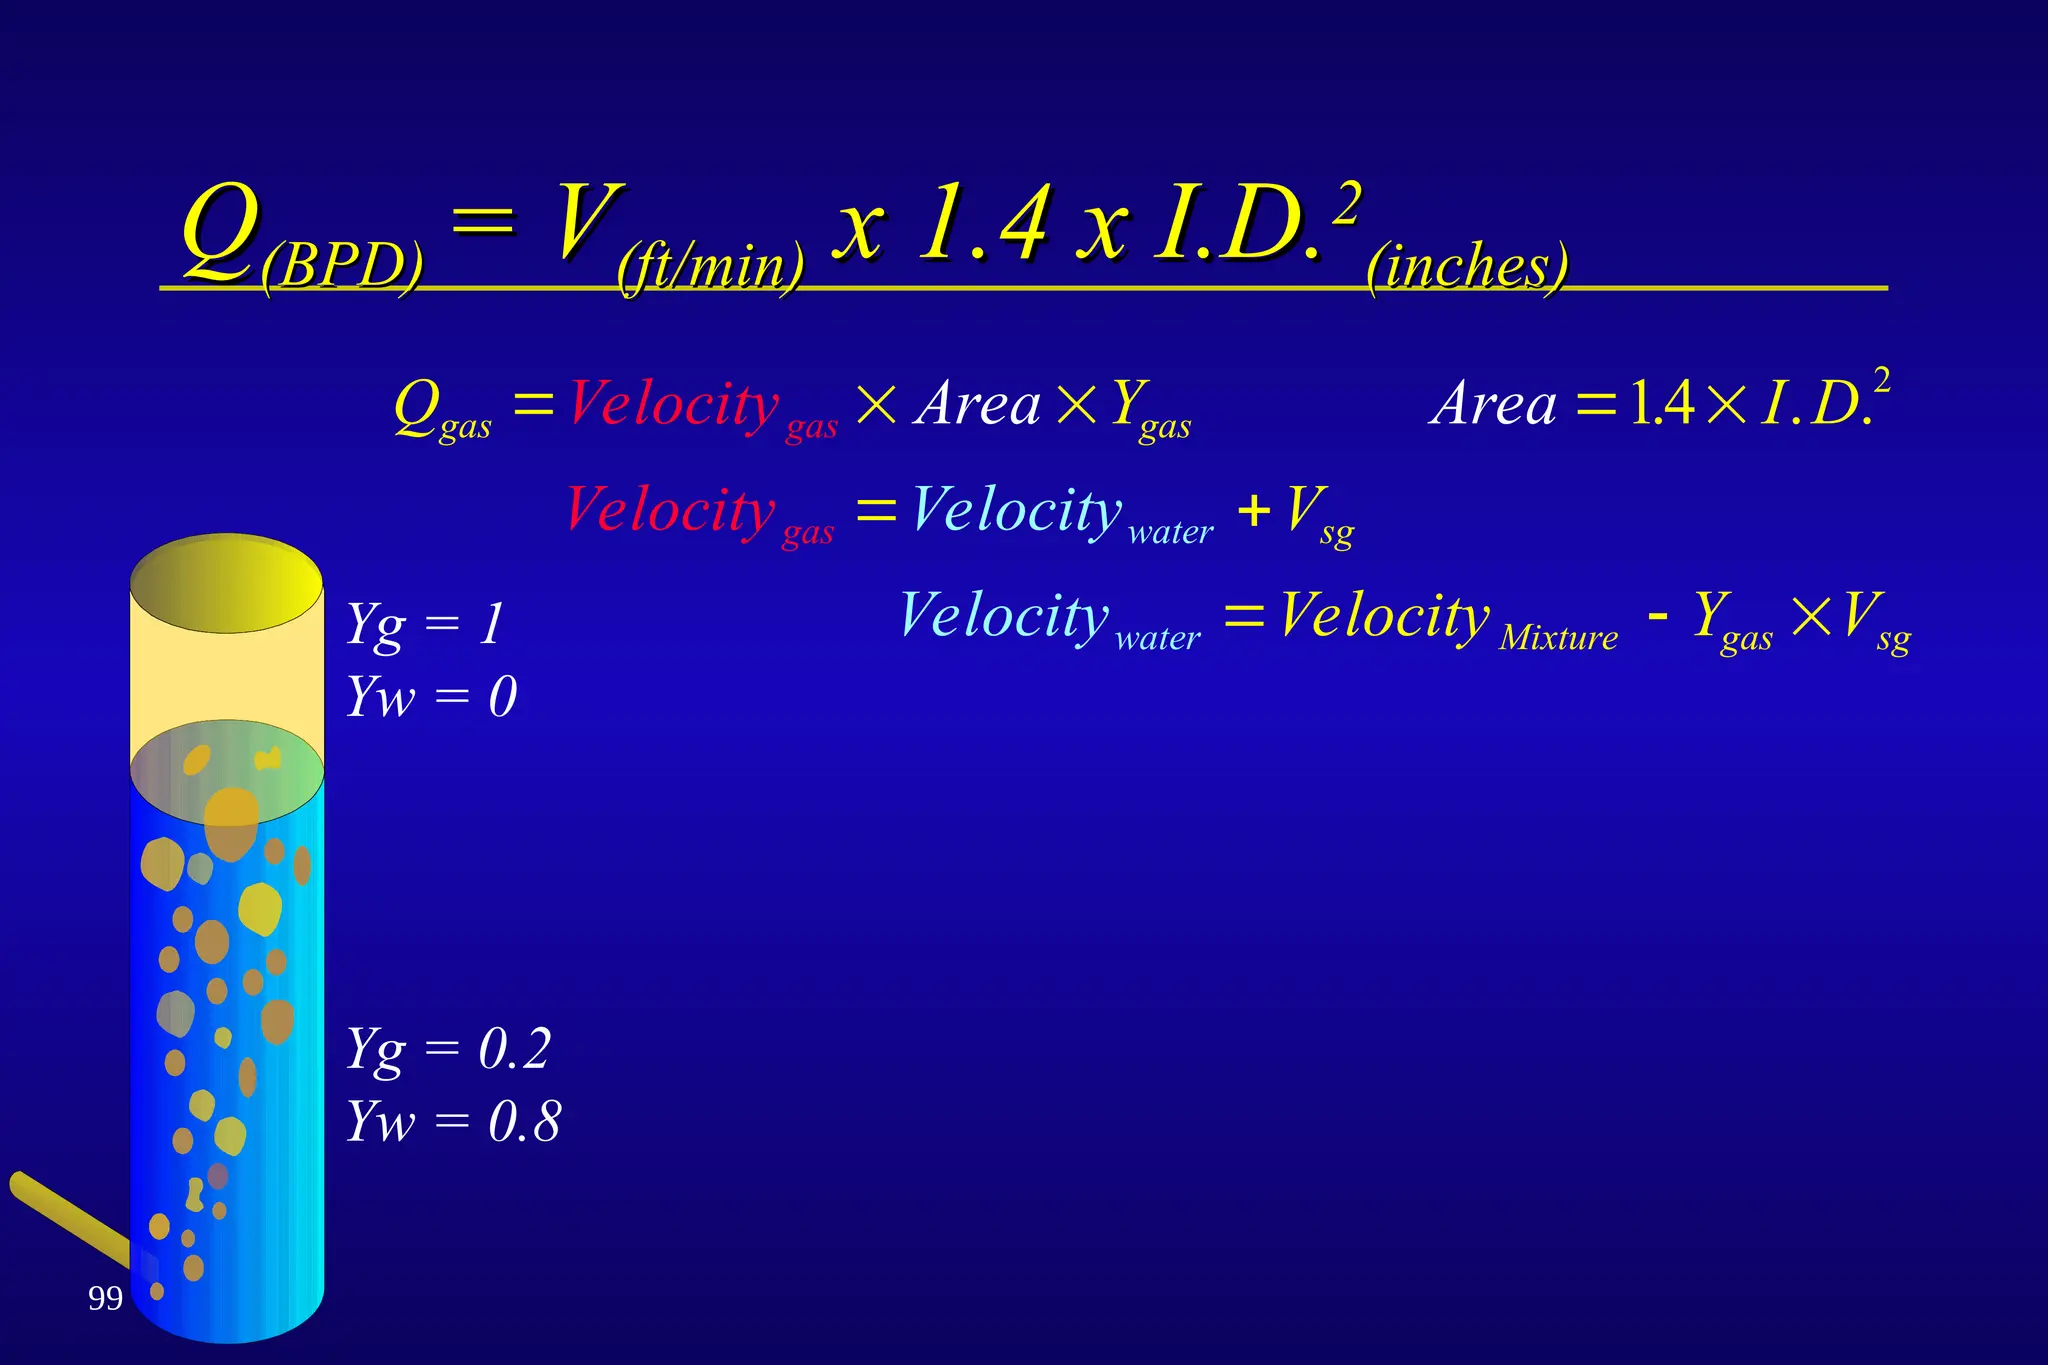
99
Q
Q(BPD)
(BPD) = V
=V(ft/min)
(ft/min) x 1.4 x I.D.
x 1.4 x I.D.2
2
(inches)
(inches)
Q Velocity Area Y Area I D
Velocity Velocity V
Velocity Velocity Y V
gas gas gas
gas water sg
water Mixture gas sg
14 2
. . .
Yg = 0.2
Yw = 0.8
Yg = 1
Yw = 0
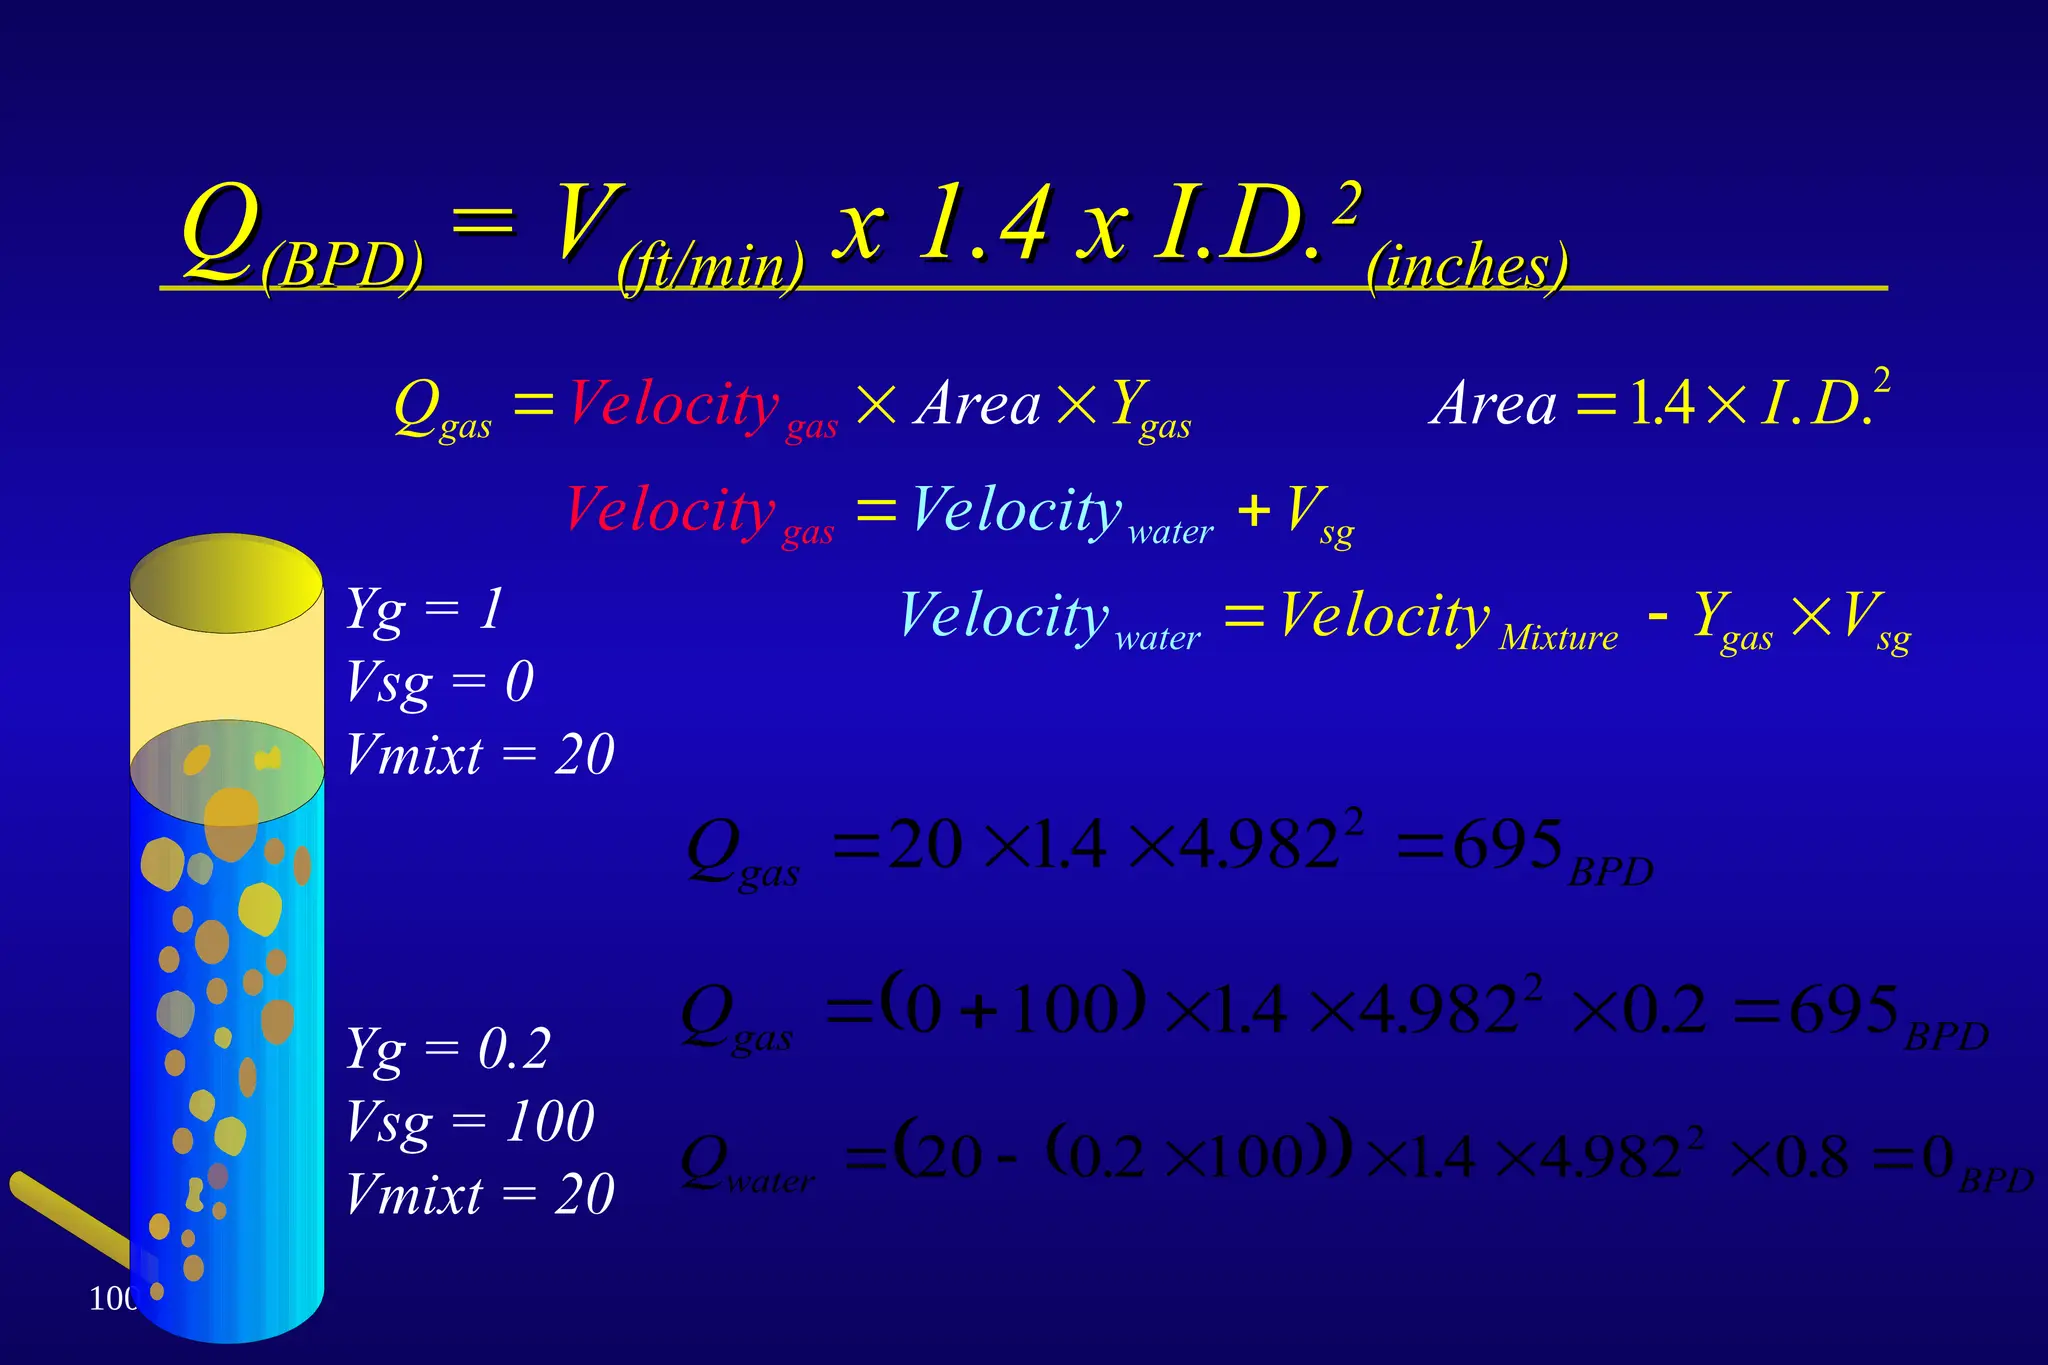
95.
100
Q
Q(BPD)
(BPD) = V
=V(ft/min)
(ft/min) x 1.4 x I.D.
x 1.4 x I.D.2
2
(inches)
(inches)
Q Velocity Area Y Area I D
Velocity Velocity V
Velocity Velocity Y V
gas gas gas
gas water sg
water Mixture gas sg
14 2
. . .
Yg = 0.2
Vsg = 100
Vmixt = 20
Yg = 1
Vsg = 0
Vmixt = 20
Qwater BPD
20 0 2 100 14 4982 08 0
2
. . . .
Qgas BPD
20 14 4982 695
2
. .
Qgas BPD
0 100 14 4982 0 2 695
2
. . .
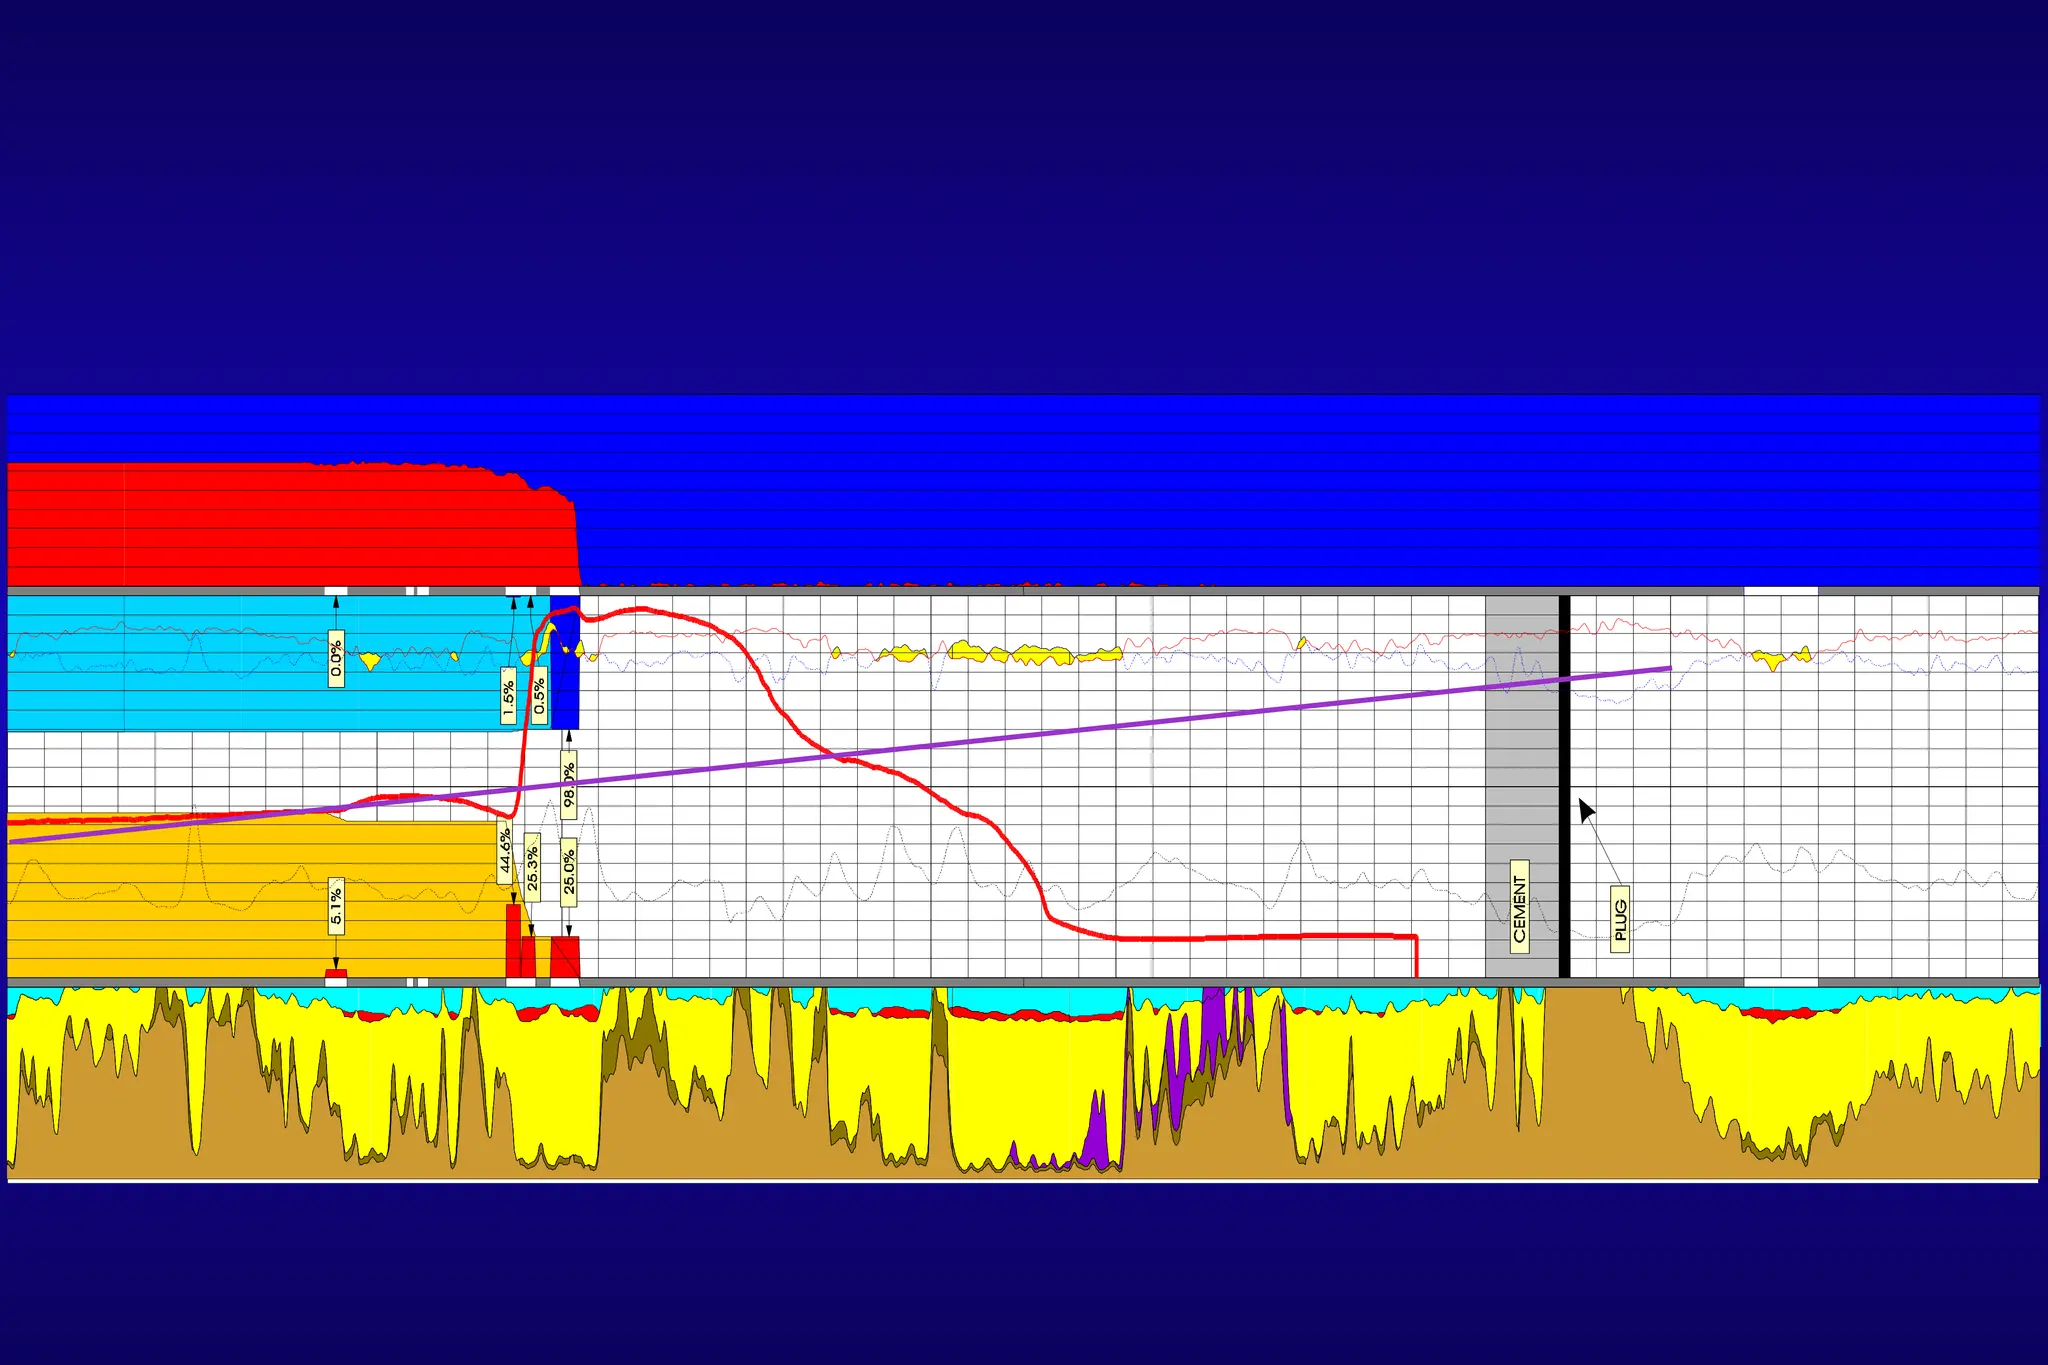
102
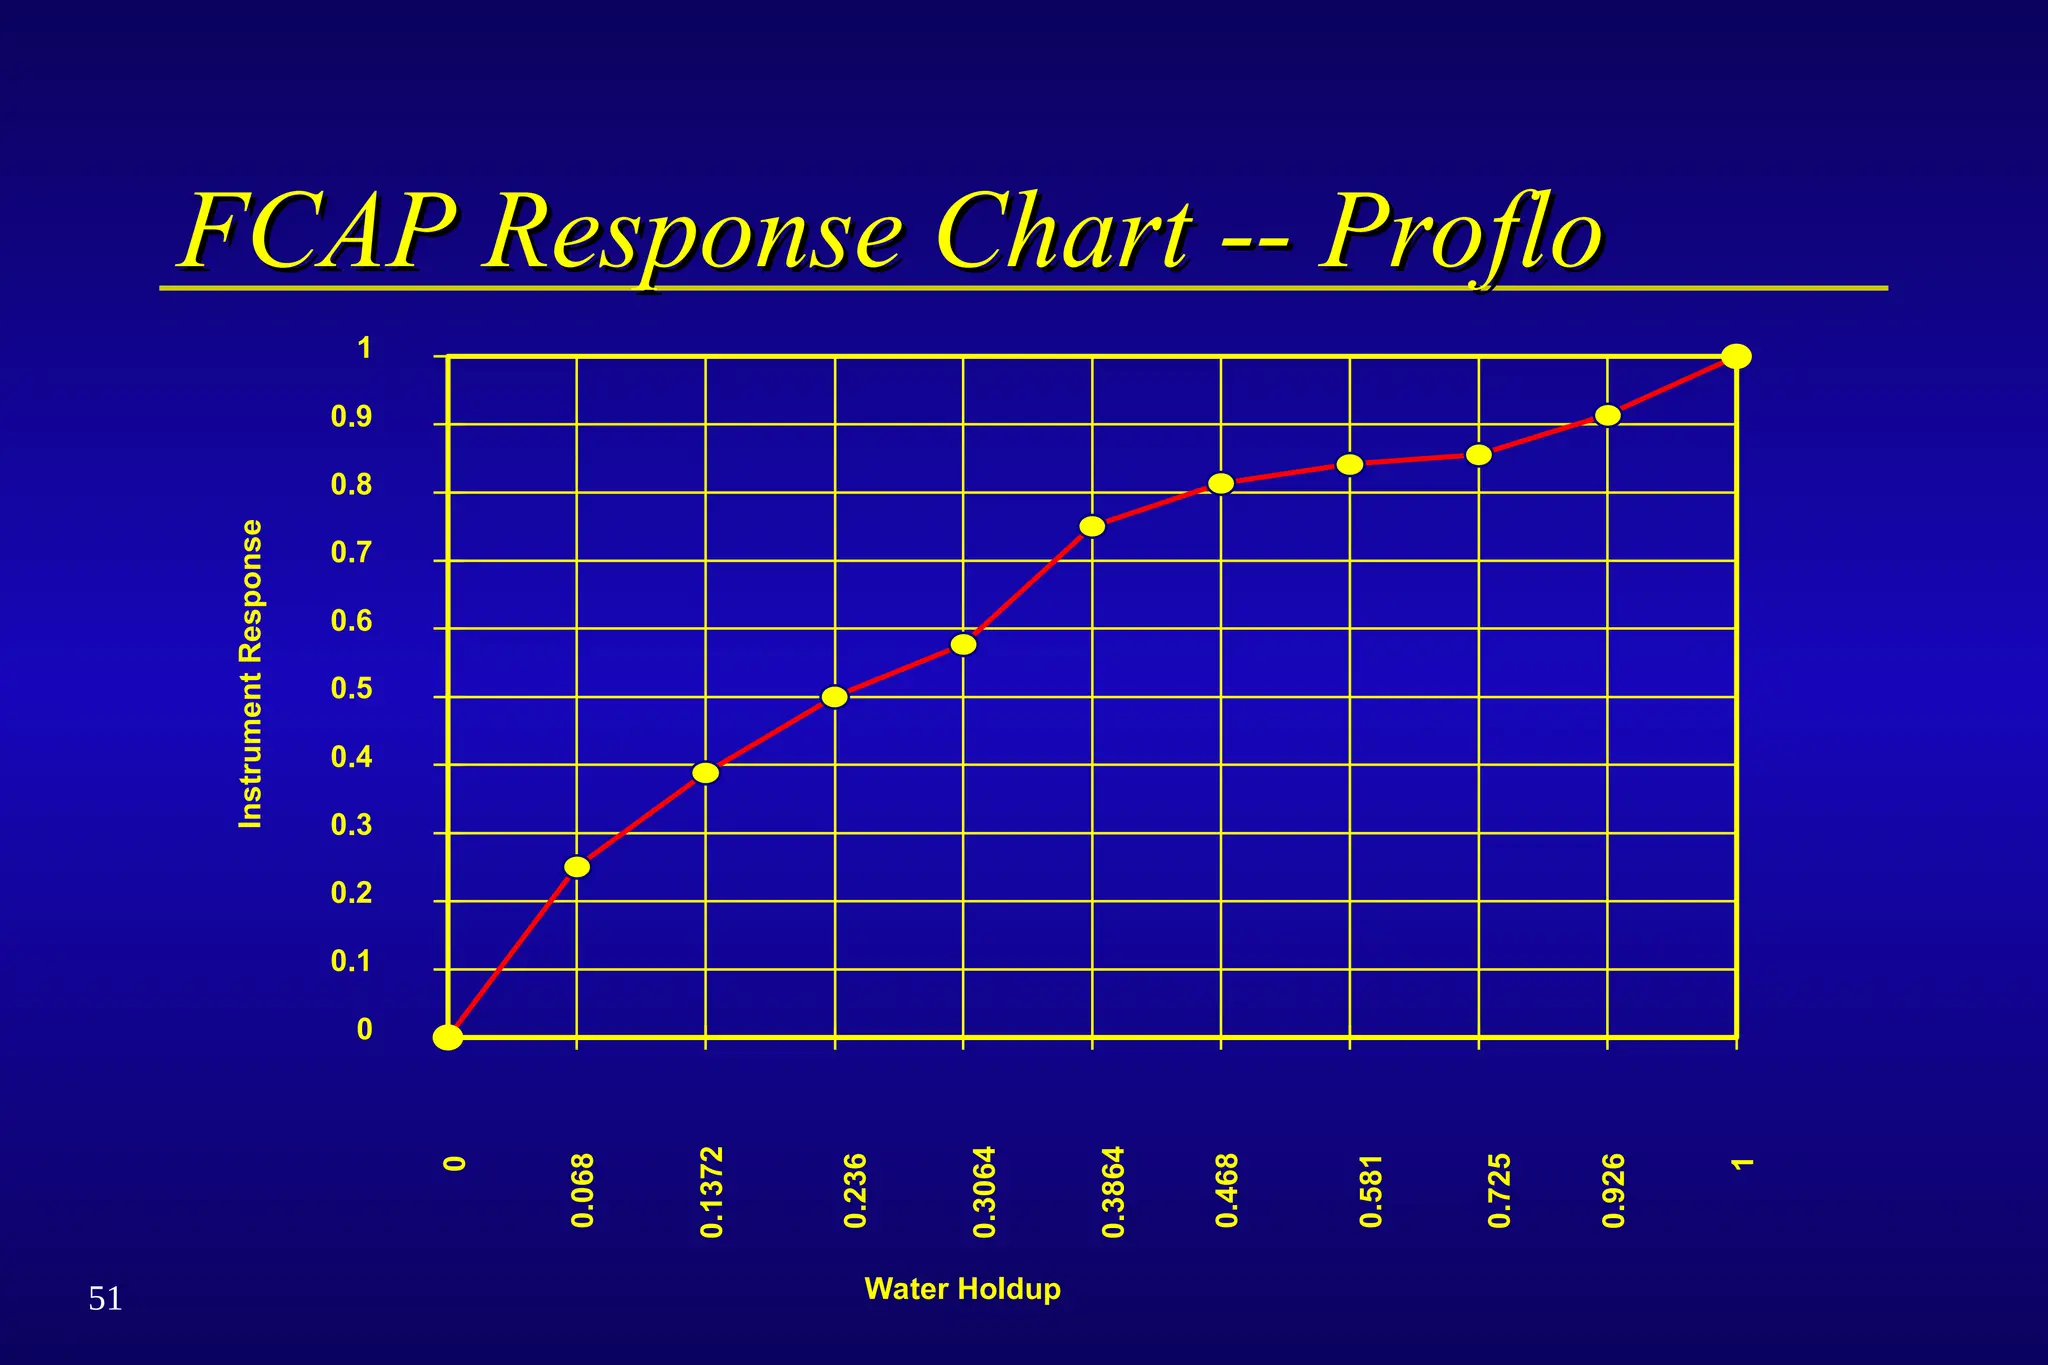
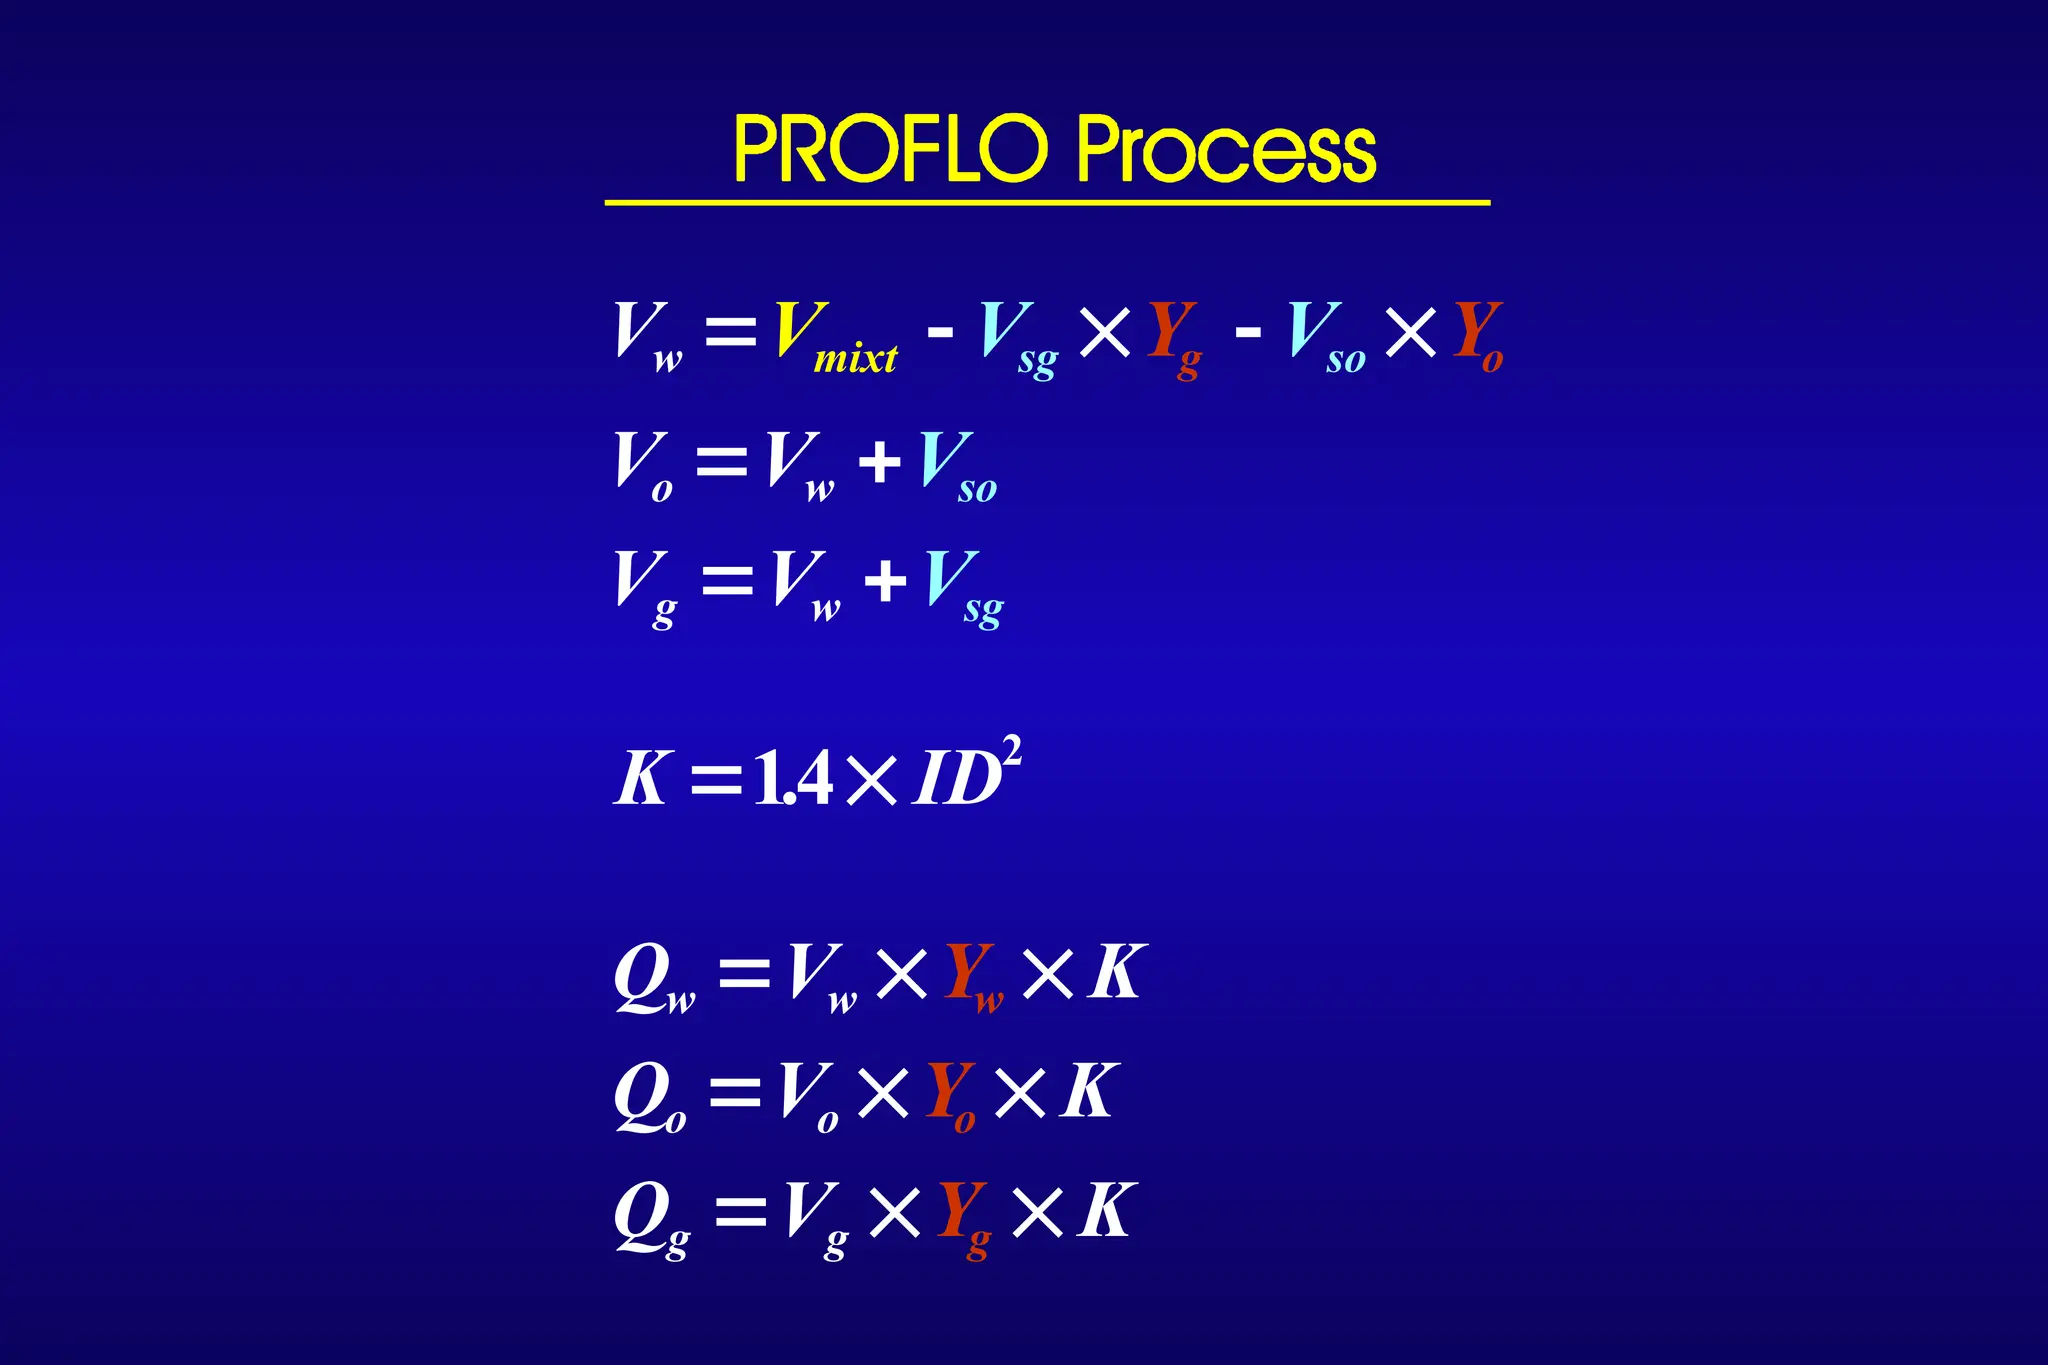
Proflo
Proflo
Multiphase flowanalysis program
Quantitative analysis of Production Logging data
Flow rate profile across production interval
98.
103
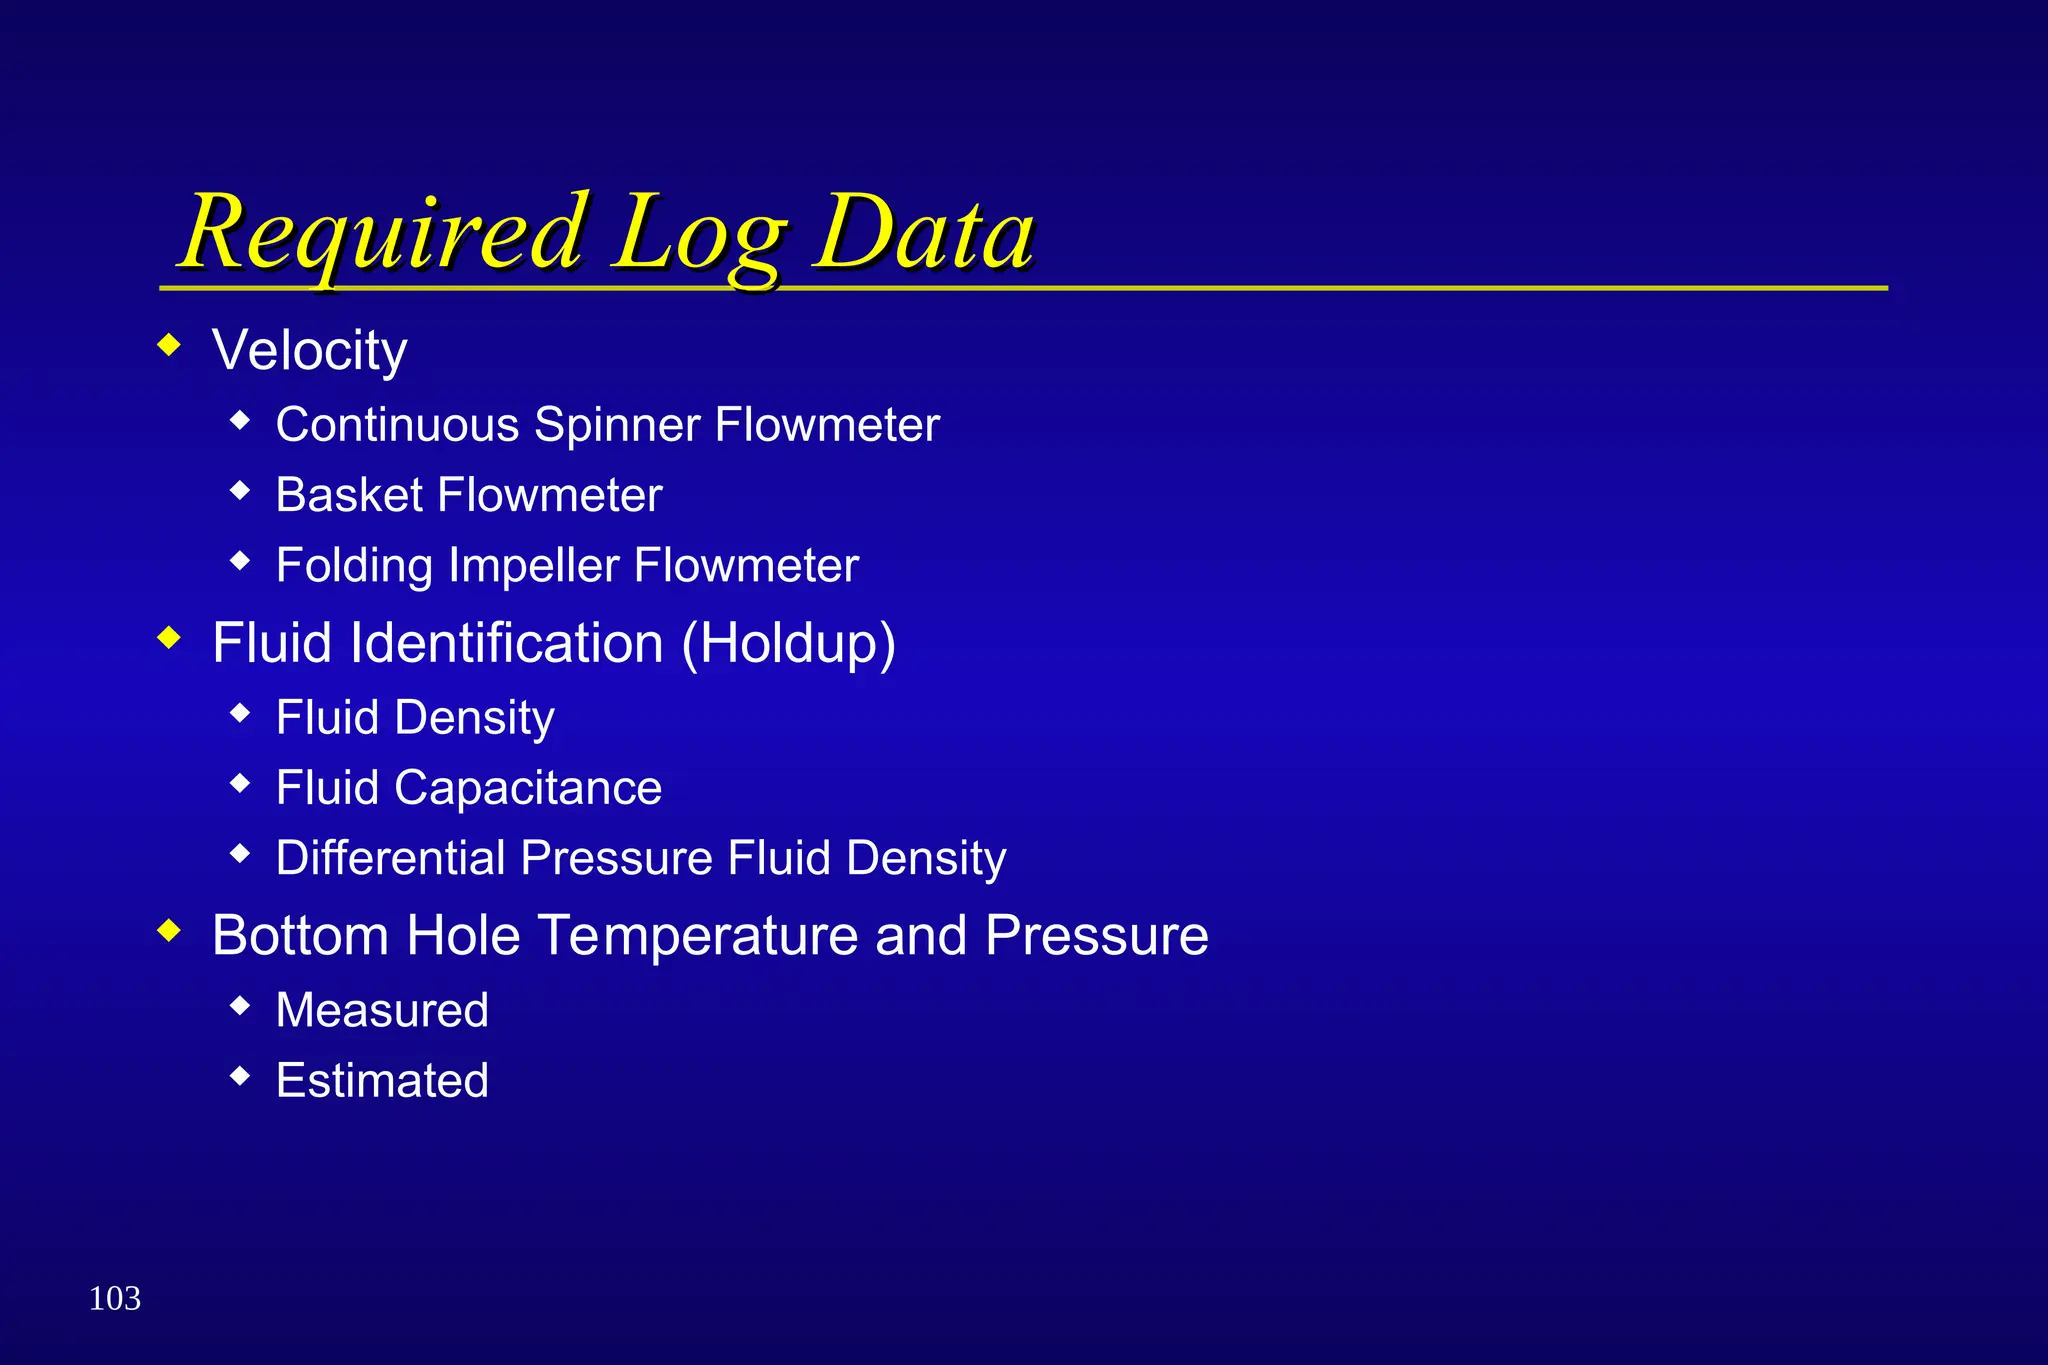
Required Log Data
RequiredLog Data
Velocity
Continuous Spinner Flowmeter
Basket Flowmeter
Folding Impeller Flowmeter
Fluid Identification (Holdup)
Fluid Density
Fluid Capacitance
Differential Pressure Fluid Density
Bottom Hole Temperature and Pressure
Measured
Estimated
99.
104
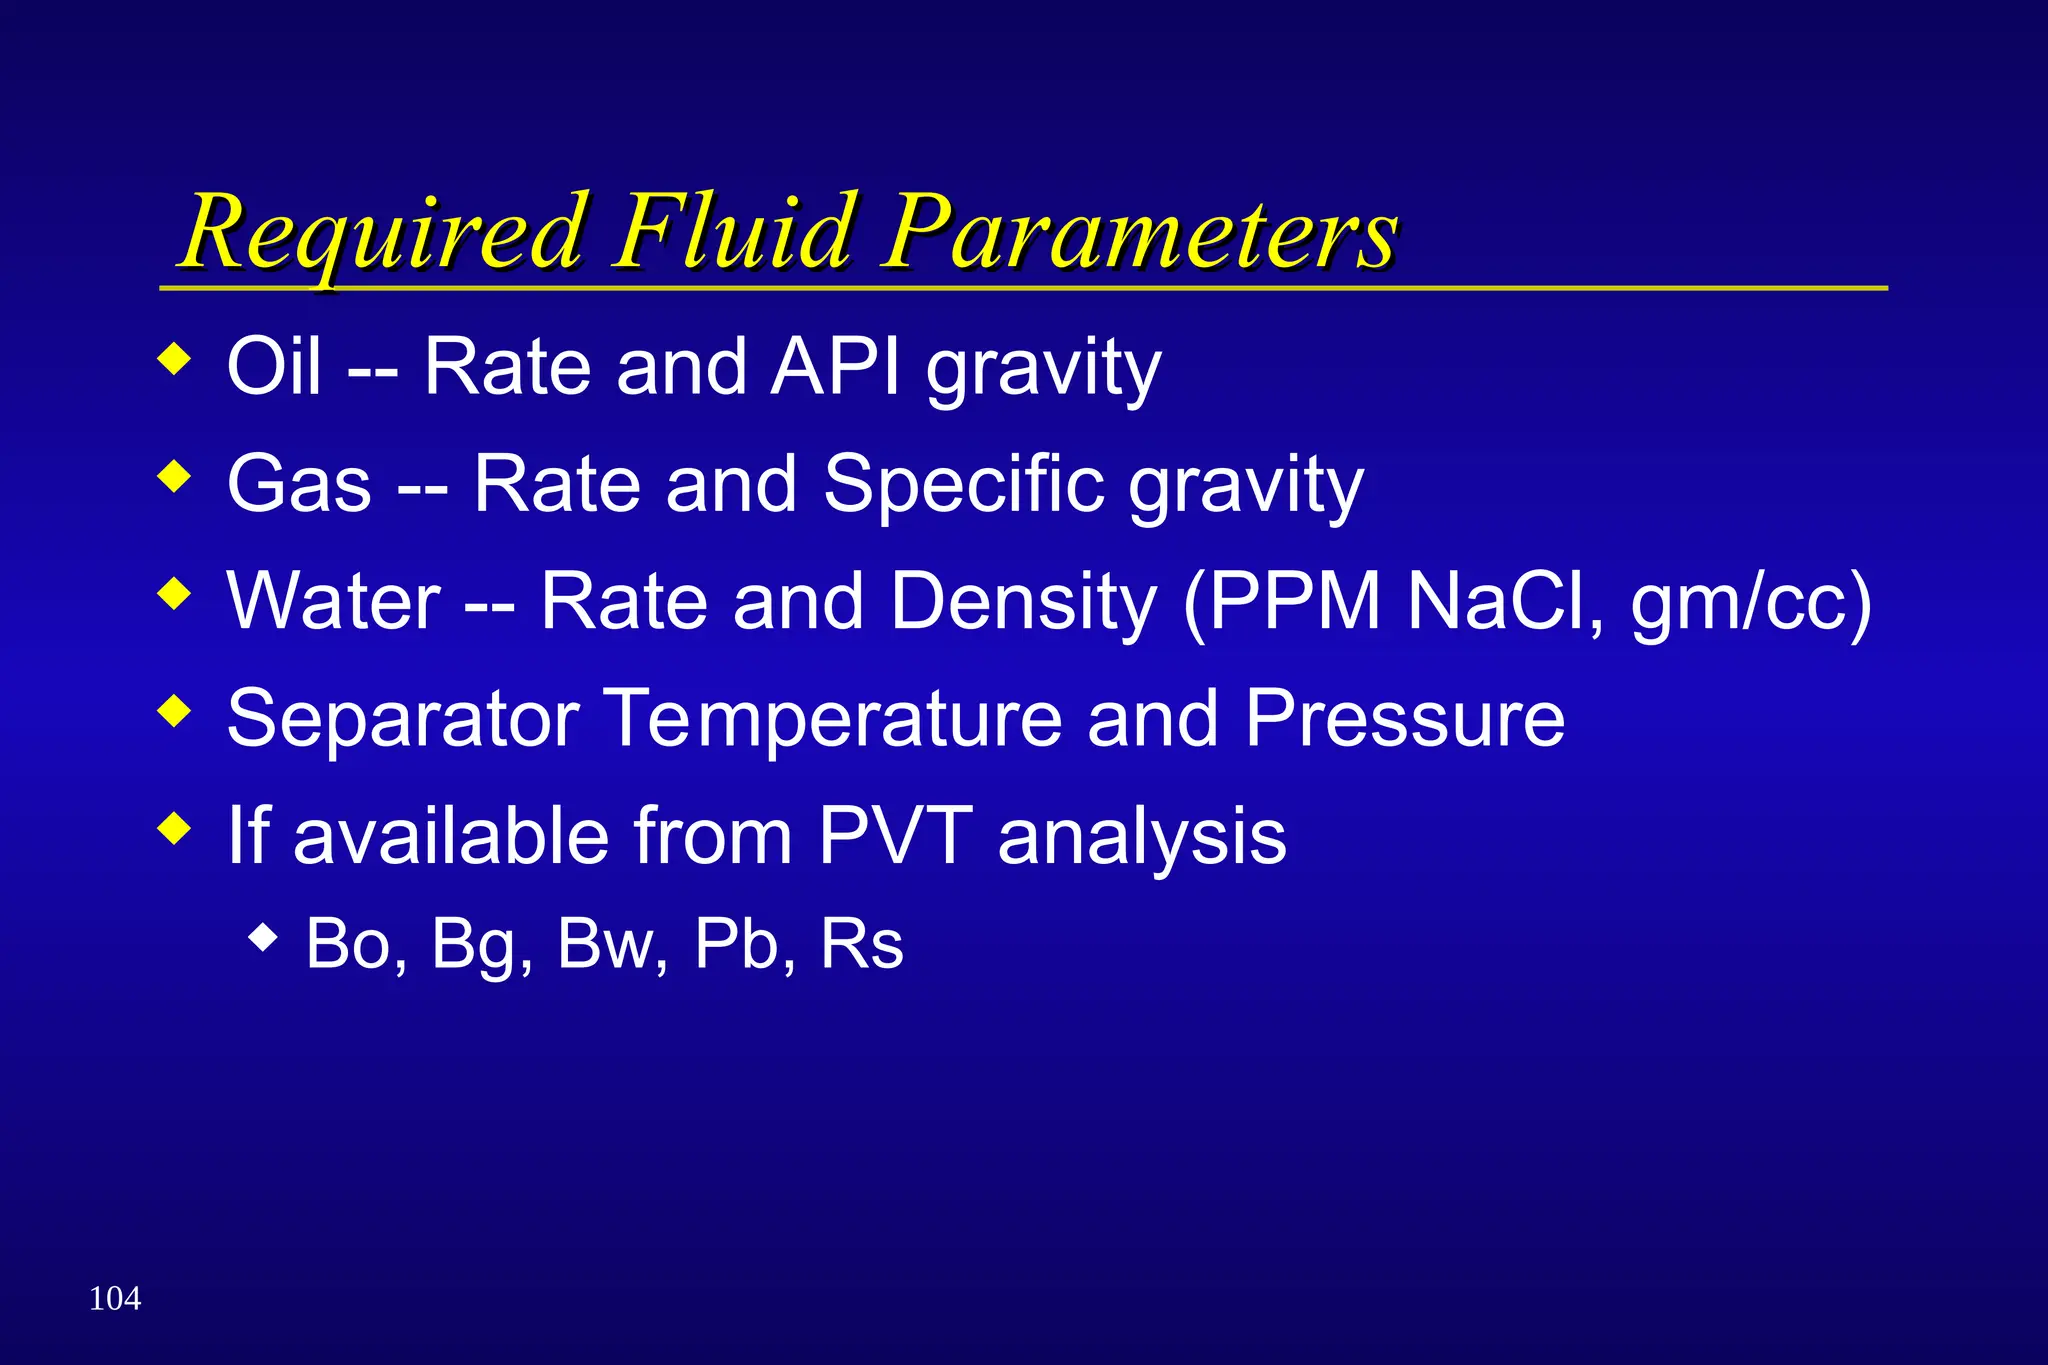
Required Fluid Parameters
RequiredFluid Parameters
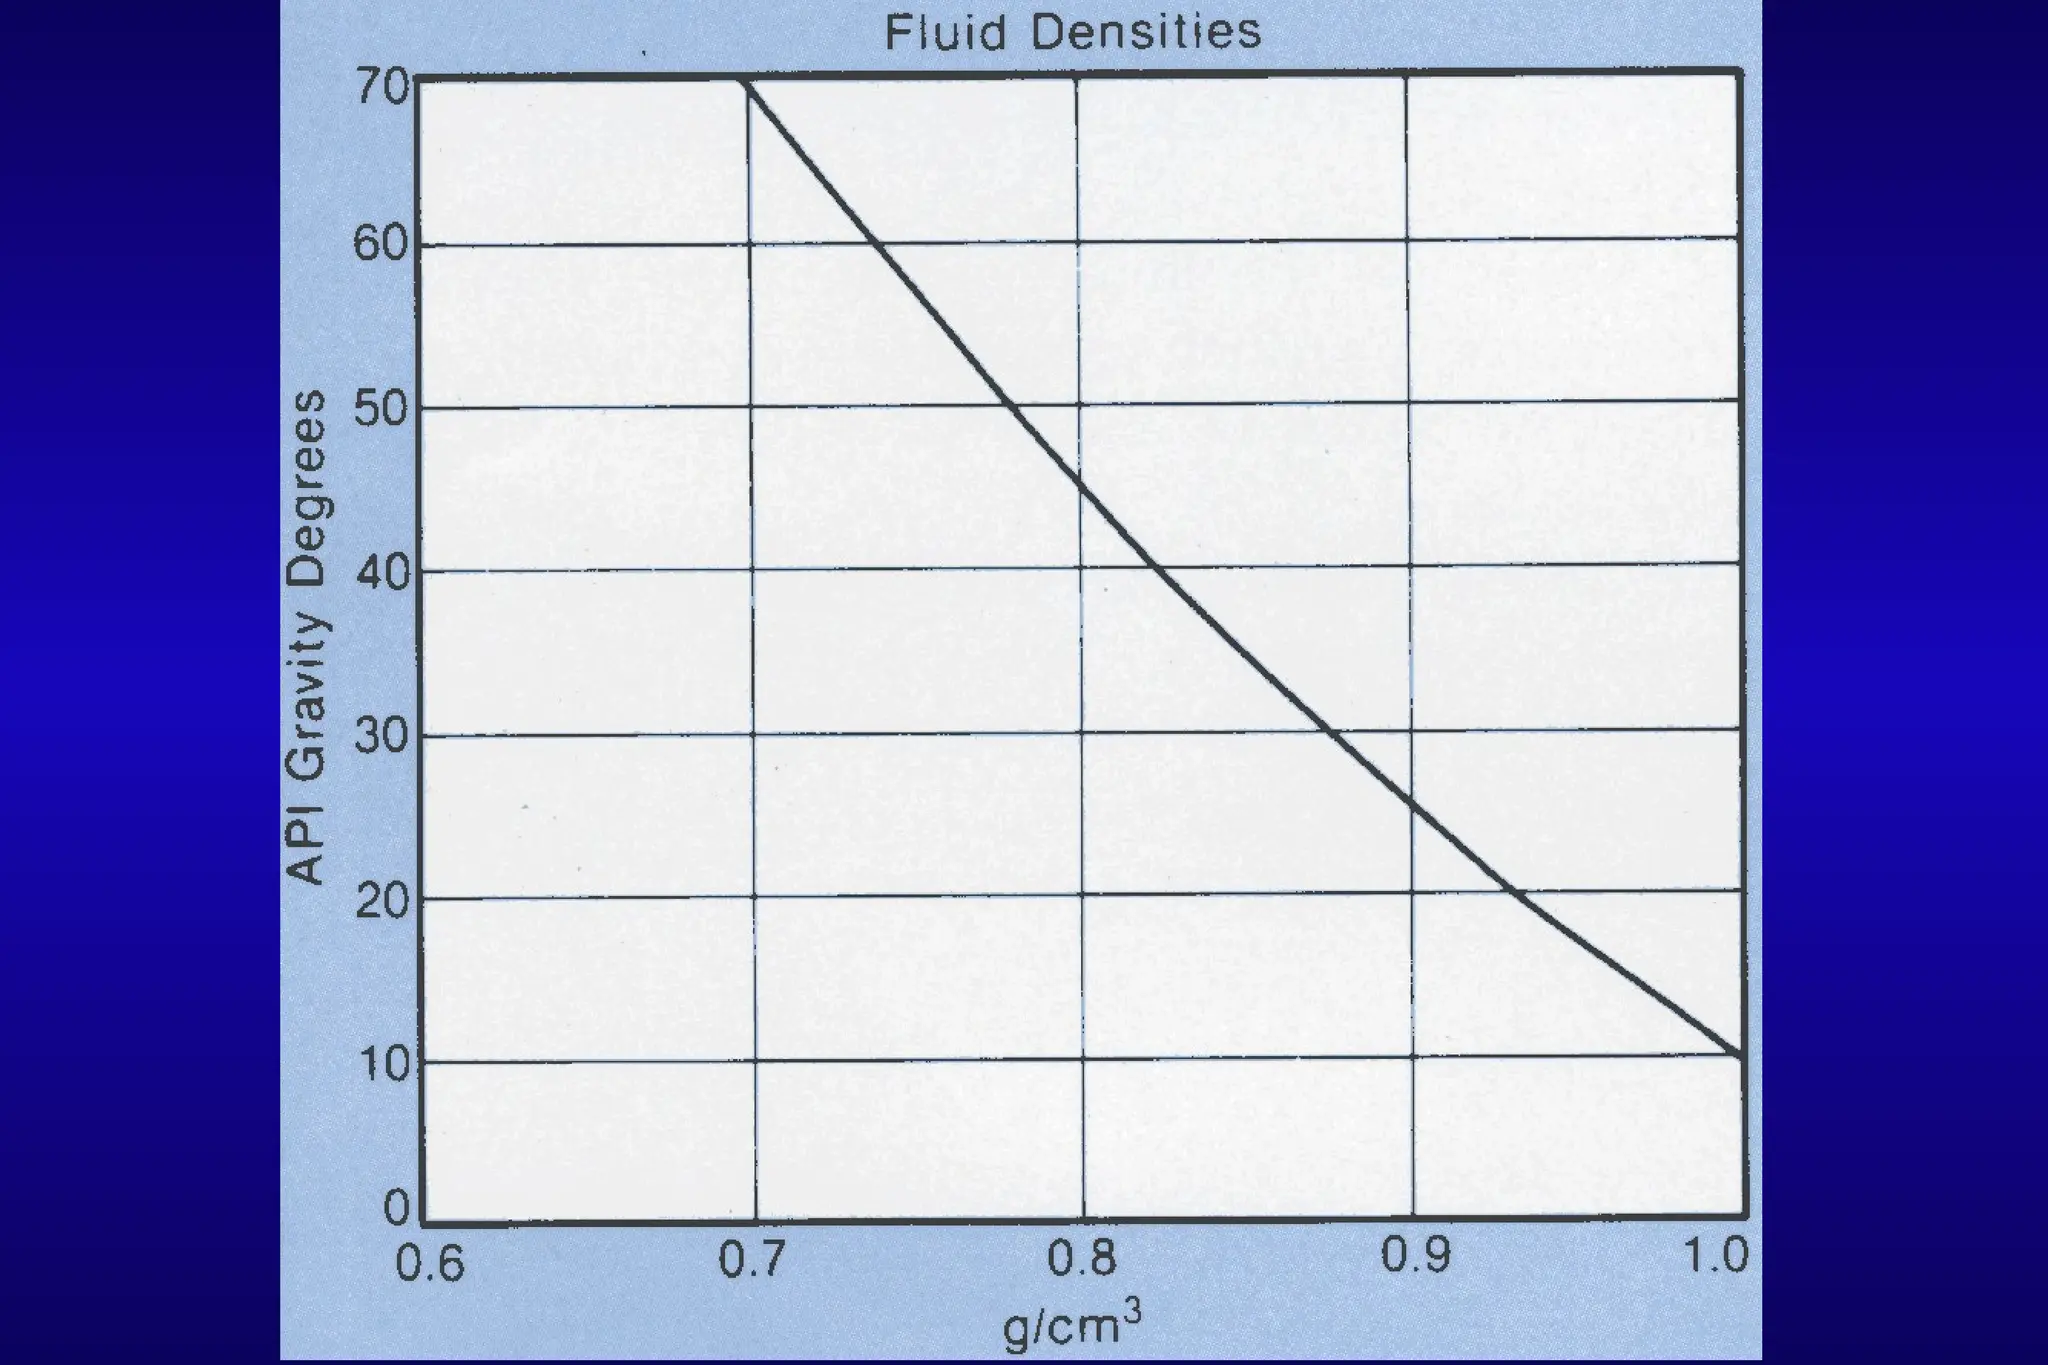
Oil -- Rate and API gravity
Gas -- Rate and Specific gravity
Water -- Rate and Density (PPM NaCl, gm/cc)
Separator Temperature and Pressure
If available from PVT analysis
Bo, Bg, Bw, Pb, Rs
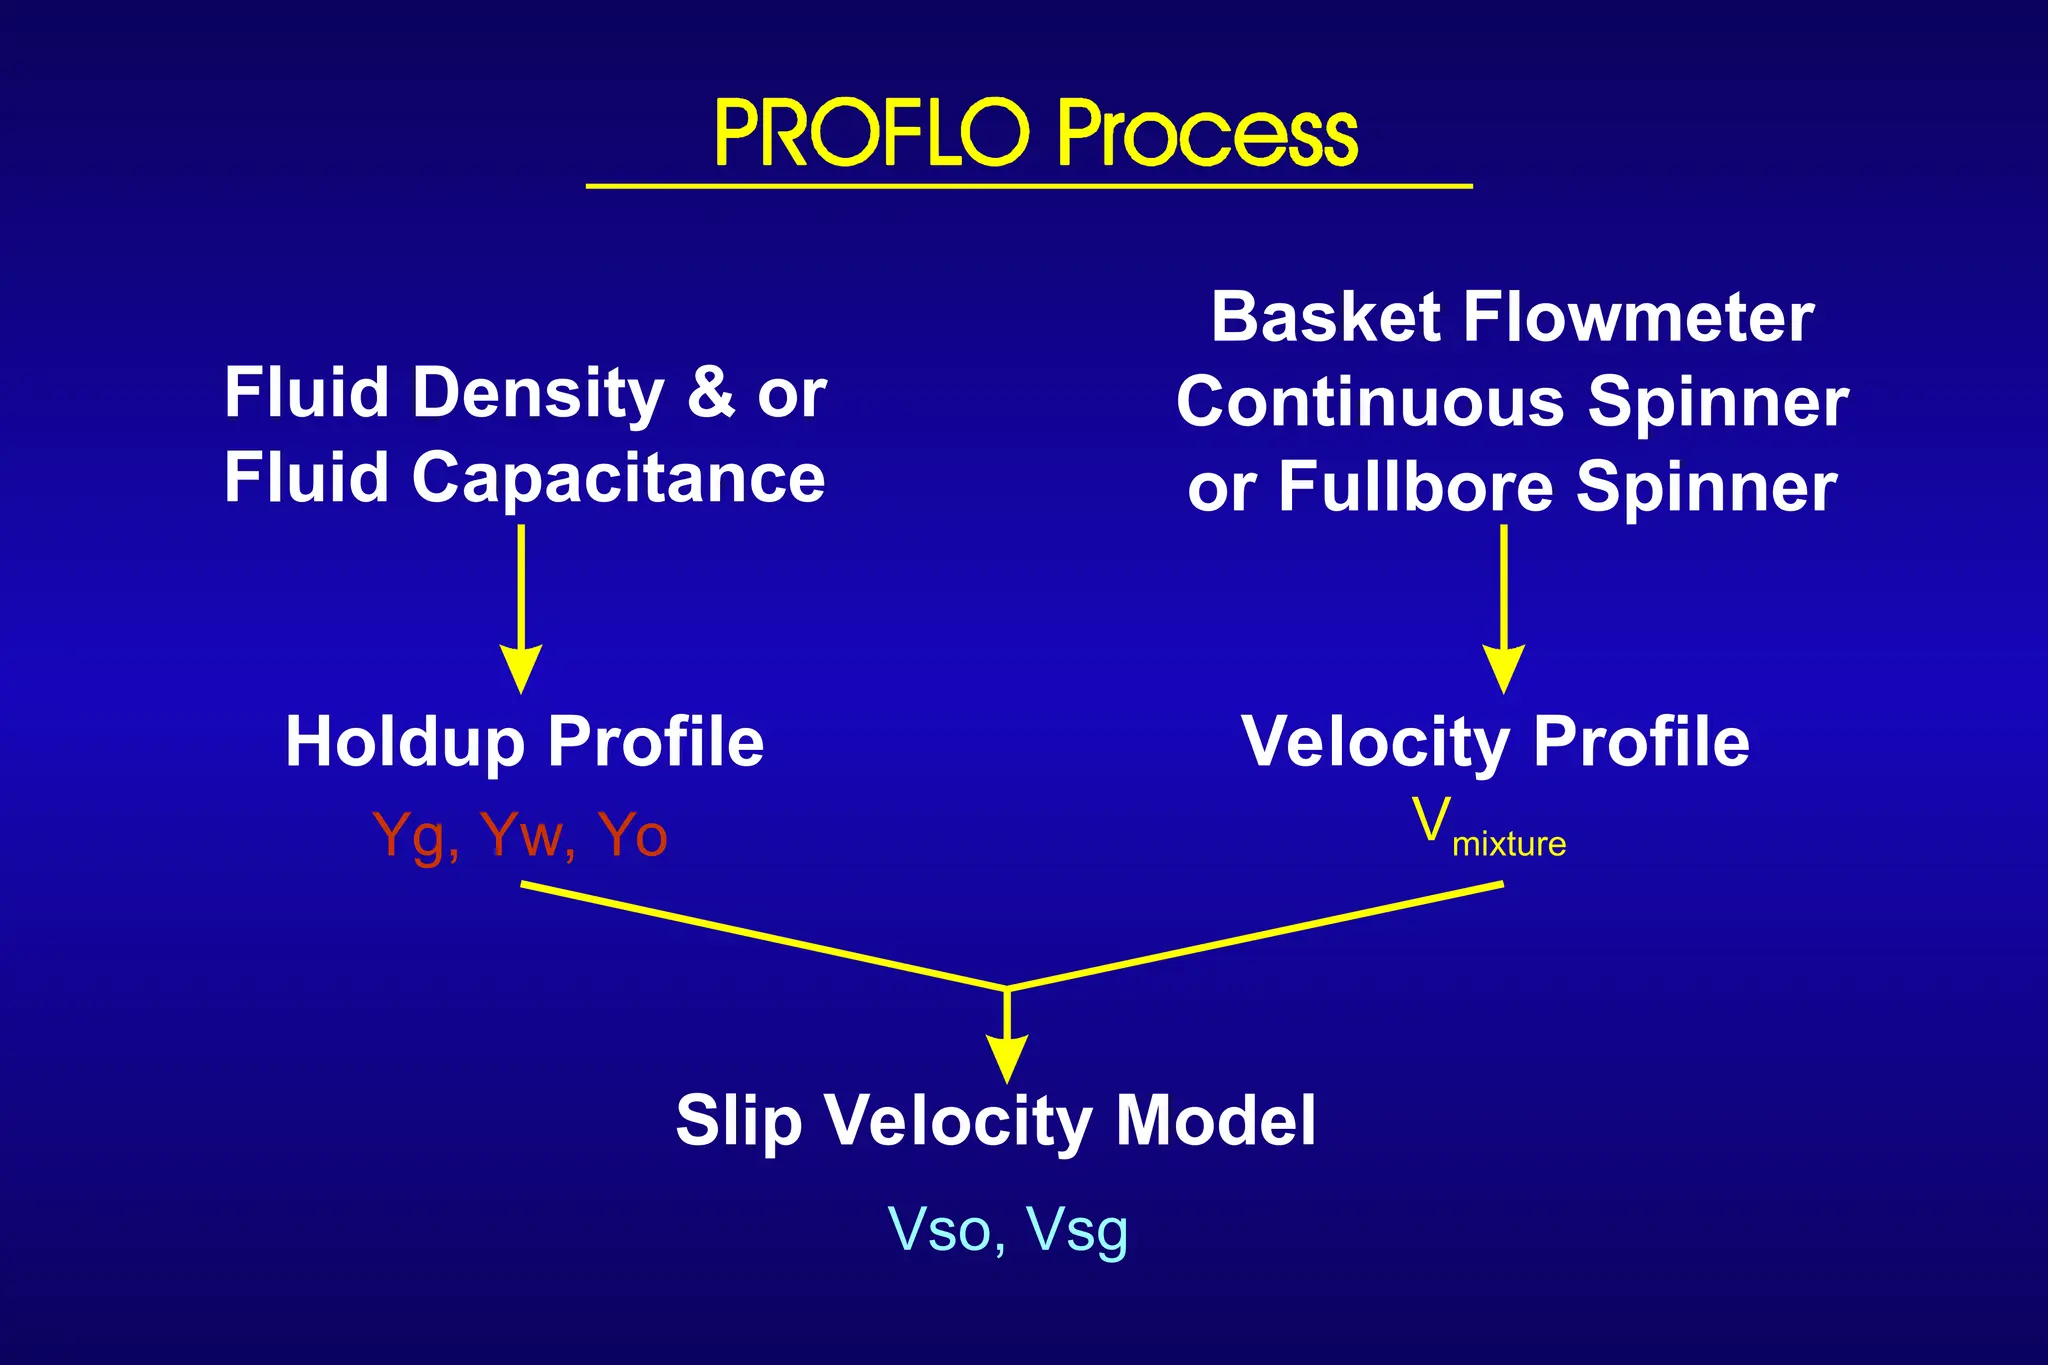
Basket Flowmeter
Continuous Spinner
orFullbore Spinner
Slip Velocity Model
Fluid Density & or
Fluid Capacitance
Holdup Profile Velocity Profile
Vmixture
Vso, Vsg
Yg, Yw, Yo
103.
V V VY V Y
V V V
V V V
w mixt sg g so o
o w so
g w sg
Q V Y K
Q V Y K
Q V Y K
w w w
o o o
g g g
K ID
14 2
.
104.
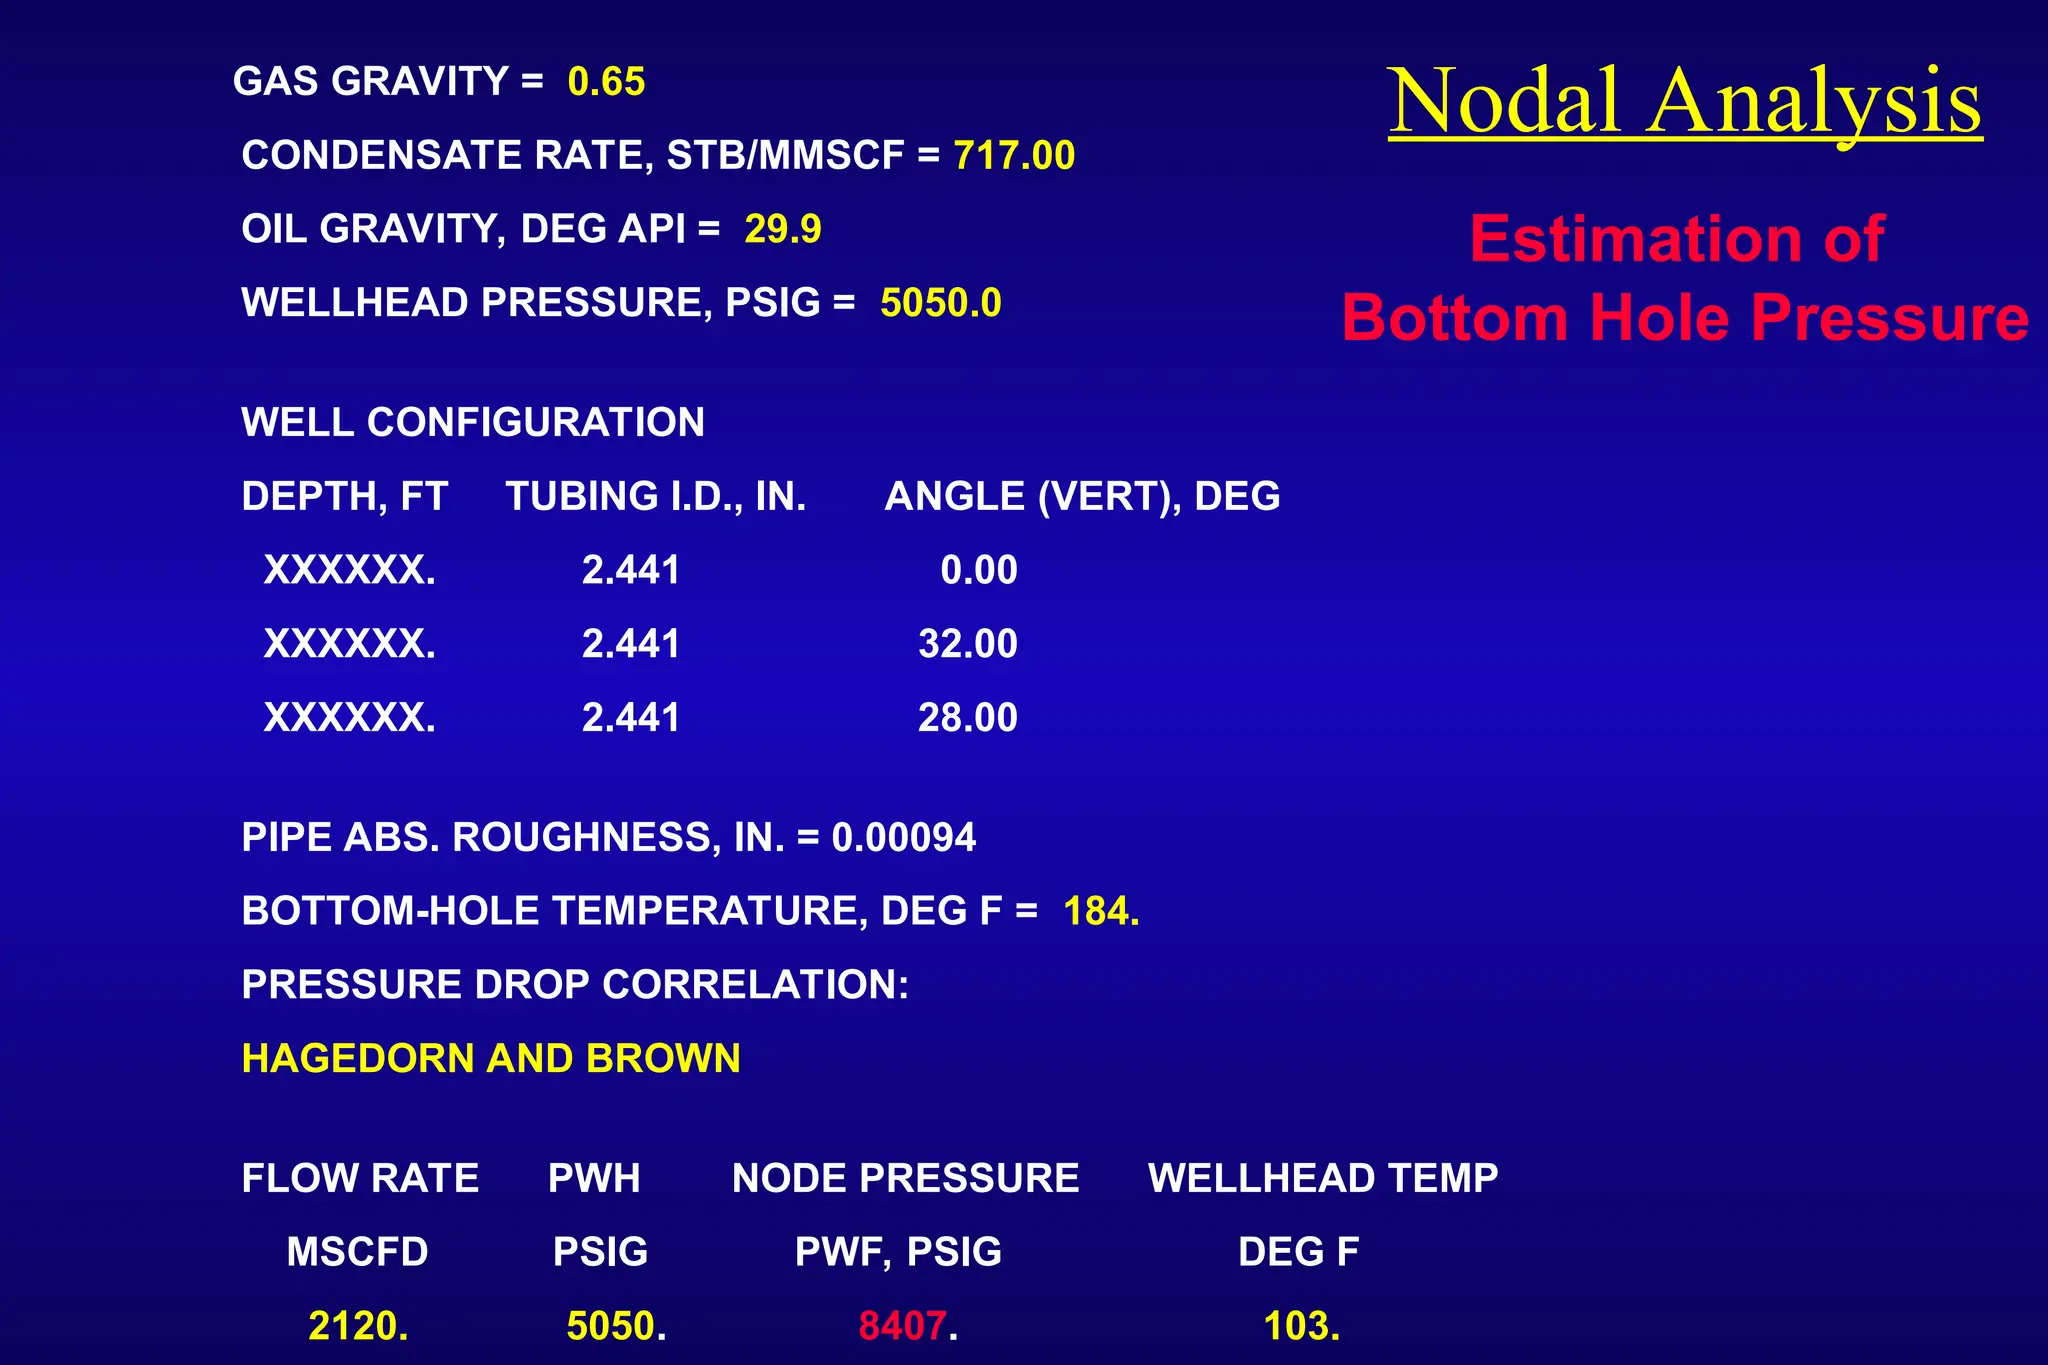
GAS GRAVITY =0.65
CONDENSATE RATE, STB/MMSCF = 717.00
OIL GRAVITY, DEG API = 29.9
WELLHEAD PRESSURE, PSIG = 5050.0
WELL CONFIGURATION
DEPTH, FT TUBING I.D., IN. ANGLE (VERT), DEG
XXXXXX. 2.441 0.00
XXXXXX. 2.441 32.00
XXXXXX. 2.441 28.00
PIPE ABS. ROUGHNESS, IN. = 0.00094
BOTTOM-HOLE TEMPERATURE, DEG F = 184.
PRESSURE DROP CORRELATION:
HAGEDORN AND BROWN
FLOW RATE PWH NODE PRESSURE WELLHEAD TEMP
MSCFD PSIG PWF, PSIG DEG F
2120. 5050. 8407. 103.
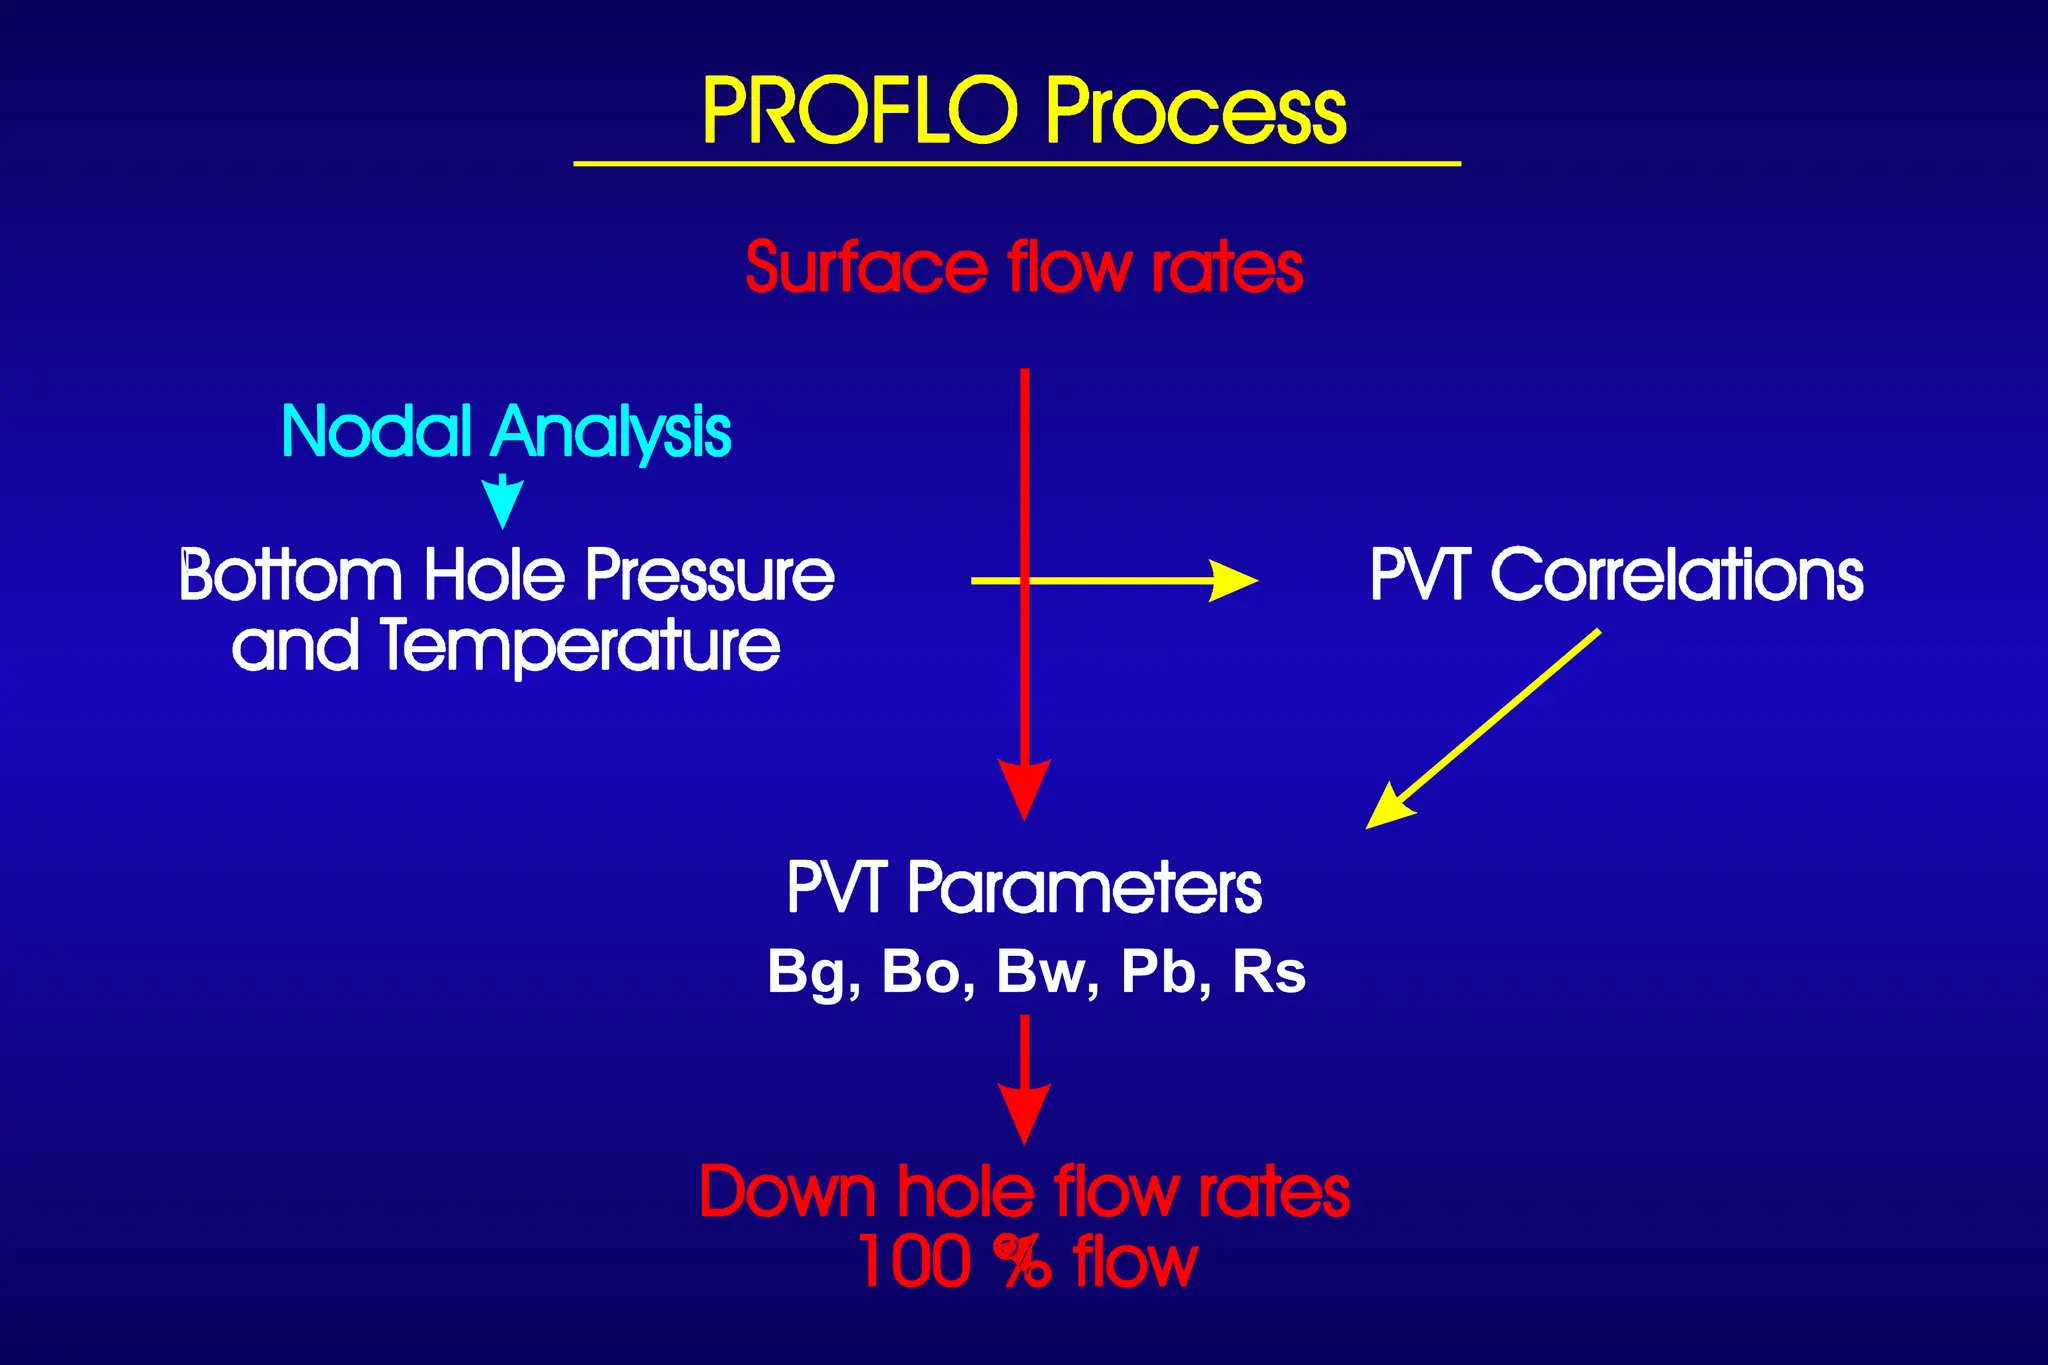
Nodal Analysis
Estimation of
Bottom Hole Pressure
105.
110
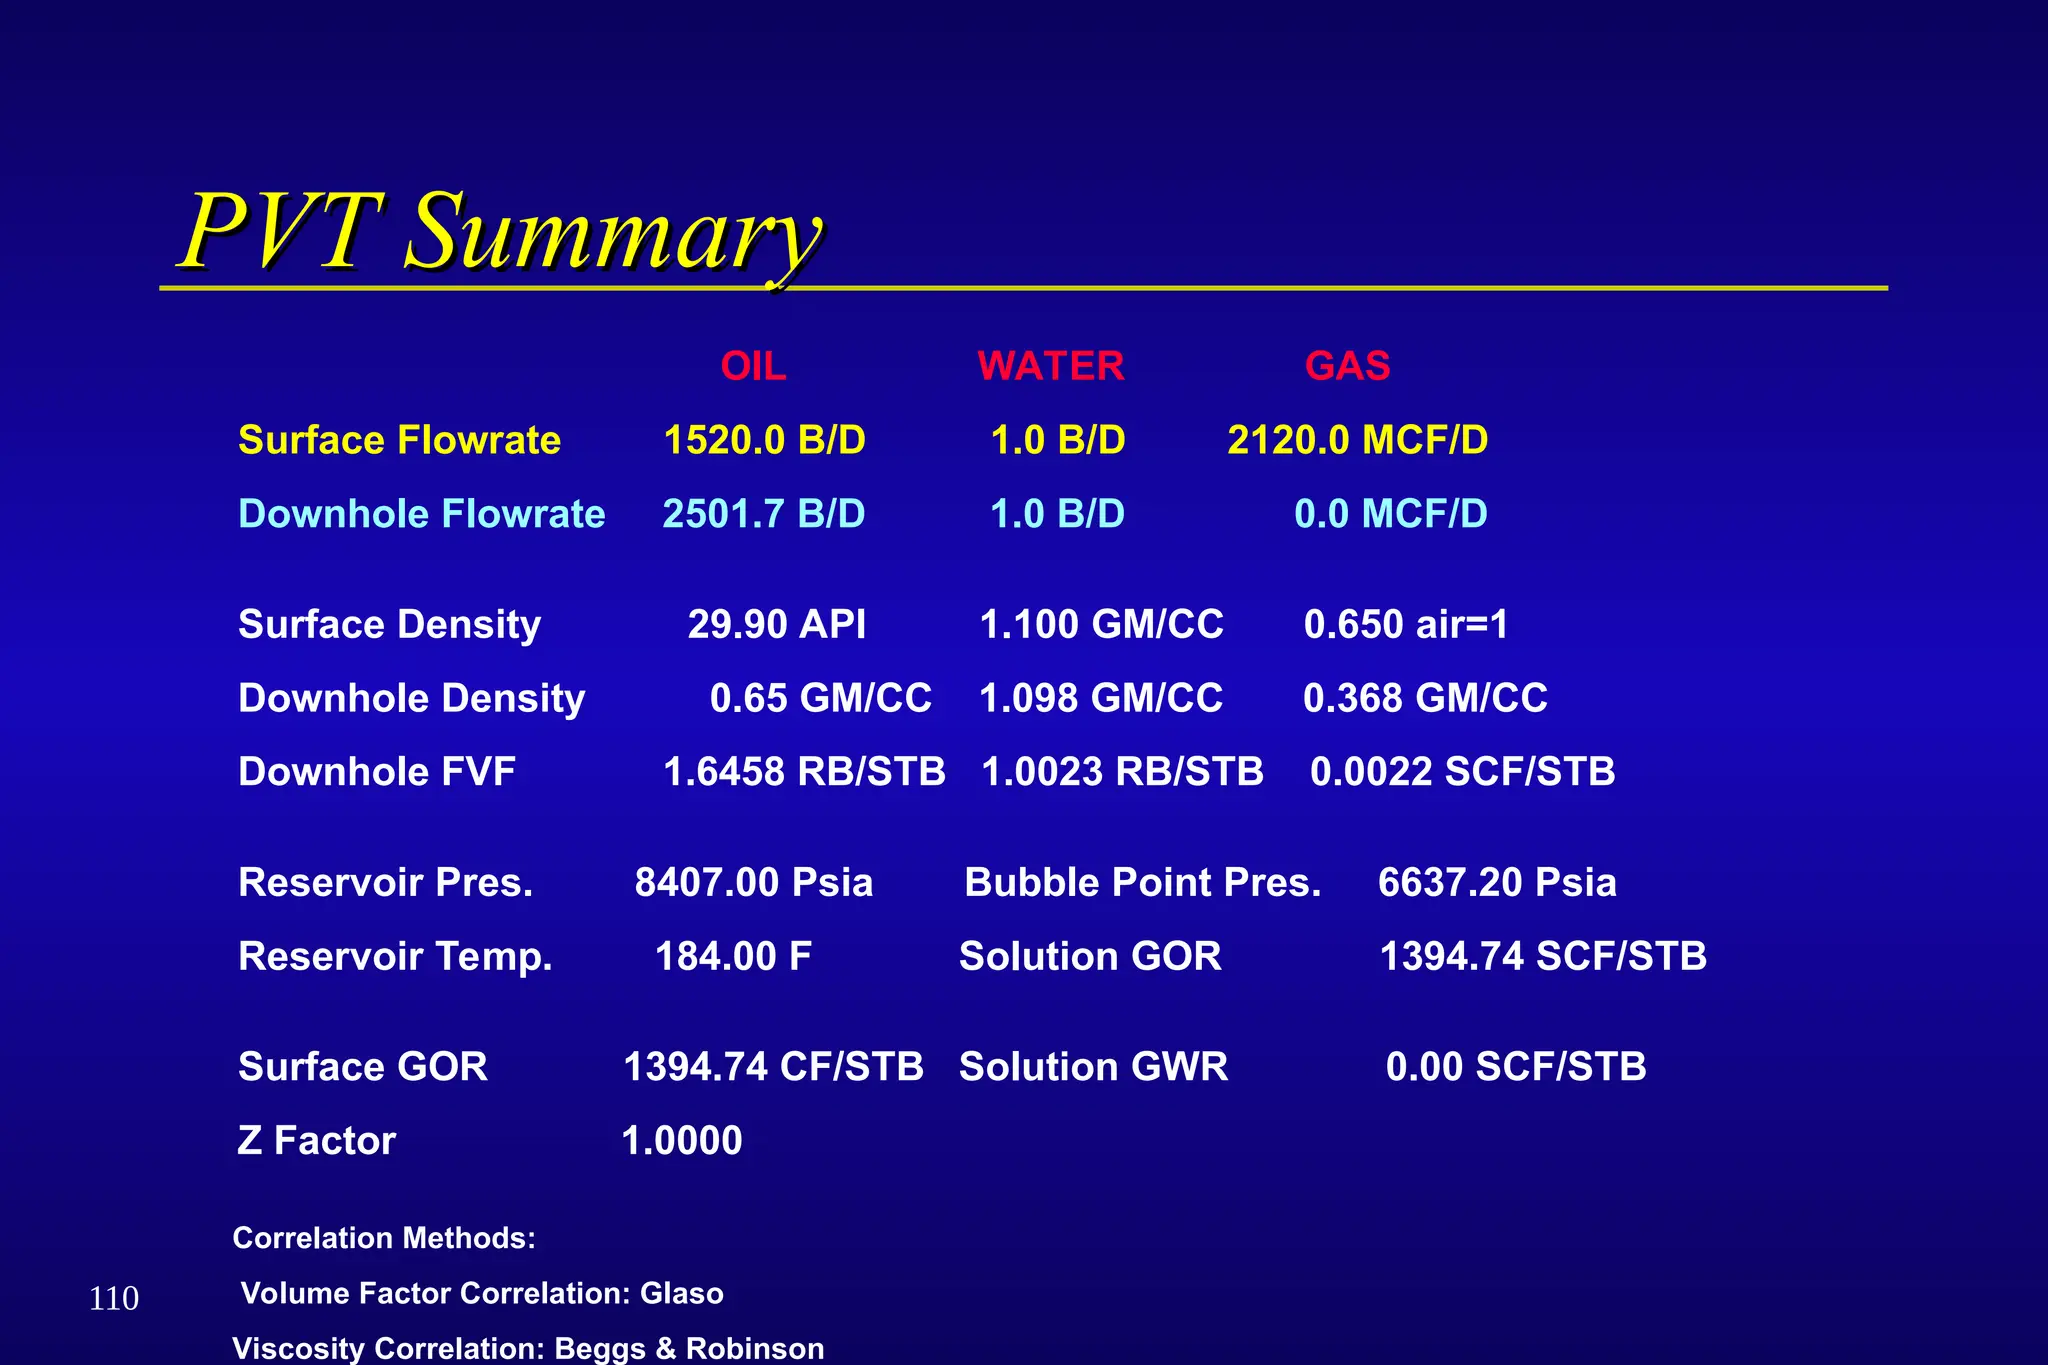
OIL WATER GAS
SurfaceFlowrate 1520.0 B/D 1.0 B/D 2120.0 MCF/D
Downhole Flowrate 2501.7 B/D 1.0 B/D 0.0 MCF/D
Surface Density 29.90 API 1.100 GM/CC 0.650 air=1
Downhole Density 0.65 GM/CC 1.098 GM/CC 0.368 GM/CC
Downhole FVF 1.6458 RB/STB 1.0023 RB/STB 0.0022 SCF/STB
Reservoir Pres. 8407.00 Psia Bubble Point Pres. 6637.20 Psia
Reservoir Temp. 184.00 F Solution GOR 1394.74 SCF/STB
Surface GOR 1394.74 CF/STB Solution GWR 0.00 SCF/STB
Z Factor 1.0000
Correlation Methods:
Volume Factor Correlation: Glaso
Viscosity Correlation: Beggs & Robinson
PVT Summary
PVT Summary
106.
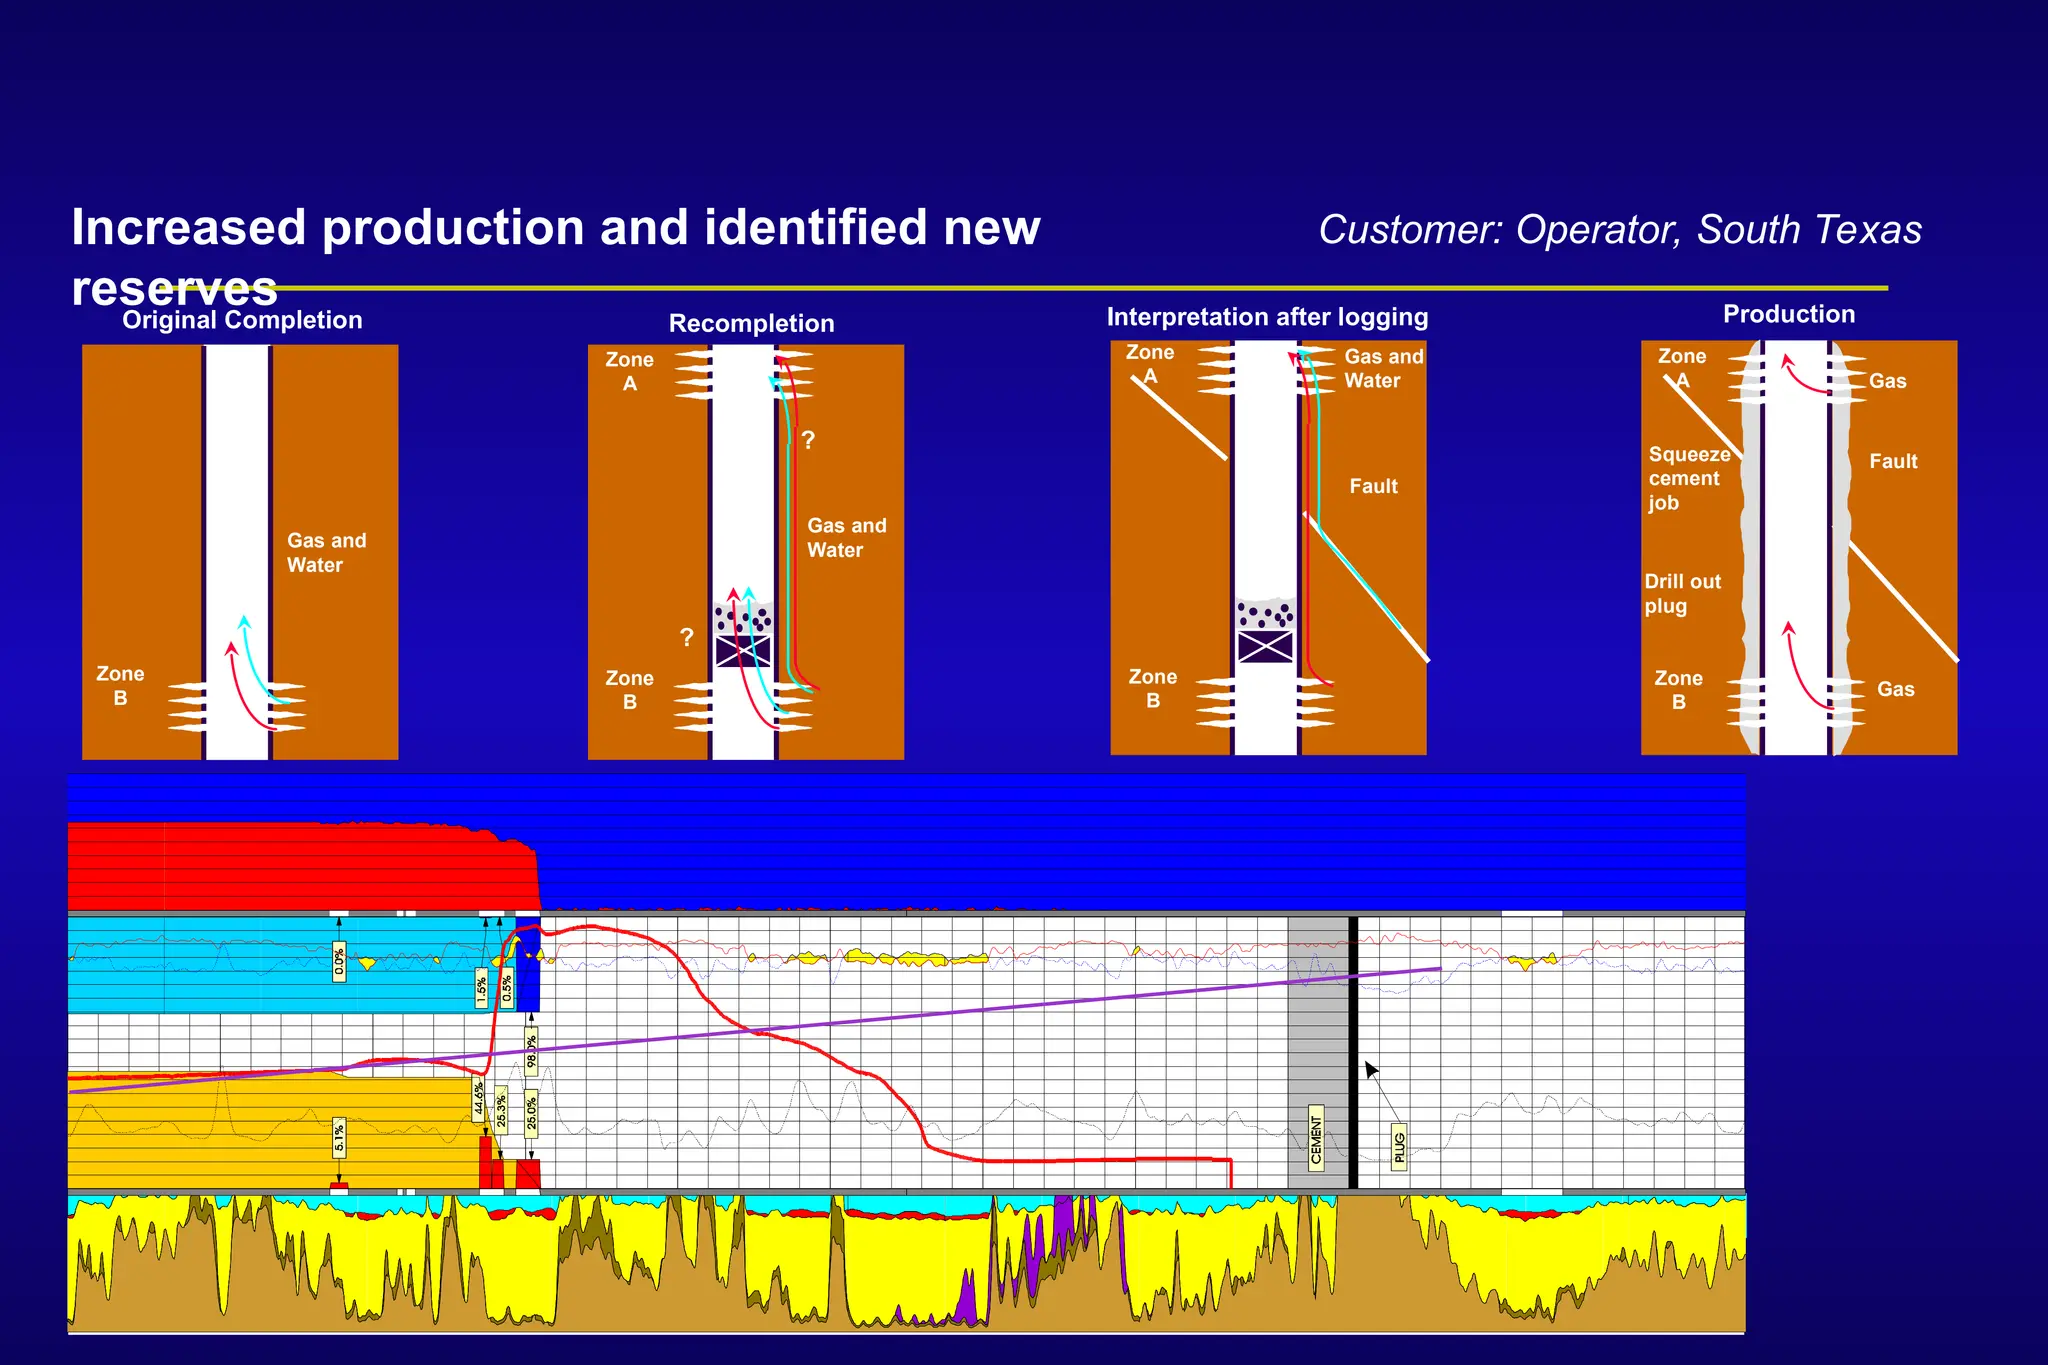
Customer: Operator, SouthTexas
Increased production and identified new
reserves
Gas and
Water
Original Completion
Zone
B
Gas and
Water
?
?
Recompletion
Zone
B
Zone
A
?
Gas and
Water
Fault
Interpretation after logging
Zone
B
Zone
A Gas
Squeeze
cement
job
Gas
Drill out
plug
Production
Zone
A
Zone
B
Fault
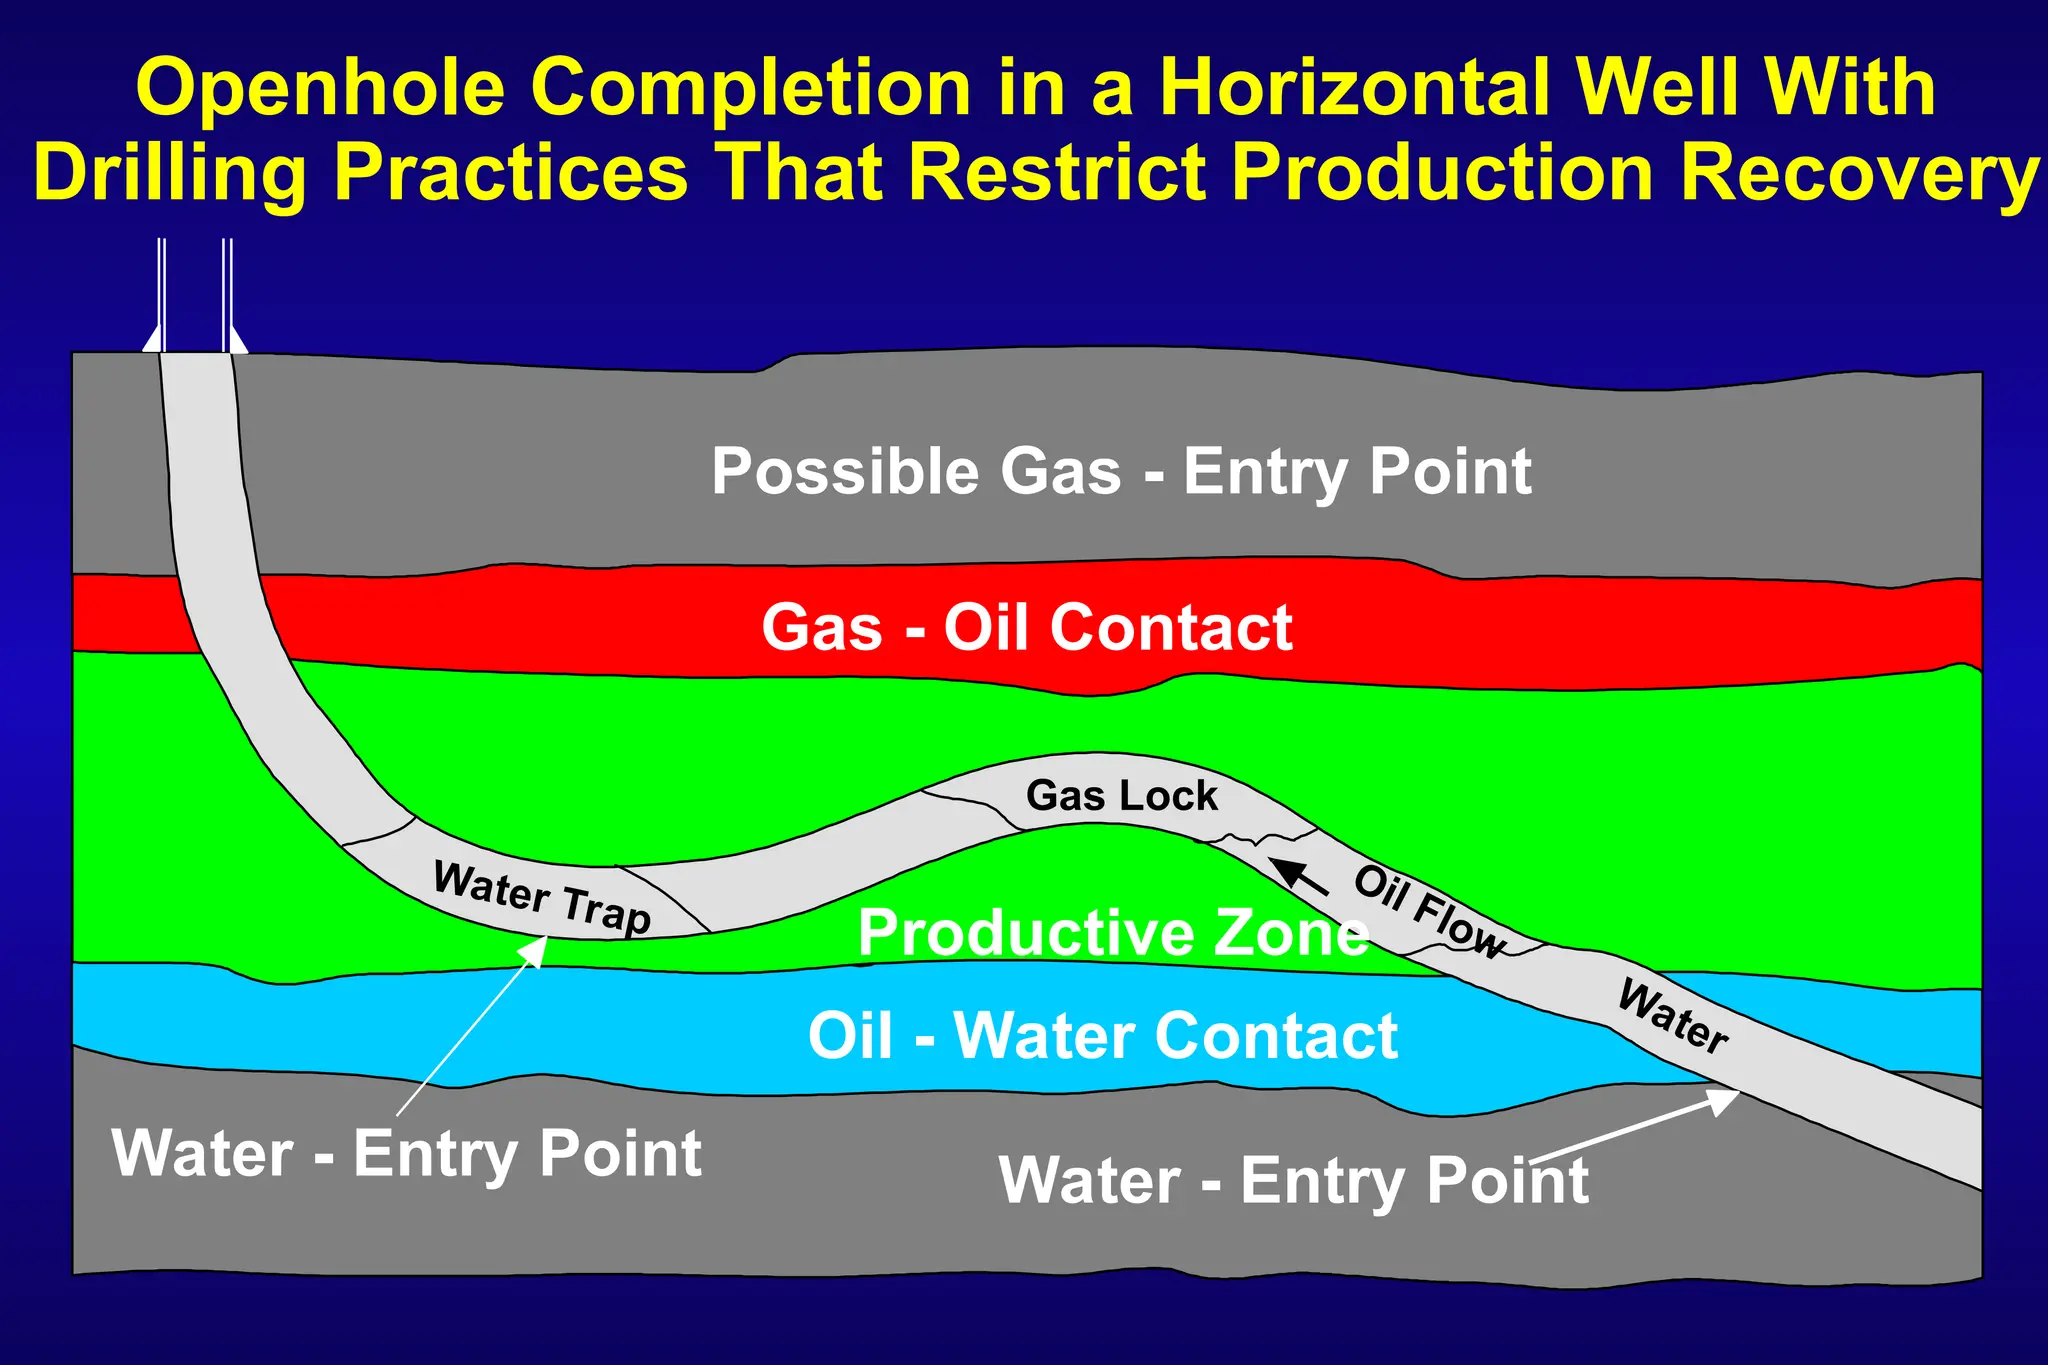
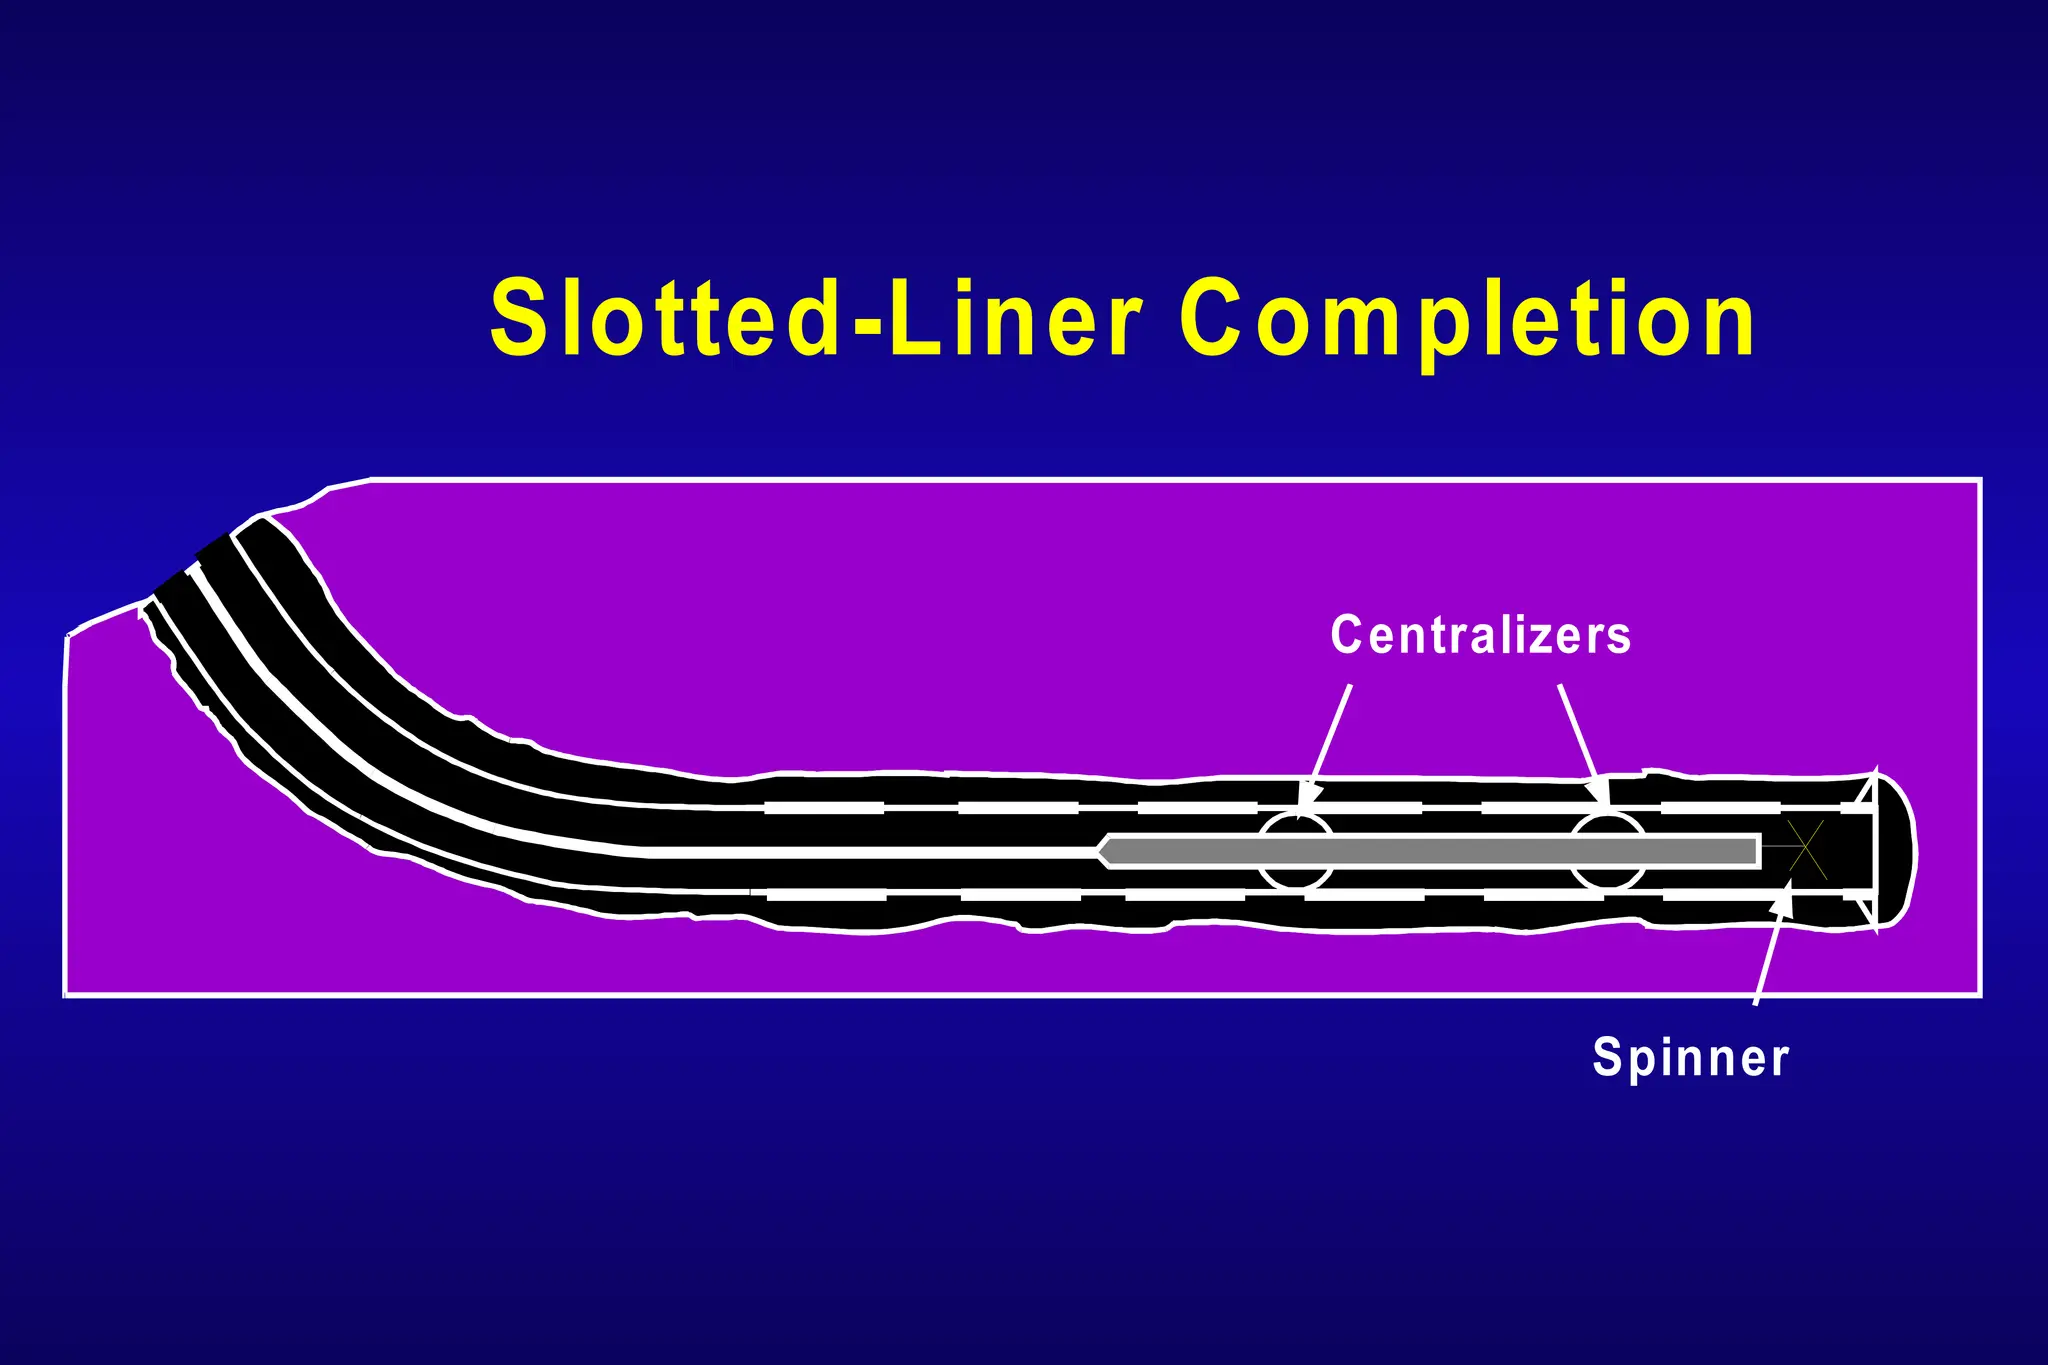
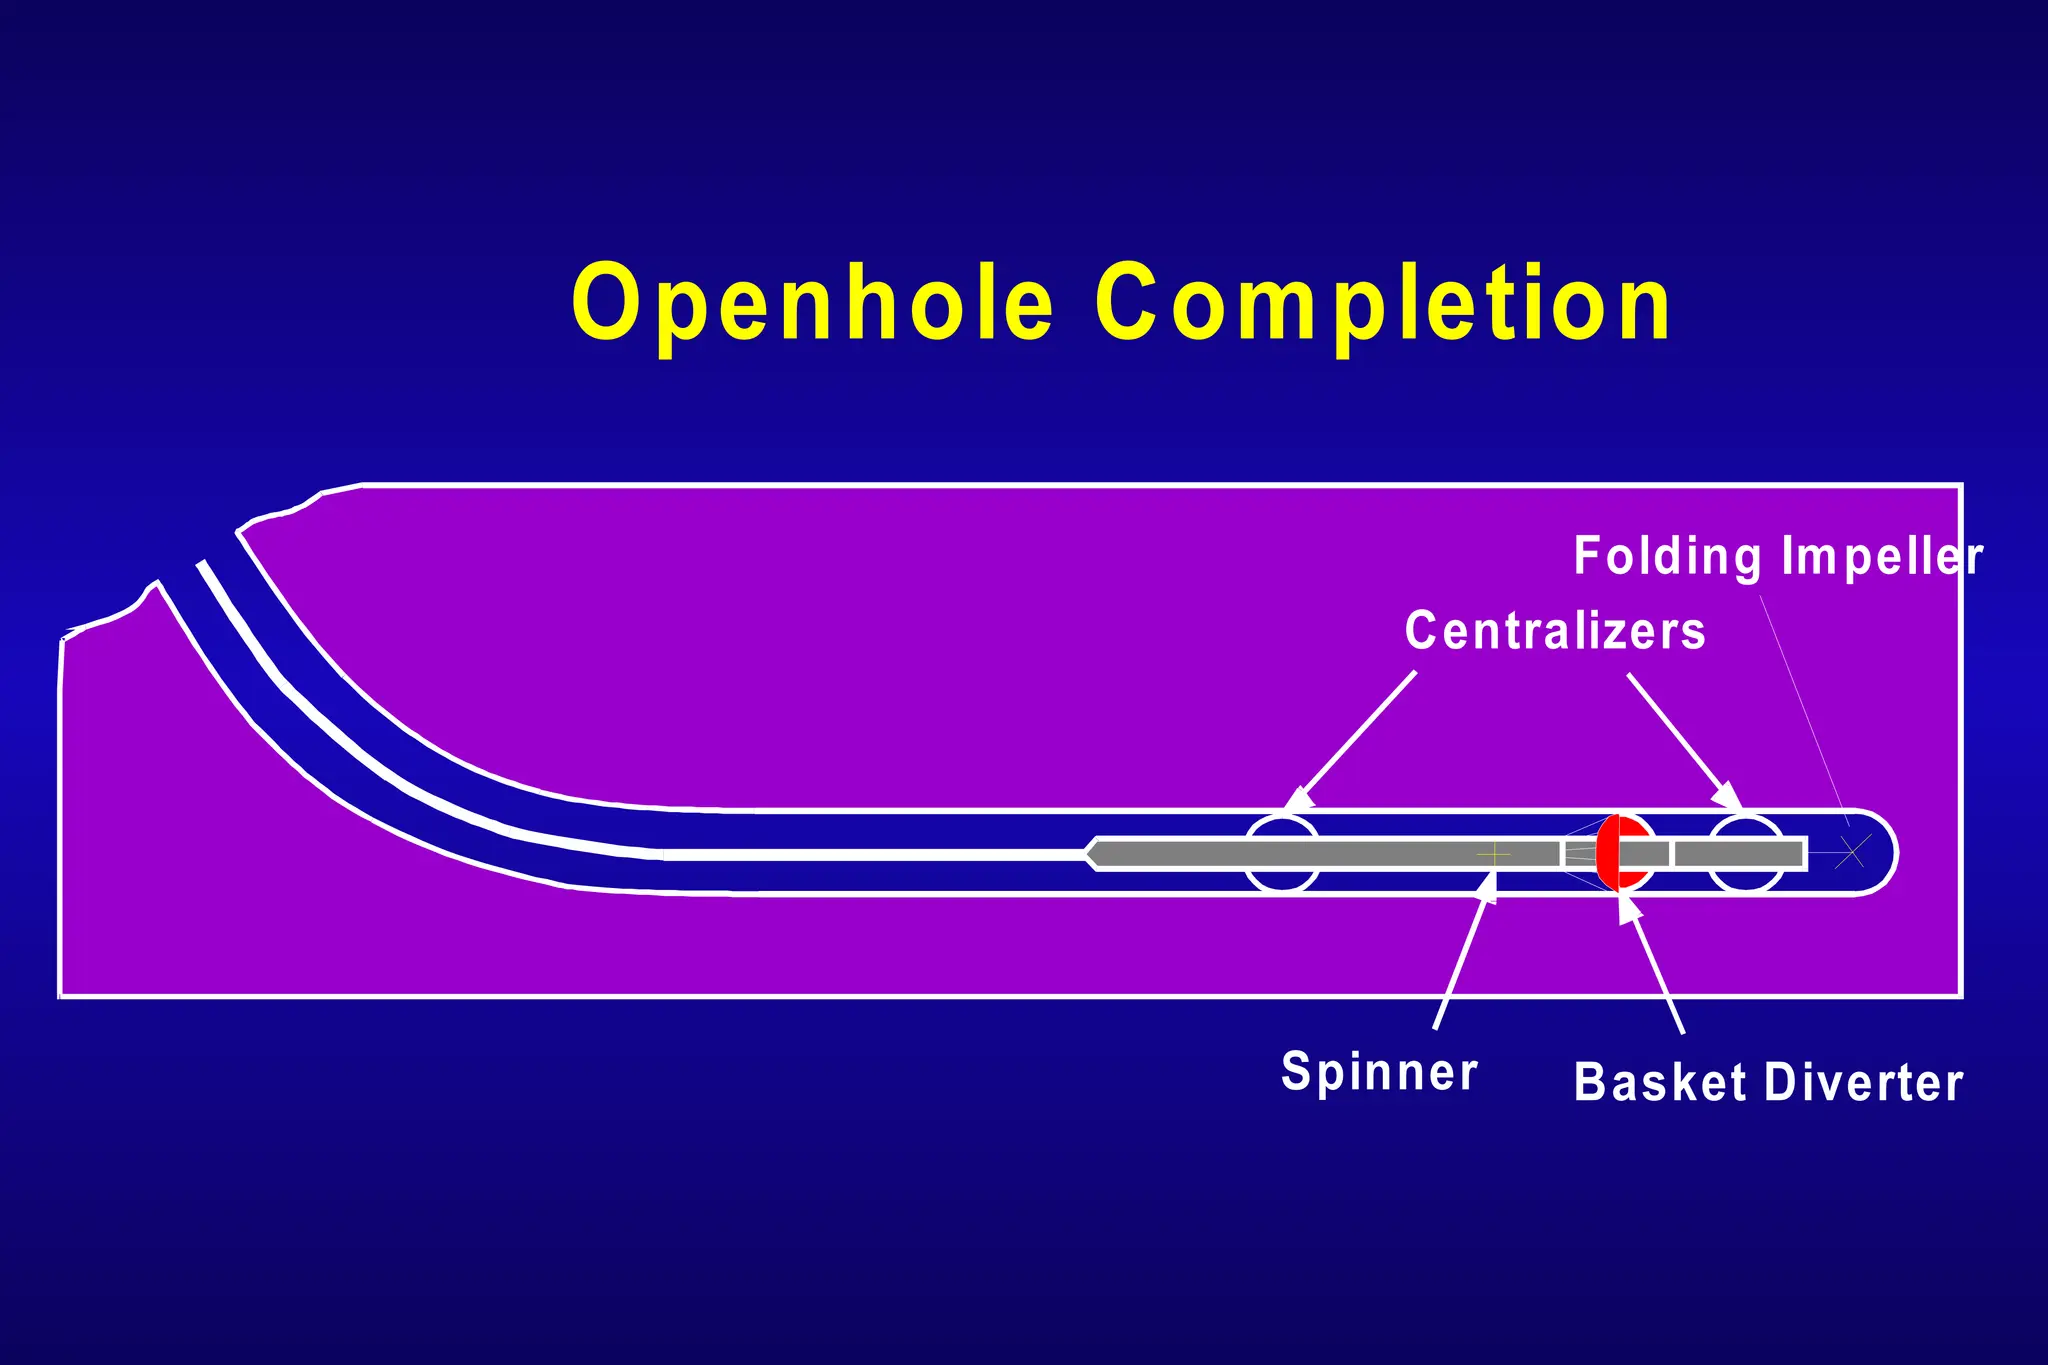
Openhole Completion ina Horizontal Well With
Drilling Practices That Restrict Production Recovery
Possible Gas - Entry Point
Gas - Oil Contact
Productive Zone
Oil - Water Contact
Water - Entry Point
Water - Entry Point
Water Trap
Gas Lock
Oil Flow
Water
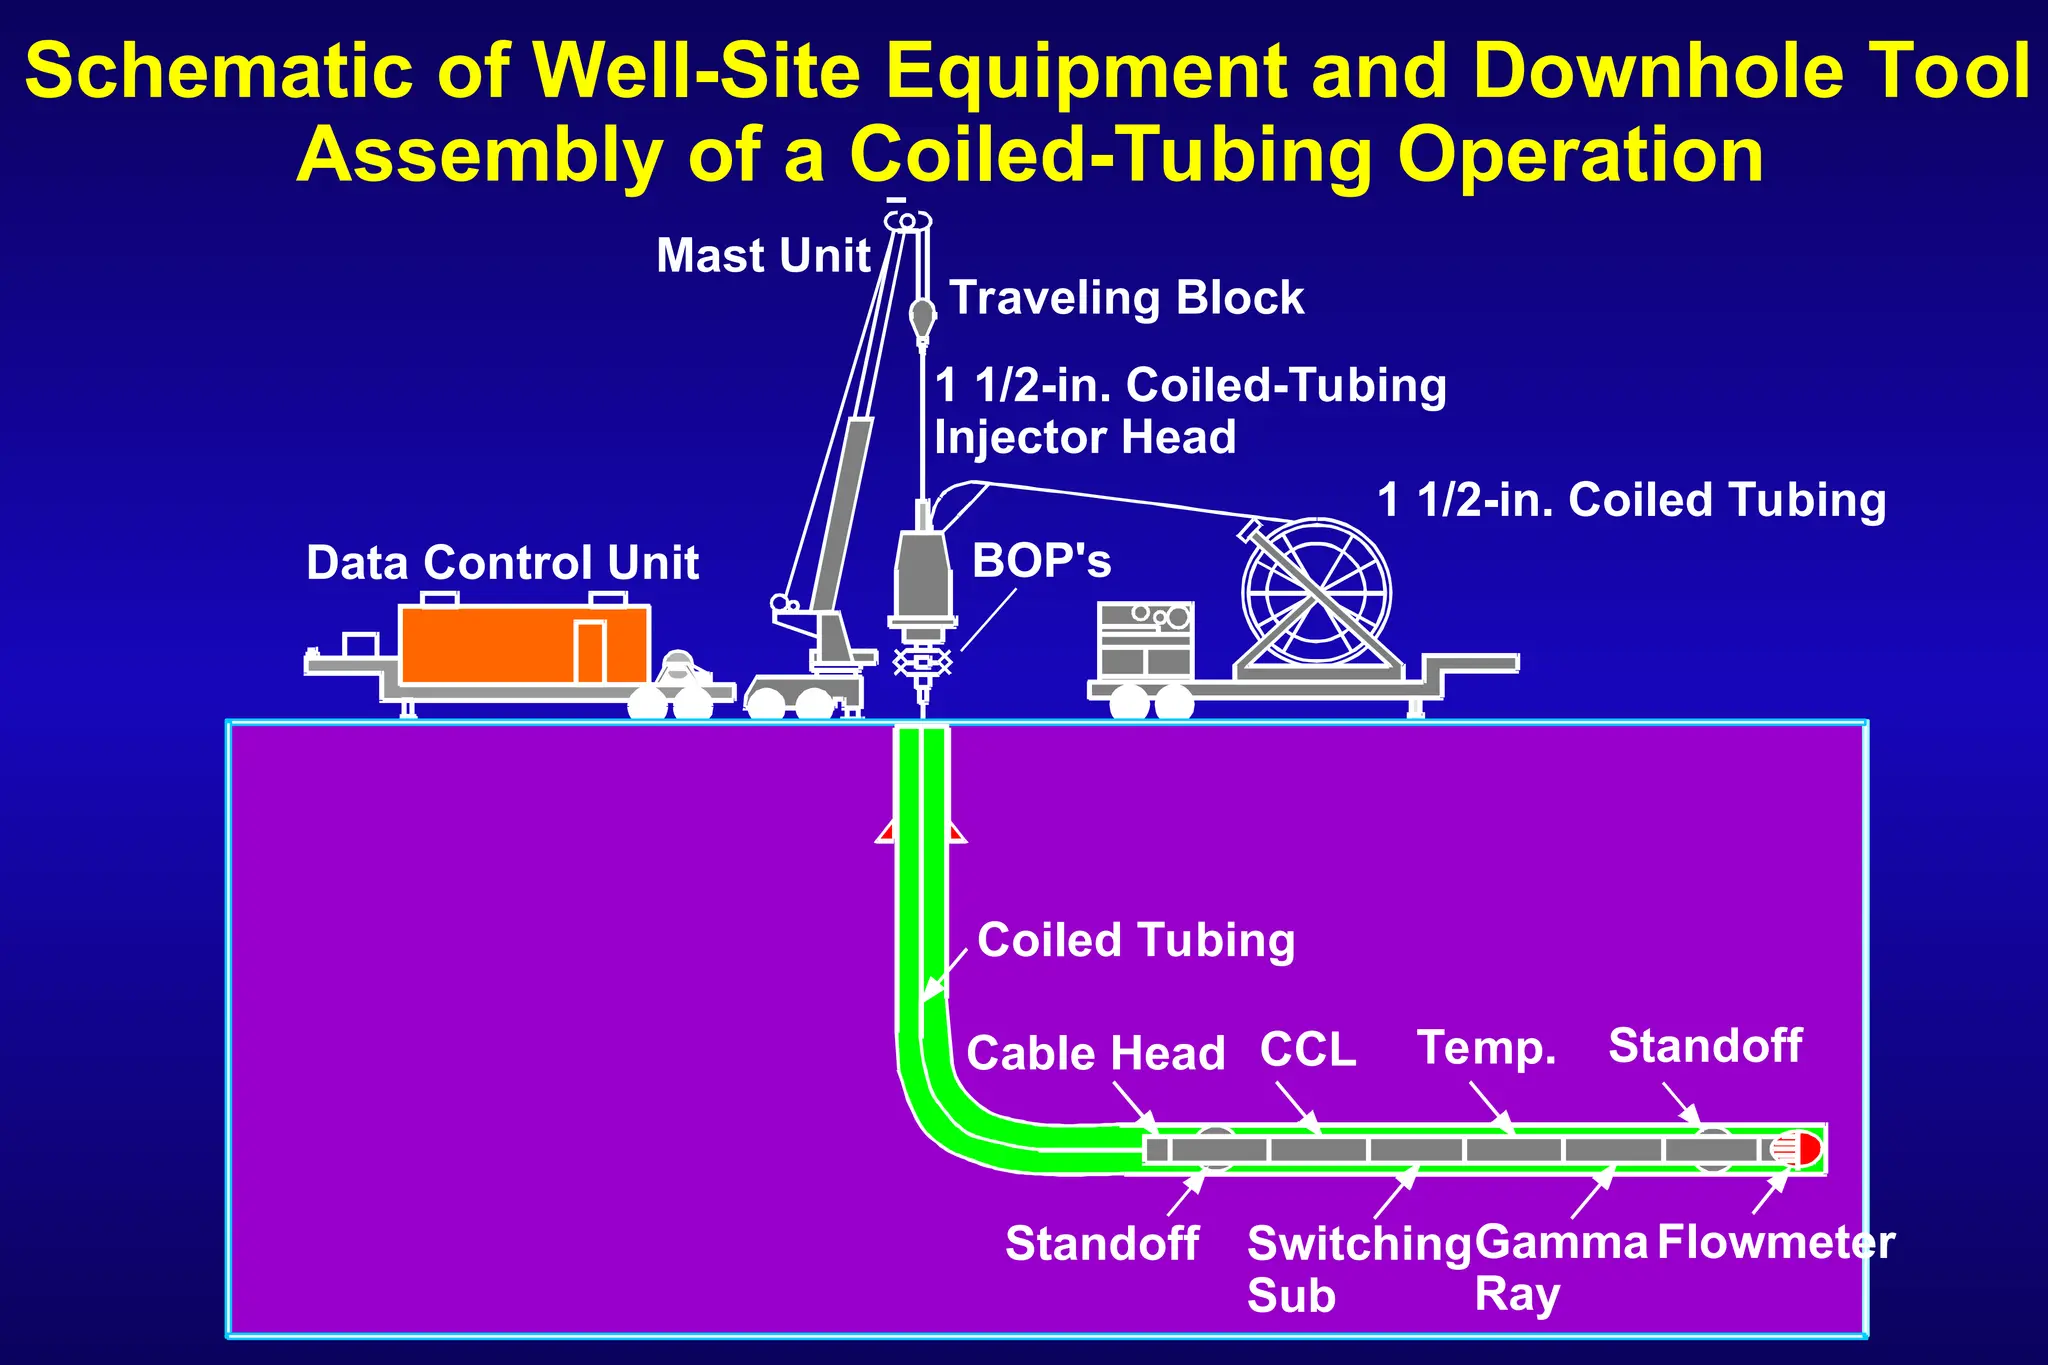
Data Control Unit
MastUnit
Traveling Block
1 1/2-in. Coiled-Tubing
Injector Head
1 1/2-in. Coiled Tubing
BOP's
Coiled Tubing
Cable Head CCL Temp. Standoff
Standoff Switching
Sub
Gamma
Ray
Flowmeter
Schematic of Well-Site Equipment and Downhole Tool
Assembly of a Coiled-Tubing Operation
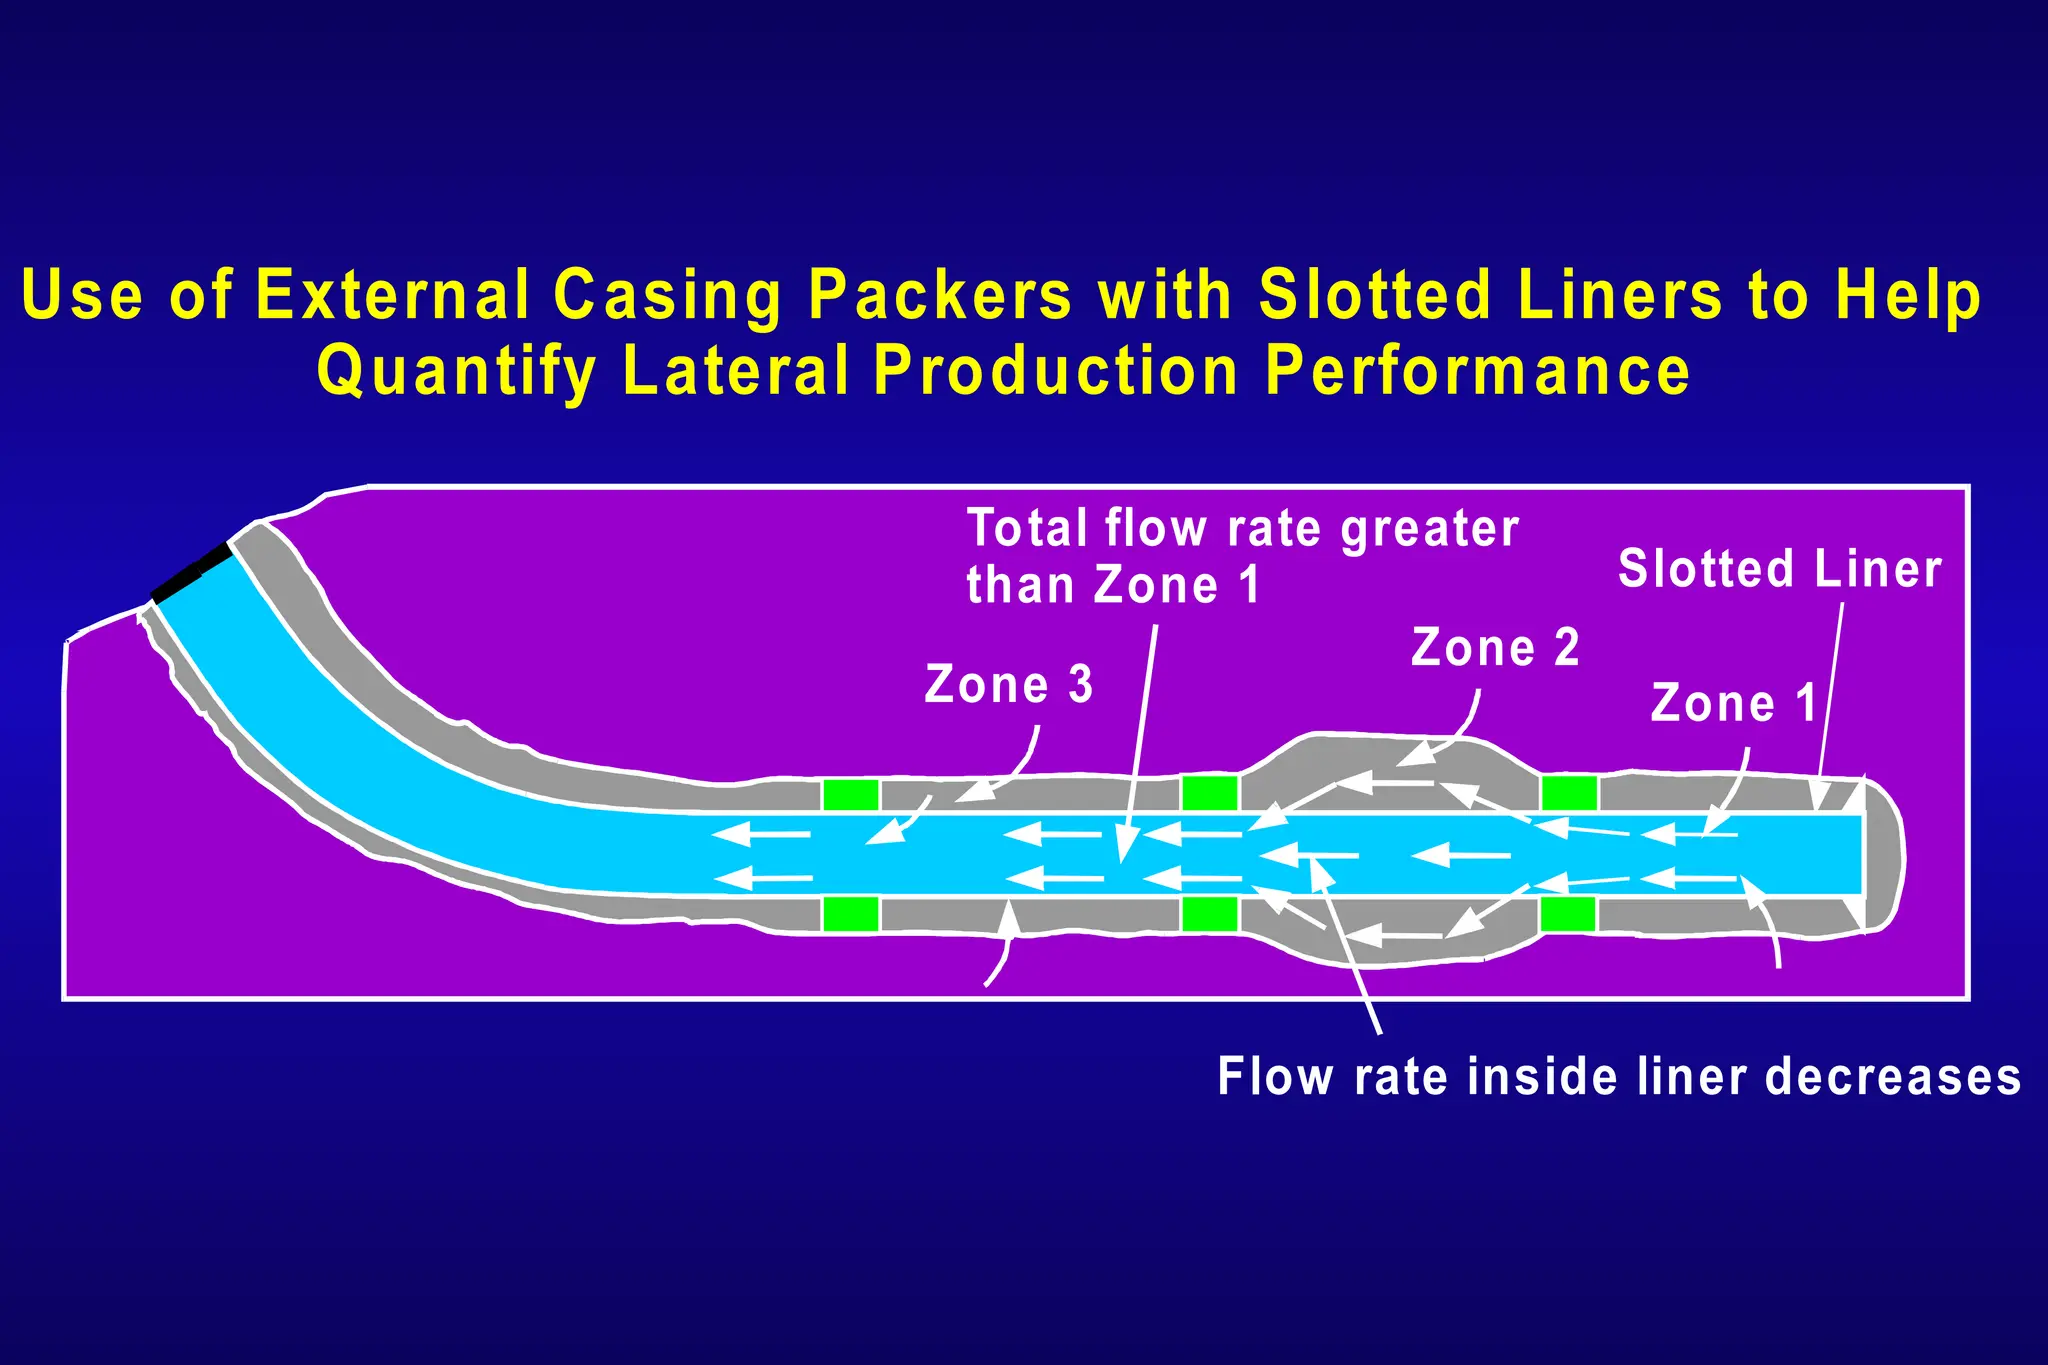
Total flow rategreater
than Zone 1 Slotted Liner
Flow rate inside liner decreases
Zone 3
Zone 2
Zone 1
Use of External Casing Packers with Slotted Liners to Help
Quantify Lateral Production Performance
#31 Vary logging speed as much as possible to obtain the best linear regression.
#34 Slopes can change at different intervals due to changes in the fluid.
Typical Slope should be 3 RPS/100 ft/min or greater.
#37 Water is always present even when no water production is documented.
#40 Countrates in air and water are used to calibrateto grams/cc using an exponential fit.
#63 Initial fluid temperature and Delta P dictate the flowing temperature. (cooling or warming)
Mass flowrate dictates what happens above (production) or below (downflow/injection) the fluid source or presssure drop.
#72 Can locate very small leaks that are unmeasureable by any other devices.
#73 Stationary recordings are made at different times. If the well is not stable some anomalies may be misinterpreted. In order to prove an anomaly is depth related and not time related at least one repeat is necessary of the stations surrounding this anomaly.
#75 Noise changes may be due to changes in the transmission medium and not noise sources.
#76 Single phase flow is dominated by high frequencies.
#77 Two phase flow is represneted by high low frequency repsonse. Take note of the logarithmic scale
#78 Attenuation of the analog signal varies with frequency and line type and length.
#98 Slip Velocity charts have been impirically derrived under several different conditions. Because of the inconsistencies in charts and downhole conditions affective use of these charts is limitted.