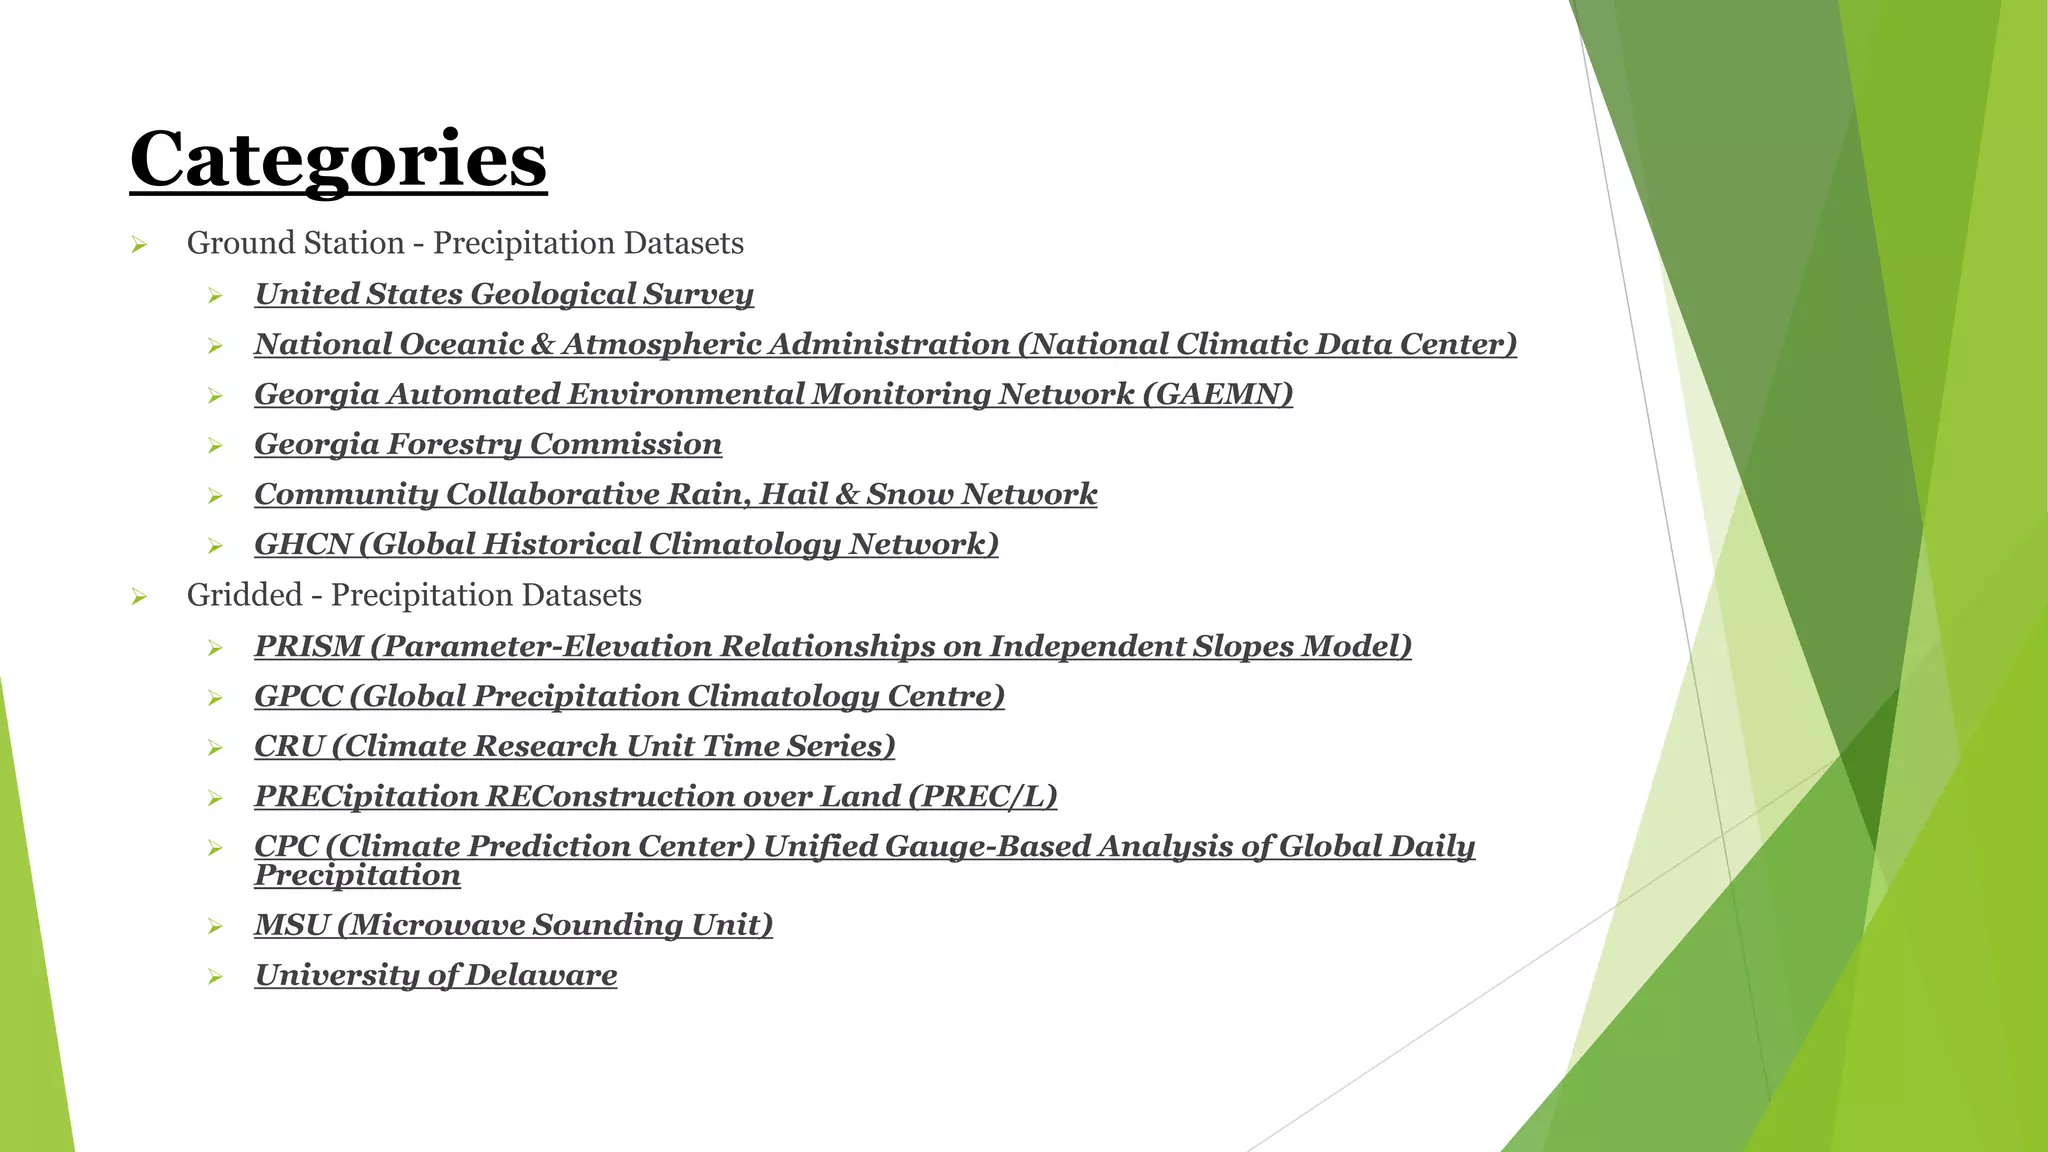
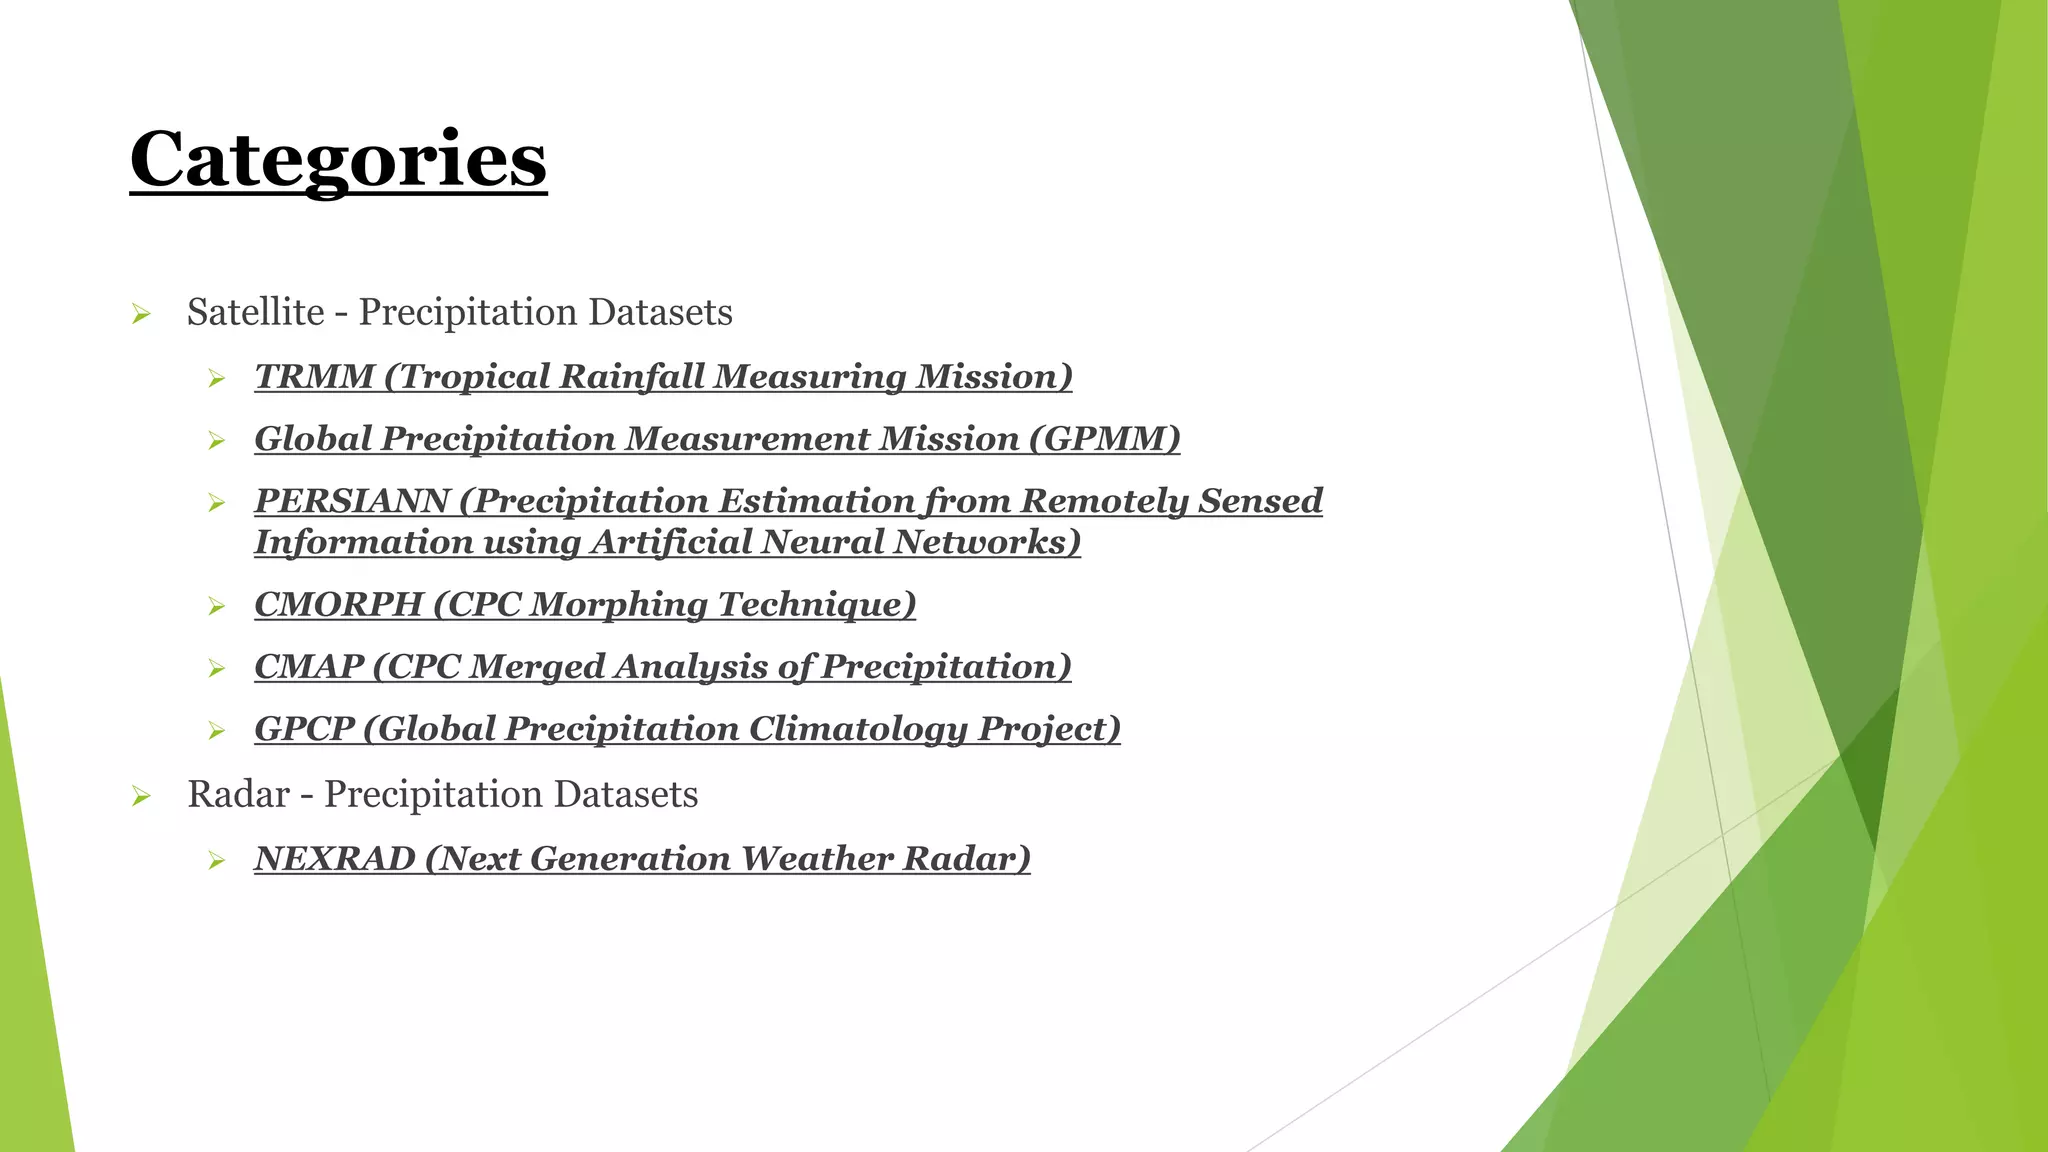
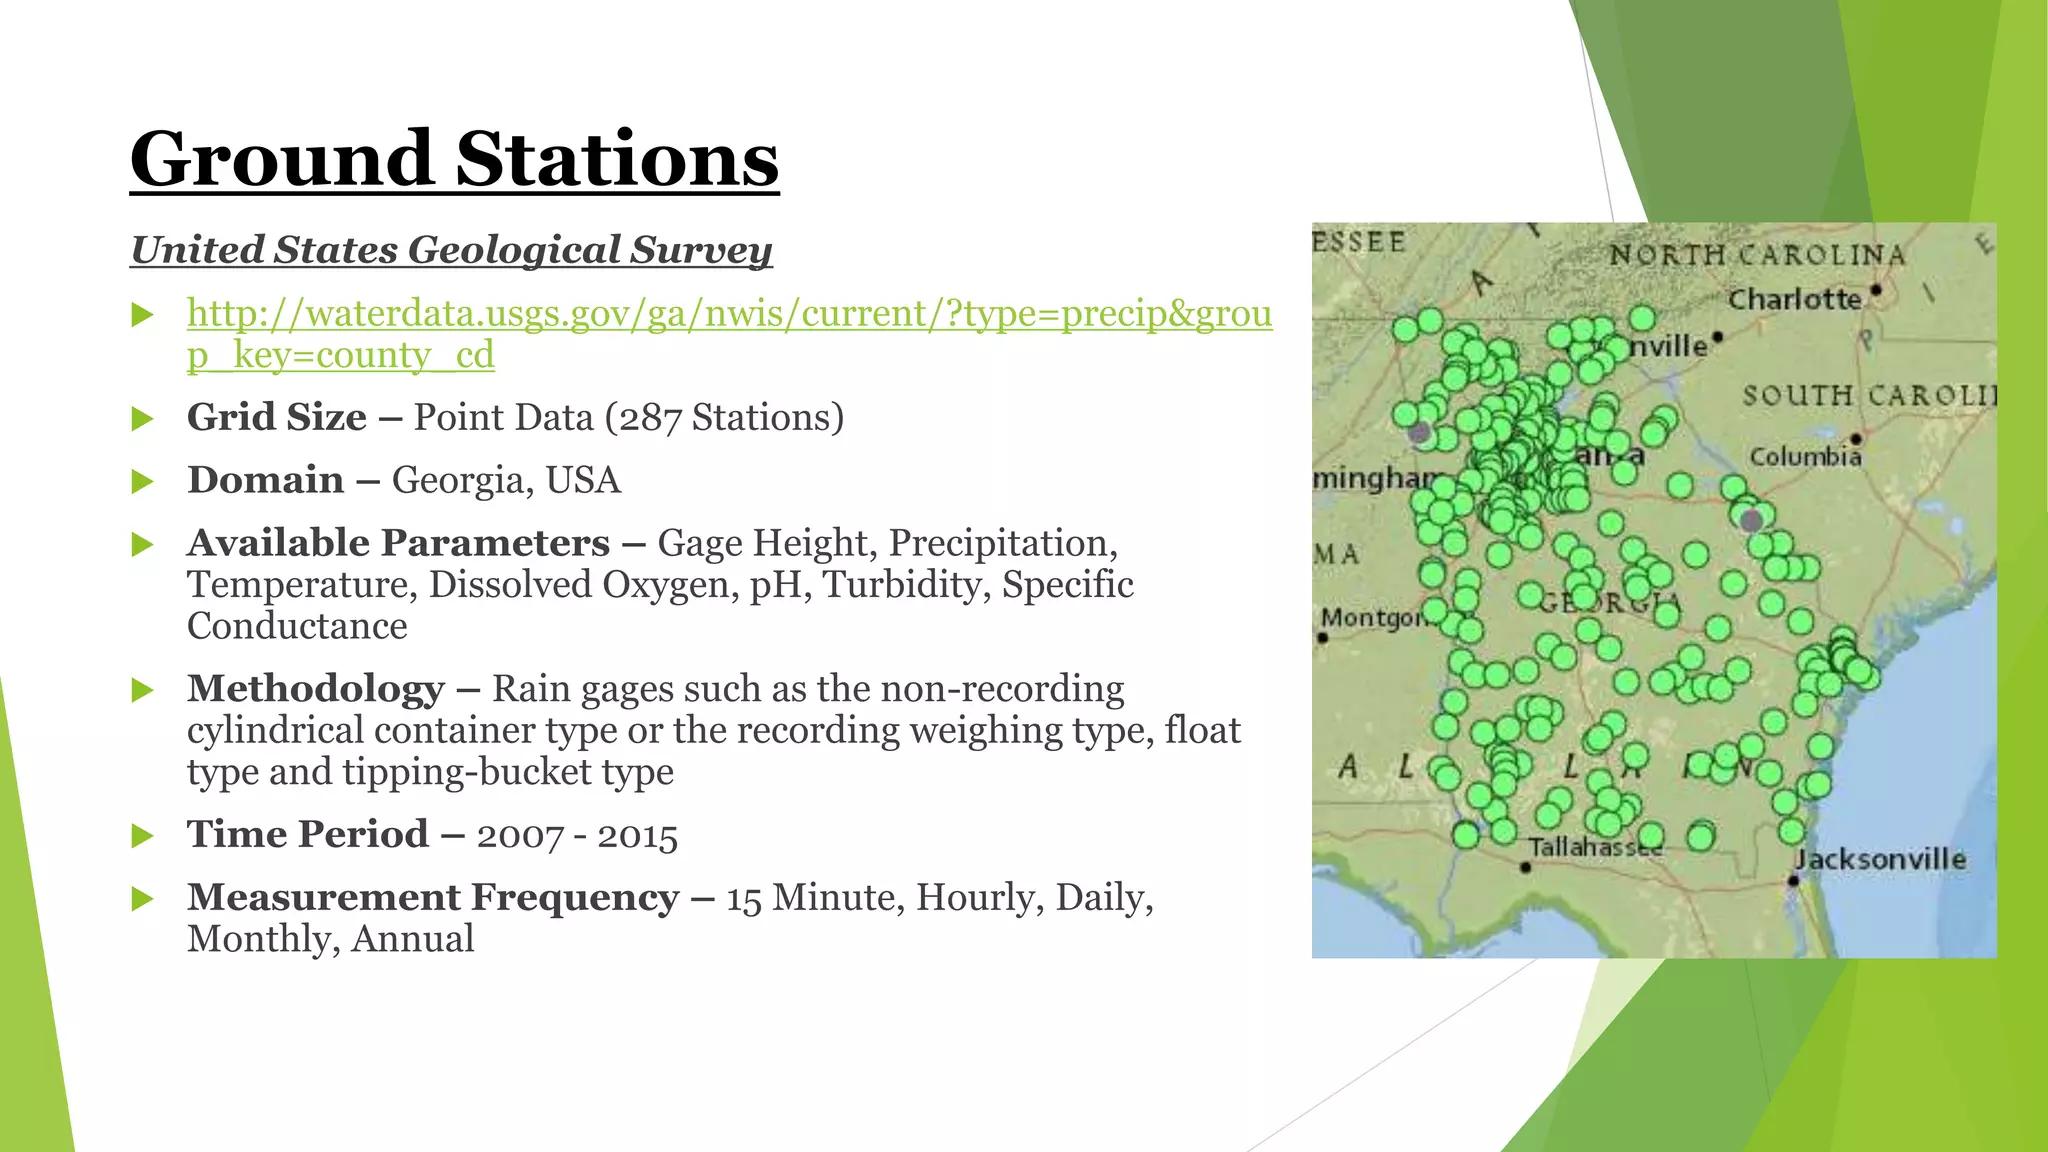
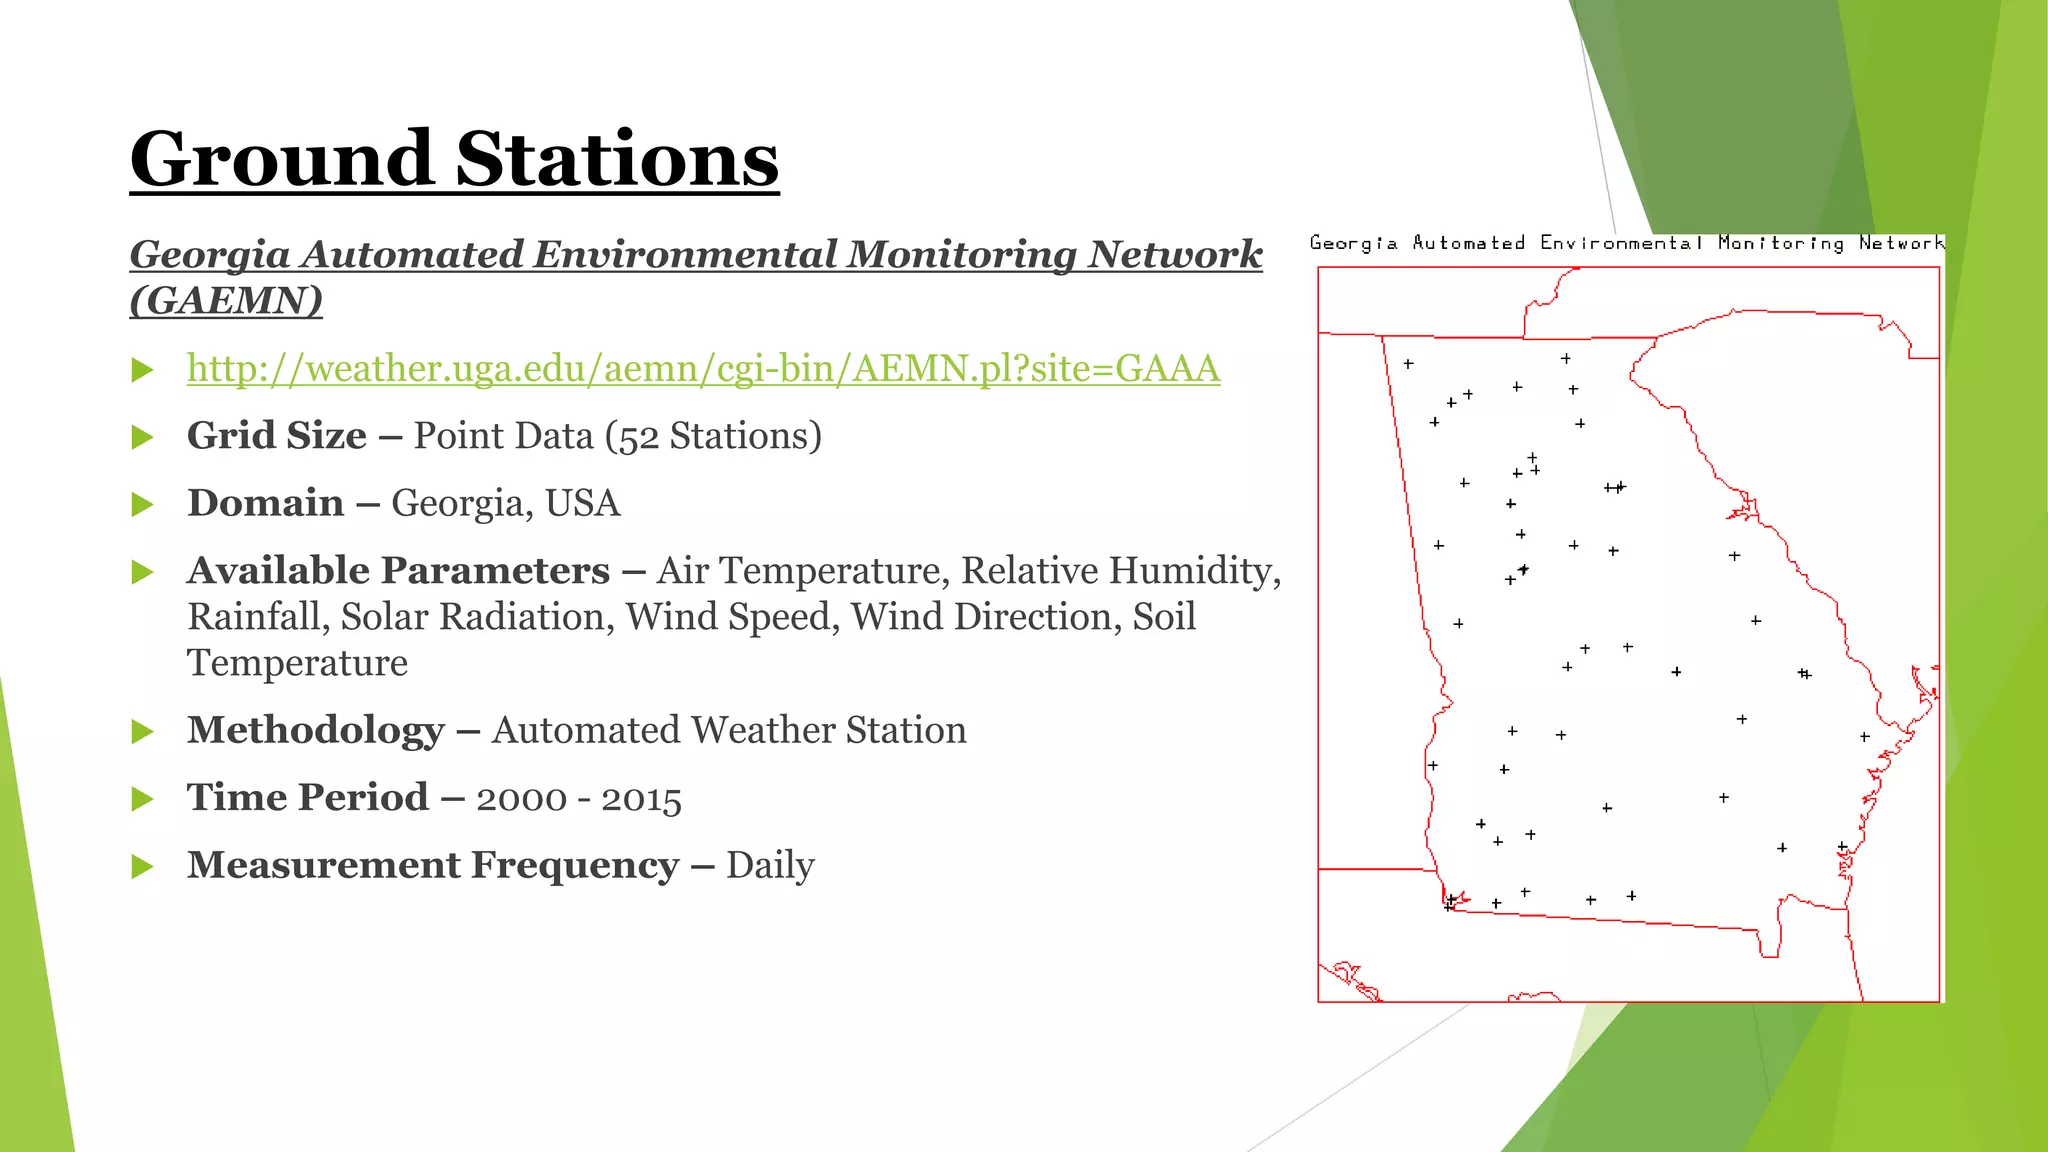
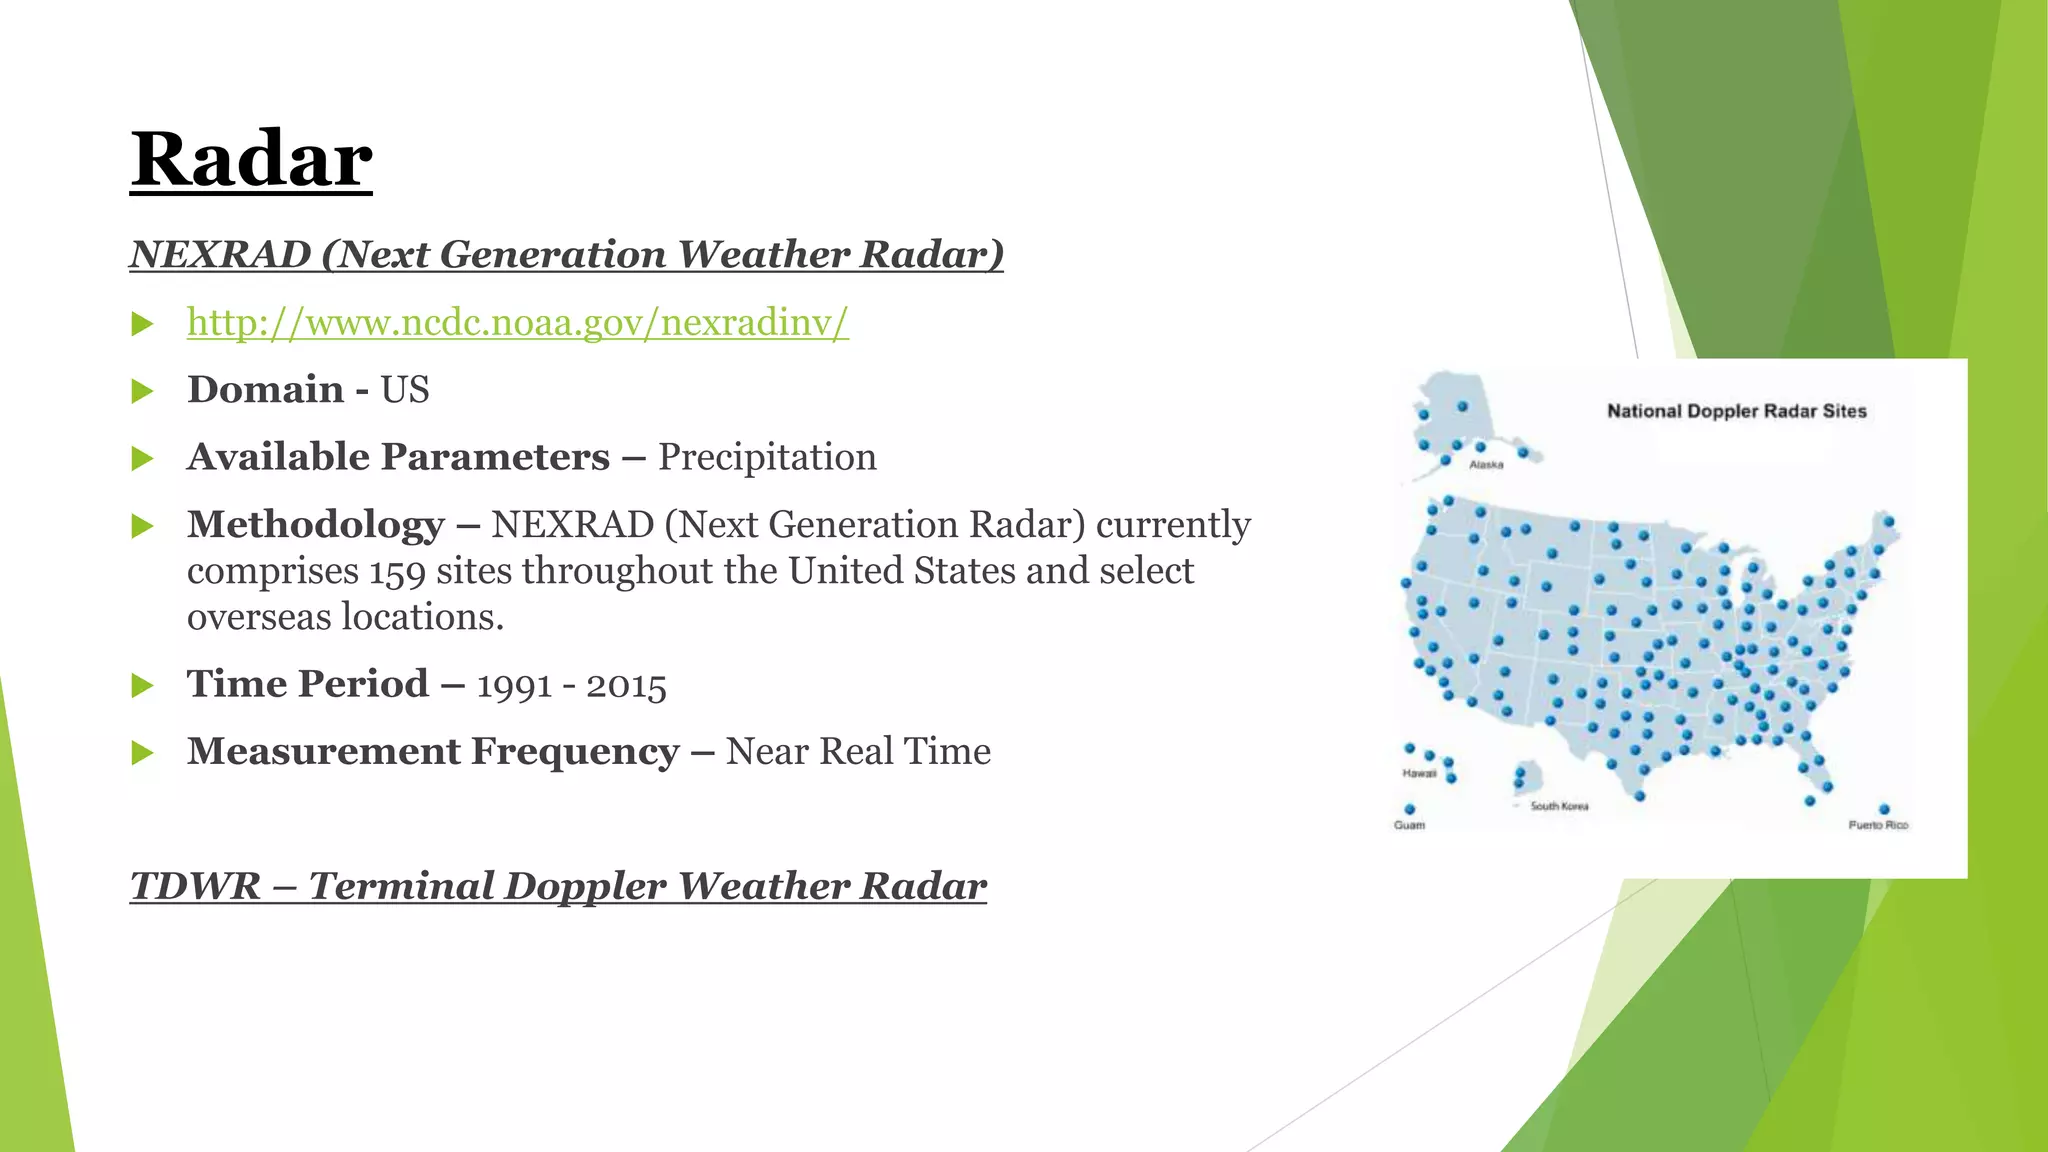
Precipitation Data
Categories
 Ground Station - Precipitation Datasets
 United States Geological Survey
 National Oceanic & Atmospheric Administration (National Climatic Data Center)
 Georgia Automated Environmental Monitoring Network (GAEMN)
 Georgia Forestry Commission
 Community Collaborative Rain, Hail & Snow Network
 GHCN (Global Historical Climatology Network)
 Gridded - Precipitation Datasets
 PRISM (Parameter-Elevation Relationships on Independent Slopes Model)
 GPCC (Global Precipitation Climatology Centre)
 CRU (Climate Research Unit Time Series)
 PRECipitation REConstruction over Land (PREC/L)
 CPC (Climate Prediction Center) Unified Gauge-Based Analysis of Global Daily
Precipitation
 MSU (Microwave Sounding Unit)
 University of Delaware
Categories
 Satellite - Precipitation Datasets
 TRMM (Tropical Rainfall Measuring Mission)
 Global Precipitation Measurement Mission (GPMM)
 PERSIANN (Precipitation Estimation from Remotely Sensed
Information using Artificial Neural Networks)
 CMORPH (CPC Morphing Technique)
 CMAP (CPC Merged Analysis of Precipitation)
 GPCP (Global Precipitation Climatology Project)
 Radar - Precipitation Datasets
 NEXRAD (Next Generation Weather Radar)
Measurement Frequency Classification
NRT 15 Minute Hourly Daily Monthly Yearly
Ground Stations - USGS, NOAA,
USGS, NOAA,
GFC,
USGS, NOAA,
GAEMN
USGS, NOAA,
GHCN
USGS, NOAA,
Gridded - - -
PRISM, CPC,
MSU
PRISM, GPCC,
CRU, PREC/L,
CPC, MSU, UoD
PRISM
Satellite
GPMM, TRMM,
PERSIANN,
CMORPH
- - - CMAP, GPCP -
Radar NEXRAD - - - - -
Ground Stations
United States Geological Survey
 http://waterdata.usgs.gov/ga/nwis/current/?type=precip&grou
p_key=county_cd
 Grid Size – Point Data (287 Stations)
 Domain – Georgia, USA
 Available Parameters – Gage Height, Precipitation,
Temperature, Dissolved Oxygen, pH, Turbidity, Specific
Conductance
 Methodology – Rain gages such as the non-recording
cylindrical container type or the recording weighing type, float
type and tipping-bucket type
 Time Period – 2007 - 2015
 Measurement Frequency – 15 Minute, Hourly, Daily,
Monthly, Annual
Ground Stations
National Oceanic & Atmospheric Administration
(National Climatic Data Center)
 http://www.ncdc.noaa.gov/cdo-web/datasets
 Grid Size – Point Data (68 Stations) (2% Coverage¹)
 Domain – Georgia, USA
 Available Parameters – Precipitation
 Methodology – An inlet-heated, wind-shielded weighing rain
gauge (configured with three load cell sensors), precipitation
(wetness) detector, and an auxiliary tipping bucket gauge.
 Time Period – 1971 - 2014
 Measurement Frequency – 15 Minute, Hourly, Daily,
Monthly, Annual (Dataset maybe delayed 6 months or more)
¹Coverage is an approximation of total completeness based on the
most complete data element, and the overall data range.
Ground Stations
Georgia Automated Environmental Monitoring Network
(GAEMN)
 http://weather.uga.edu/aemn/cgi-bin/AEMN.pl?site=GAAA
 Grid Size – Point Data (52 Stations)
 Domain – Georgia, USA
 Available Parameters – Air Temperature, Relative Humidity,
Rainfall, Solar Radiation, Wind Speed, Wind Direction, Soil
Temperature
 Methodology – Automated Weather Station
 Time Period – 2000 - 2015
 Measurement Frequency – Daily
Ground Stations
Georgia Forestry Commission (GFC)
 http://weather.gfc.state.ga.us/climate/climate.aspx
 Grid Size – Point Data (18 Stations)
 Domain – Georgia, USA
 Available Parameters – Air temperature, Relative Humidity,
Wind Direction, Wind Speed, Soil Temperatures
 Methodology – Automated Weather Station
 Time Period – 1998 - 2015
 Measurement Frequency – Hourly
Ground Stations
Community Collaborative Rain, Hail & Snow Network
 http://www.cocorahs.org/ViewData/ListMultiDayPrecipReports
.aspx
 Grid Size – Point Data (1163 Stations)
 Domain – Georgia, USA
 Available Parameters – Cumulative Precipitation
 Methodology – Standard 4-Inch Diameter Rain Gauge
 Time Period – 2000 - 2015
 Measurement Frequency – Irregular
Ground Stations
GHCN (Global Historical Climatology Network)
 http://gis.ncdc.noaa.gov/map/viewer/#app=cdo&cfg=cdo&theme=precip&la
yers=01&node=gis
 Grid Size – Point Data
 Domain - Global
 Available Parameters – Precipitation
 Methodology – The database was created from 15 source data sets,
including:
 The National Climatic Data Center's (NCDC's) World Weather Records
 CAC's Climate Anomaly Monitoring System (CAMS)
 NCAR's World Monthly Surface Station Climatology
 CIRES' (Eischeid/Diaz) Global precipitation data set
 P. Jones' Temperature data base for the world
 S. Nicholson's African precipitation data base
 Time Period – Variable (1697 - 1990)
 Measurement Frequency – Monthly
Gridded Datasets
PRISM (Parameter-Elevation Relationships on Independent
Slopes Model) - Christopher Daly and Kirk Bryant
 http://www.prism.oregonstate.edu/explorer/
 Grid Size – Climatologies (normals) are available at 30-arcsec (800
meters) and monthly data are available at 2.5 arcmin (4 km)
resolution.
 Domain – Contiguous US
 Main Variables – Dew Point Temperature, Max. & Min. Air
Temperature, Precipitation
 Methodology – The PRISM products use a weighted regression
scheme to account for complex climate regimes associated with
orography, rain shadows, temperature inversions, slope aspect,
coastal proximity, and other factors.
 Time Period – 1895 - Present
 Measurement Frequency – Daily, Monthly, Annual, 30-year
normals (1981-2010) (monthly and annual)
Gridded Datasets
GPCC (Global Precipitation Climatology Centre)
 http://www.esrl.noaa.gov/psd/data/gridded/data.gpcc.html
 Grid Size –
 0.5 degree latitude x 0.5 degree longitude global grid
 1.0 degree latitude x 1.0 degree longitude global grid
 2.5 degree latitude x 2.5 degree longitude global grid
 Domain - Global
 Available Parameters – Precipitation
 Methodology – Based on quality-controlled data from 67,200
stations world-wide that feature record durations of 10 years or
longer.
 Time Period – 1901 - 2010
 Measurement Frequency – Monthly
Gridded Datasets
CRU (Climate Research Unit Time Series)
 http://catalogue.ceda.ac.uk/uuid/4a6d071383976a5fb24b5b42e28cf
28f
 Grid Size – 0.5 degree latitude x 0.5 degree longitude global grid
(4,000 Stations)
 Domain - Global
 Available Parameters – Cloud cover, diurnal temperature range,
frost day frequency, precipitation, daily mean temperature, monthly
average daily maximum temperature, vapor pressure, Potential
Evapo-transpiration and wet day frequency.
 Methodology – Based on an archive of monthly mean
temperatures provided by more than 4000 weather stations
distributed around the world.
 Time Period – 1901 - 2013
 Measurement Spacing – Monthly
Gridded Datasets
PRECipitation REConstruction over Land (PREC/L)
 http://www.esrl.noaa.gov/psd/data/gridded/data.precl.html
 Grid Size – (17,000 Stations)
 0.5 degree latitude x 0.5 degree longitude global grid
 1.0 degree latitude x 1.0 degree longitude global grid
 2.5 degree latitude x 2.5 degree longitude global grid
 Domain - Global
 Available Parameters – Precipitation
 Methodology – Precipitation gauge measurements over land from
the GHCN-v2 (Global Historical Climatology Network version 2) are
interpolated
 Time Period – 1948 – Present (Except 0.5 degree data, which runs
behind)
 Measurement Frequency – Monthly
Gridded Datasets
CPC (Climate Prediction Center) Unified Gauge-Based
Analysis of Global Daily Precipitation
 http://www.esrl.noaa.gov/psd/data/gridded/data.unified.daily.c
onus.html
 Grid Size – 0.25 degree latitude x 0.25 degree longitude global
grid (30,000 Stations)
 Domain - Global
 Available Parameters – Precipitation
 Methodology – This dataset has two components: (a) the
"retrospective version" which uses 30K stations and spans 1979-
2005 and (b) the "real-time version" which uses 17K stations and
spans 2006-present.
 Time Period – 1948 – 2006 (Daily), 1948 – Present (Monthly)
 Measurement Frequency – Daily, Monthly
Gridded Datasets
MSU (Microwave Sounding Unit)
 http://www.esrl.noaa.gov/psd/data/gridded/data.msu.html
 Resolution – 2.5 degree latitude x 2.5 degree longitude global
grid
 Domain - Global
 Available Parameters – Precipitation, Temperature
 Methodology – The NOAA satellites contributing to this
dataset are, in order of their launch, TIROS-N, NOAA-6, -7, -9, -
10,-11, and NOAA-12.
 Time Period – 1979 – 1996
 Measurement Frequency – Daily, Monthly
Gridded Datasets
University of Delaware (UoD)
 http://www.esrl.noaa.gov/psd/data/gridded/data.UDel_AirT_P
recip.html
 Resolution – 0.5 degree latitude x 0.5 degree longitude global
grid
 Domain - Global
 Available Parameters – Precipitation, Temperature
 Methodology - Cort Willmott & Kenji Matsuura of the
University of Delaware have put data together from a large
number of stations, both from the GHCN2 (Global Historical
Climate Network) and, more extensively, from the archive of
Legates & Willmott.
 Time Period – 1901 – 2010
 Measurement Frequency – Monthly
Satellite Datasets
TRMM (Tropical Rainfall Measuring Mission)
 http://trmm.gsfc.nasa.gov/
 Resolution - 0.25 degree latitude x 0.25 degree longitude global
grid
 Domain - Global
 Available Parameters – Precipitation
 Methodology – The mission uses 5 instruments: Precipitation
Radar (PR), TRMM Microwave Imager (TMI), Visible Infrared
Scanner (VIRS), Clouds & Earths Radiant Energy System
(CERES) and Lightning Imaging Sensor (LSI).
 Time Period – 1997 – (March) 2015
 Measurement Frequency – 3 Hour (Near Real Time)
Satellite Datasets
Global Precipitation Measurement Mission (GPMM)
 http://pmm.nasa.gov/data-access/downloads/gpm
 Resolution - 0.1 degree latitude x 0.1 degree longitude global
grid
 Domain - Global
 Available Parameters – Precipitation
 Methodology – The satellite carries a microwave imager. Its
scanning antenna rotates 32 times per minute, while a downward
pointing detector reads microwaves reflected from the
atmosphere below. As it orbits, GPM scans the Earth’s
atmosphere with its Dual-Frequency Precipitation Radar. The
radar scans in two frequencies, the Ku scan (13.6 gigahertz) and
the Ka scan (35.5 gigahertz).
 Time Period – (March) 2014 - Present
 Measurement Frequency – 3 Hour (Near Real Time)
Satellite Datasets
PERSIANN (Precipitation Estimation from Remotely
Sensed Information using Artificial Neural Networks)
 http://chrs.web.uci.edu/persiann/
 Resolution – 0.25 degree latitude x 0.25 degree longitude
global grid
 Domain - Global
 Available Parameters – Precipitation, Atmosphere
 Methodology – The PERSIANN algorithm used here is based
on the geostationary longwave infrared imagery to generate
global rainfall.
 Time Period – 1979 - Present
 Measurement Frequency – 3 Hour (Near Real Time)
Satellite Datasets
CMORPH (CPC Morphing Technique)
 http://www.cpc.ncep.noaa.gov/products/janowiak/cmorph_des
cription.html
 Resolution – 0.25 degree latitude x 0.25 degree longitude
global grid
 Domain - Global
 Available Parameters – Precipitation, Atmosphere
 Methodology – The precipitation estimates derived from the
passive microwaves aboard the DMSP 13, 14 & 15 (SSM/I), the
NOAA-15, 16, 17 & 18 (AMSU-B), and AMSR-E and TMI aboard
NASA's Aqua and TRMM spacecraft, respectively.
 Time Period – 2002 - 2013
 Measurement Frequency – 3 Hour, Daily (Near Real Time)
Satellite Datasets
CMAP (CPC Merged Analysis of Precipitation)
 http://www.esrl.noaa.gov/psd/data/gridded/data.cmap.html
 Resolution – 2.5 degree latitude x 2.5 degree longitude global
grid
 Domain - Global
 Available Parameters – Precipitation, Atmosphere
 Methodology – Inputs are derived from gauge analysis;
microwave and infrared observations from polar orbiting and
geostationary satellites
 Time Period – 1979 - 2011
 Measurement Frequency – Monthly Mean
Satellite Datasets
GPCP (Global Precipitation Climatology Project)
 http://www.esrl.noaa.gov/psd/data/gridded/data.gpcp.html
 Resolution – 2.5 degree latitude x 2.5 degree longitude global grid
 Domain - Global
 Available Parameters – Precipitation, Atmosphere
 Methodology –
 The Version 2 Data Set contains data from several contributing centers:
 GPCP Polar Satellite Precipitation Data Centre - Emission (SSM/I emission estimates)
 F17 SSMIS: calibrating microwave data source to replace the F13 SSM/I, which failed in
September 2009
 GPCP Polar Satellite Precipitation Data Centre - Scattering (SSM/I scattering estimates)
 GPCP Geostationary Satellite Precipitation Data Centre (GPI and OPI estimates and rain
gauge analyses)
 NASA/GSFC Satellite Applications Office (TOVS estimates)
 GPCP Global Precipitation Climatology Centre (rain gauge analyses)
 Time Period – 1979 – (February) 2015
 Measurement Frequency – Monthly Mean
Radar
NEXRAD (Next Generation Weather Radar)
 http://www.ncdc.noaa.gov/nexradinv/
 Domain - US
 Available Parameters – Precipitation
 Methodology – NEXRAD (Next Generation Radar) currently
comprises 159 sites throughout the United States and select
overseas locations.
 Time Period – 1991 - 2015
 Measurement Frequency – Near Real Time
TDWR – Terminal Doppler Weather Radar
Data Sources
 PSD Gridded Climate Datasets: All
http://www.esrl.noaa.gov/psd/data/gridded/
 NCAR UCAR Climate Data Guide
https://climatedataguide.ucar.edu/

Precipitation Data - Georgia, USA

  • 1.
  • 2.
    Categories  Ground Station- Precipitation Datasets  United States Geological Survey  National Oceanic & Atmospheric Administration (National Climatic Data Center)  Georgia Automated Environmental Monitoring Network (GAEMN)  Georgia Forestry Commission  Community Collaborative Rain, Hail & Snow Network  GHCN (Global Historical Climatology Network)  Gridded - Precipitation Datasets  PRISM (Parameter-Elevation Relationships on Independent Slopes Model)  GPCC (Global Precipitation Climatology Centre)  CRU (Climate Research Unit Time Series)  PRECipitation REConstruction over Land (PREC/L)  CPC (Climate Prediction Center) Unified Gauge-Based Analysis of Global Daily Precipitation  MSU (Microwave Sounding Unit)  University of Delaware
  • 3.
    Categories  Satellite -Precipitation Datasets  TRMM (Tropical Rainfall Measuring Mission)  Global Precipitation Measurement Mission (GPMM)  PERSIANN (Precipitation Estimation from Remotely Sensed Information using Artificial Neural Networks)  CMORPH (CPC Morphing Technique)  CMAP (CPC Merged Analysis of Precipitation)  GPCP (Global Precipitation Climatology Project)  Radar - Precipitation Datasets  NEXRAD (Next Generation Weather Radar)
  • 4.
    Measurement Frequency Classification NRT15 Minute Hourly Daily Monthly Yearly Ground Stations - USGS, NOAA, USGS, NOAA, GFC, USGS, NOAA, GAEMN USGS, NOAA, GHCN USGS, NOAA, Gridded - - - PRISM, CPC, MSU PRISM, GPCC, CRU, PREC/L, CPC, MSU, UoD PRISM Satellite GPMM, TRMM, PERSIANN, CMORPH - - - CMAP, GPCP - Radar NEXRAD - - - - -
  • 5.
    Ground Stations United StatesGeological Survey  http://waterdata.usgs.gov/ga/nwis/current/?type=precip&grou p_key=county_cd  Grid Size – Point Data (287 Stations)  Domain – Georgia, USA  Available Parameters – Gage Height, Precipitation, Temperature, Dissolved Oxygen, pH, Turbidity, Specific Conductance  Methodology – Rain gages such as the non-recording cylindrical container type or the recording weighing type, float type and tipping-bucket type  Time Period – 2007 - 2015  Measurement Frequency – 15 Minute, Hourly, Daily, Monthly, Annual
  • 6.
    Ground Stations National Oceanic& Atmospheric Administration (National Climatic Data Center)  http://www.ncdc.noaa.gov/cdo-web/datasets  Grid Size – Point Data (68 Stations) (2% Coverage¹)  Domain – Georgia, USA  Available Parameters – Precipitation  Methodology – An inlet-heated, wind-shielded weighing rain gauge (configured with three load cell sensors), precipitation (wetness) detector, and an auxiliary tipping bucket gauge.  Time Period – 1971 - 2014  Measurement Frequency – 15 Minute, Hourly, Daily, Monthly, Annual (Dataset maybe delayed 6 months or more) ¹Coverage is an approximation of total completeness based on the most complete data element, and the overall data range.
  • 7.
    Ground Stations Georgia AutomatedEnvironmental Monitoring Network (GAEMN)  http://weather.uga.edu/aemn/cgi-bin/AEMN.pl?site=GAAA  Grid Size – Point Data (52 Stations)  Domain – Georgia, USA  Available Parameters – Air Temperature, Relative Humidity, Rainfall, Solar Radiation, Wind Speed, Wind Direction, Soil Temperature  Methodology – Automated Weather Station  Time Period – 2000 - 2015  Measurement Frequency – Daily
  • 8.
    Ground Stations Georgia ForestryCommission (GFC)  http://weather.gfc.state.ga.us/climate/climate.aspx  Grid Size – Point Data (18 Stations)  Domain – Georgia, USA  Available Parameters – Air temperature, Relative Humidity, Wind Direction, Wind Speed, Soil Temperatures  Methodology – Automated Weather Station  Time Period – 1998 - 2015  Measurement Frequency – Hourly
  • 9.
    Ground Stations Community CollaborativeRain, Hail & Snow Network  http://www.cocorahs.org/ViewData/ListMultiDayPrecipReports .aspx  Grid Size – Point Data (1163 Stations)  Domain – Georgia, USA  Available Parameters – Cumulative Precipitation  Methodology – Standard 4-Inch Diameter Rain Gauge  Time Period – 2000 - 2015  Measurement Frequency – Irregular
  • 10.
    Ground Stations GHCN (GlobalHistorical Climatology Network)  http://gis.ncdc.noaa.gov/map/viewer/#app=cdo&cfg=cdo&theme=precip&la yers=01&node=gis  Grid Size – Point Data  Domain - Global  Available Parameters – Precipitation  Methodology – The database was created from 15 source data sets, including:  The National Climatic Data Center's (NCDC's) World Weather Records  CAC's Climate Anomaly Monitoring System (CAMS)  NCAR's World Monthly Surface Station Climatology  CIRES' (Eischeid/Diaz) Global precipitation data set  P. Jones' Temperature data base for the world  S. Nicholson's African precipitation data base  Time Period – Variable (1697 - 1990)  Measurement Frequency – Monthly
  • 11.
    Gridded Datasets PRISM (Parameter-ElevationRelationships on Independent Slopes Model) - Christopher Daly and Kirk Bryant  http://www.prism.oregonstate.edu/explorer/  Grid Size – Climatologies (normals) are available at 30-arcsec (800 meters) and monthly data are available at 2.5 arcmin (4 km) resolution.  Domain – Contiguous US  Main Variables – Dew Point Temperature, Max. & Min. Air Temperature, Precipitation  Methodology – The PRISM products use a weighted regression scheme to account for complex climate regimes associated with orography, rain shadows, temperature inversions, slope aspect, coastal proximity, and other factors.  Time Period – 1895 - Present  Measurement Frequency – Daily, Monthly, Annual, 30-year normals (1981-2010) (monthly and annual)
  • 12.
    Gridded Datasets GPCC (GlobalPrecipitation Climatology Centre)  http://www.esrl.noaa.gov/psd/data/gridded/data.gpcc.html  Grid Size –  0.5 degree latitude x 0.5 degree longitude global grid  1.0 degree latitude x 1.0 degree longitude global grid  2.5 degree latitude x 2.5 degree longitude global grid  Domain - Global  Available Parameters – Precipitation  Methodology – Based on quality-controlled data from 67,200 stations world-wide that feature record durations of 10 years or longer.  Time Period – 1901 - 2010  Measurement Frequency – Monthly
  • 13.
    Gridded Datasets CRU (ClimateResearch Unit Time Series)  http://catalogue.ceda.ac.uk/uuid/4a6d071383976a5fb24b5b42e28cf 28f  Grid Size – 0.5 degree latitude x 0.5 degree longitude global grid (4,000 Stations)  Domain - Global  Available Parameters – Cloud cover, diurnal temperature range, frost day frequency, precipitation, daily mean temperature, monthly average daily maximum temperature, vapor pressure, Potential Evapo-transpiration and wet day frequency.  Methodology – Based on an archive of monthly mean temperatures provided by more than 4000 weather stations distributed around the world.  Time Period – 1901 - 2013  Measurement Spacing – Monthly
  • 14.
    Gridded Datasets PRECipitation REConstructionover Land (PREC/L)  http://www.esrl.noaa.gov/psd/data/gridded/data.precl.html  Grid Size – (17,000 Stations)  0.5 degree latitude x 0.5 degree longitude global grid  1.0 degree latitude x 1.0 degree longitude global grid  2.5 degree latitude x 2.5 degree longitude global grid  Domain - Global  Available Parameters – Precipitation  Methodology – Precipitation gauge measurements over land from the GHCN-v2 (Global Historical Climatology Network version 2) are interpolated  Time Period – 1948 – Present (Except 0.5 degree data, which runs behind)  Measurement Frequency – Monthly
  • 15.
    Gridded Datasets CPC (ClimatePrediction Center) Unified Gauge-Based Analysis of Global Daily Precipitation  http://www.esrl.noaa.gov/psd/data/gridded/data.unified.daily.c onus.html  Grid Size – 0.25 degree latitude x 0.25 degree longitude global grid (30,000 Stations)  Domain - Global  Available Parameters – Precipitation  Methodology – This dataset has two components: (a) the "retrospective version" which uses 30K stations and spans 1979- 2005 and (b) the "real-time version" which uses 17K stations and spans 2006-present.  Time Period – 1948 – 2006 (Daily), 1948 – Present (Monthly)  Measurement Frequency – Daily, Monthly
  • 16.
    Gridded Datasets MSU (MicrowaveSounding Unit)  http://www.esrl.noaa.gov/psd/data/gridded/data.msu.html  Resolution – 2.5 degree latitude x 2.5 degree longitude global grid  Domain - Global  Available Parameters – Precipitation, Temperature  Methodology – The NOAA satellites contributing to this dataset are, in order of their launch, TIROS-N, NOAA-6, -7, -9, - 10,-11, and NOAA-12.  Time Period – 1979 – 1996  Measurement Frequency – Daily, Monthly
  • 17.
    Gridded Datasets University ofDelaware (UoD)  http://www.esrl.noaa.gov/psd/data/gridded/data.UDel_AirT_P recip.html  Resolution – 0.5 degree latitude x 0.5 degree longitude global grid  Domain - Global  Available Parameters – Precipitation, Temperature  Methodology - Cort Willmott & Kenji Matsuura of the University of Delaware have put data together from a large number of stations, both from the GHCN2 (Global Historical Climate Network) and, more extensively, from the archive of Legates & Willmott.  Time Period – 1901 – 2010  Measurement Frequency – Monthly
  • 18.
    Satellite Datasets TRMM (TropicalRainfall Measuring Mission)  http://trmm.gsfc.nasa.gov/  Resolution - 0.25 degree latitude x 0.25 degree longitude global grid  Domain - Global  Available Parameters – Precipitation  Methodology – The mission uses 5 instruments: Precipitation Radar (PR), TRMM Microwave Imager (TMI), Visible Infrared Scanner (VIRS), Clouds & Earths Radiant Energy System (CERES) and Lightning Imaging Sensor (LSI).  Time Period – 1997 – (March) 2015  Measurement Frequency – 3 Hour (Near Real Time)
  • 19.
    Satellite Datasets Global PrecipitationMeasurement Mission (GPMM)  http://pmm.nasa.gov/data-access/downloads/gpm  Resolution - 0.1 degree latitude x 0.1 degree longitude global grid  Domain - Global  Available Parameters – Precipitation  Methodology – The satellite carries a microwave imager. Its scanning antenna rotates 32 times per minute, while a downward pointing detector reads microwaves reflected from the atmosphere below. As it orbits, GPM scans the Earth’s atmosphere with its Dual-Frequency Precipitation Radar. The radar scans in two frequencies, the Ku scan (13.6 gigahertz) and the Ka scan (35.5 gigahertz).  Time Period – (March) 2014 - Present  Measurement Frequency – 3 Hour (Near Real Time)
  • 20.
    Satellite Datasets PERSIANN (PrecipitationEstimation from Remotely Sensed Information using Artificial Neural Networks)  http://chrs.web.uci.edu/persiann/  Resolution – 0.25 degree latitude x 0.25 degree longitude global grid  Domain - Global  Available Parameters – Precipitation, Atmosphere  Methodology – The PERSIANN algorithm used here is based on the geostationary longwave infrared imagery to generate global rainfall.  Time Period – 1979 - Present  Measurement Frequency – 3 Hour (Near Real Time)
  • 21.
    Satellite Datasets CMORPH (CPCMorphing Technique)  http://www.cpc.ncep.noaa.gov/products/janowiak/cmorph_des cription.html  Resolution – 0.25 degree latitude x 0.25 degree longitude global grid  Domain - Global  Available Parameters – Precipitation, Atmosphere  Methodology – The precipitation estimates derived from the passive microwaves aboard the DMSP 13, 14 & 15 (SSM/I), the NOAA-15, 16, 17 & 18 (AMSU-B), and AMSR-E and TMI aboard NASA's Aqua and TRMM spacecraft, respectively.  Time Period – 2002 - 2013  Measurement Frequency – 3 Hour, Daily (Near Real Time)
  • 22.
    Satellite Datasets CMAP (CPCMerged Analysis of Precipitation)  http://www.esrl.noaa.gov/psd/data/gridded/data.cmap.html  Resolution – 2.5 degree latitude x 2.5 degree longitude global grid  Domain - Global  Available Parameters – Precipitation, Atmosphere  Methodology – Inputs are derived from gauge analysis; microwave and infrared observations from polar orbiting and geostationary satellites  Time Period – 1979 - 2011  Measurement Frequency – Monthly Mean
  • 23.
    Satellite Datasets GPCP (GlobalPrecipitation Climatology Project)  http://www.esrl.noaa.gov/psd/data/gridded/data.gpcp.html  Resolution – 2.5 degree latitude x 2.5 degree longitude global grid  Domain - Global  Available Parameters – Precipitation, Atmosphere  Methodology –  The Version 2 Data Set contains data from several contributing centers:  GPCP Polar Satellite Precipitation Data Centre - Emission (SSM/I emission estimates)  F17 SSMIS: calibrating microwave data source to replace the F13 SSM/I, which failed in September 2009  GPCP Polar Satellite Precipitation Data Centre - Scattering (SSM/I scattering estimates)  GPCP Geostationary Satellite Precipitation Data Centre (GPI and OPI estimates and rain gauge analyses)  NASA/GSFC Satellite Applications Office (TOVS estimates)  GPCP Global Precipitation Climatology Centre (rain gauge analyses)  Time Period – 1979 – (February) 2015  Measurement Frequency – Monthly Mean
  • 24.
    Radar NEXRAD (Next GenerationWeather Radar)  http://www.ncdc.noaa.gov/nexradinv/  Domain - US  Available Parameters – Precipitation  Methodology – NEXRAD (Next Generation Radar) currently comprises 159 sites throughout the United States and select overseas locations.  Time Period – 1991 - 2015  Measurement Frequency – Near Real Time TDWR – Terminal Doppler Weather Radar
  • 25.
    Data Sources  PSDGridded Climate Datasets: All http://www.esrl.noaa.gov/psd/data/gridded/  NCAR UCAR Climate Data Guide https://climatedataguide.ucar.edu/