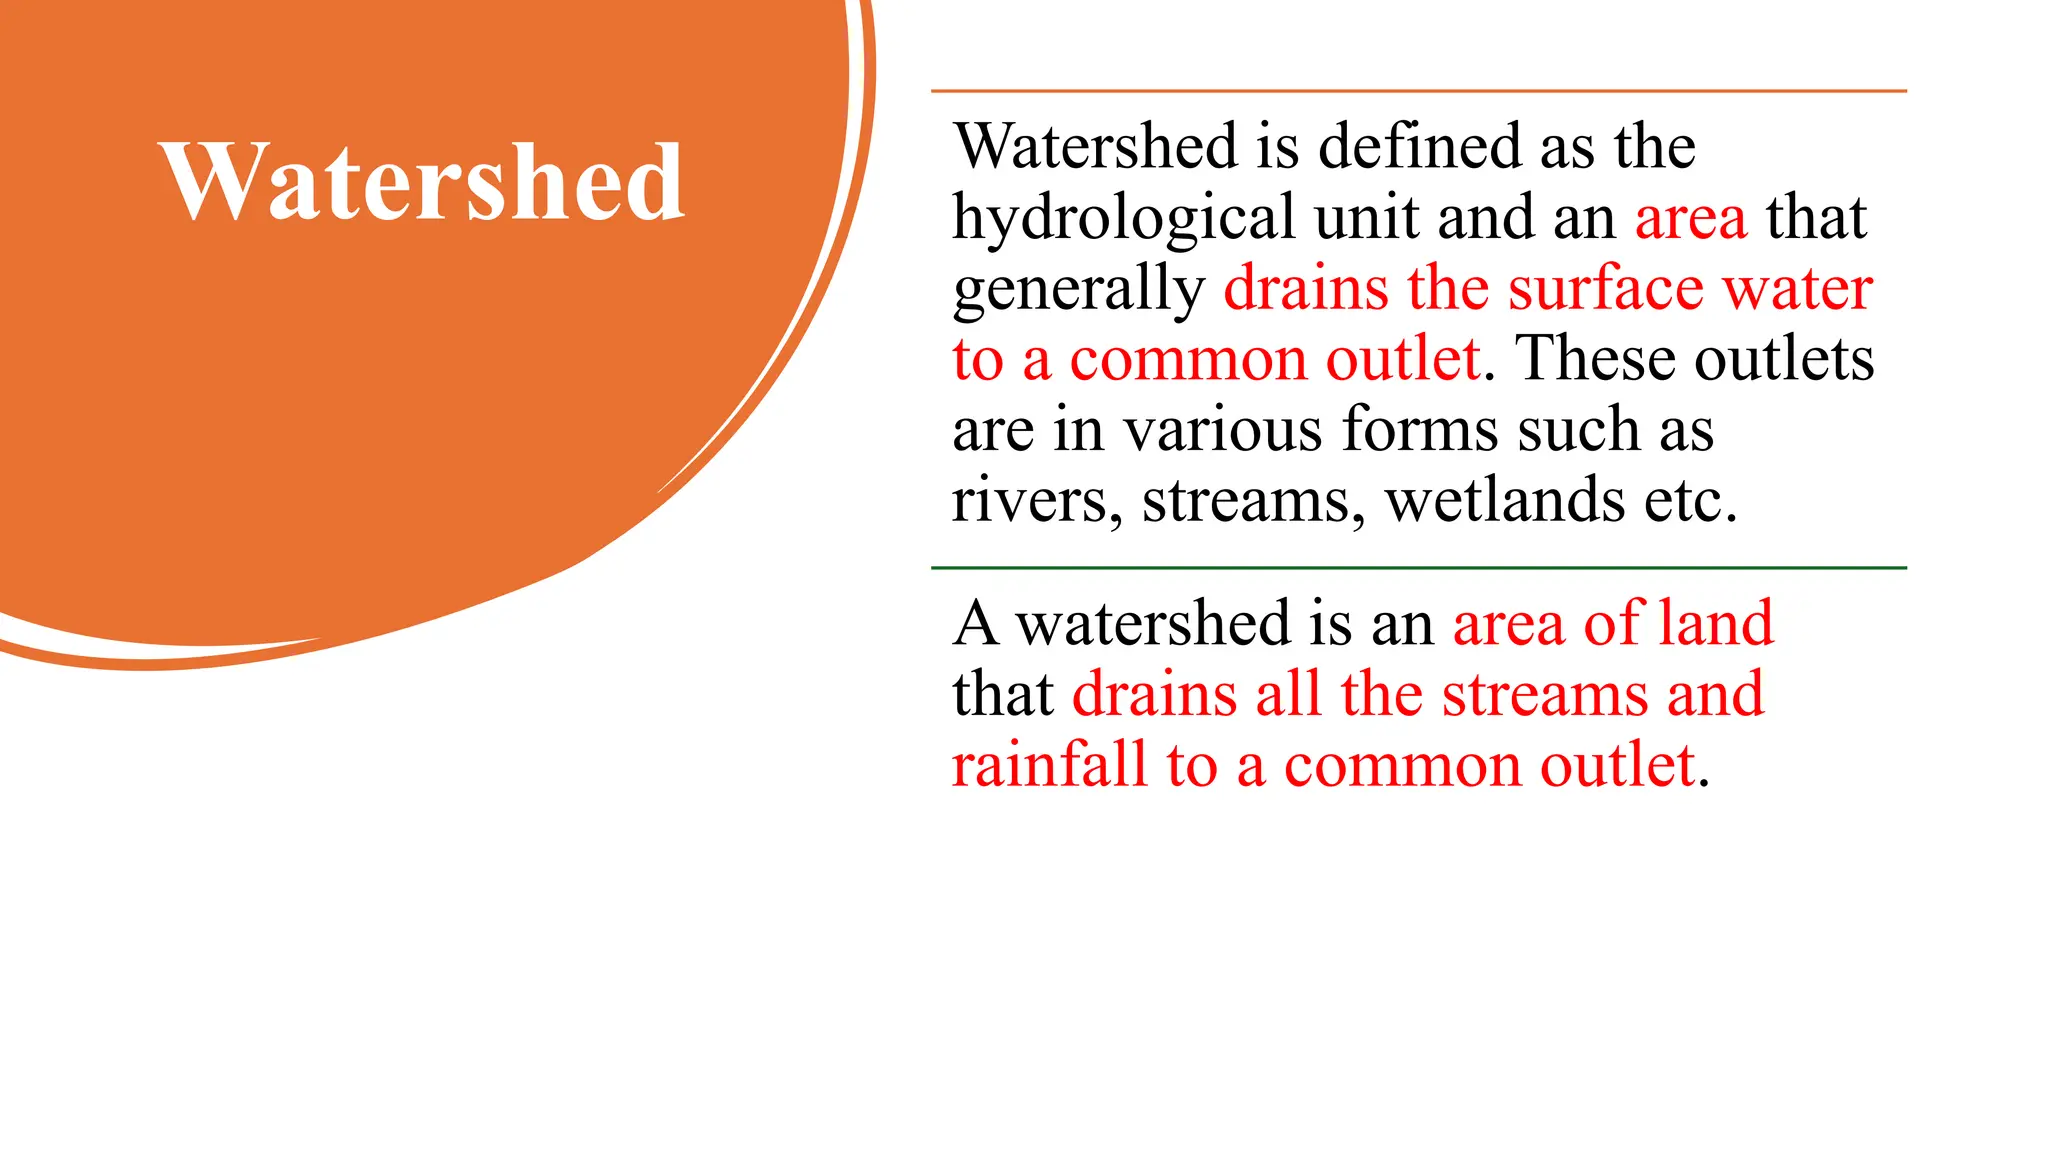
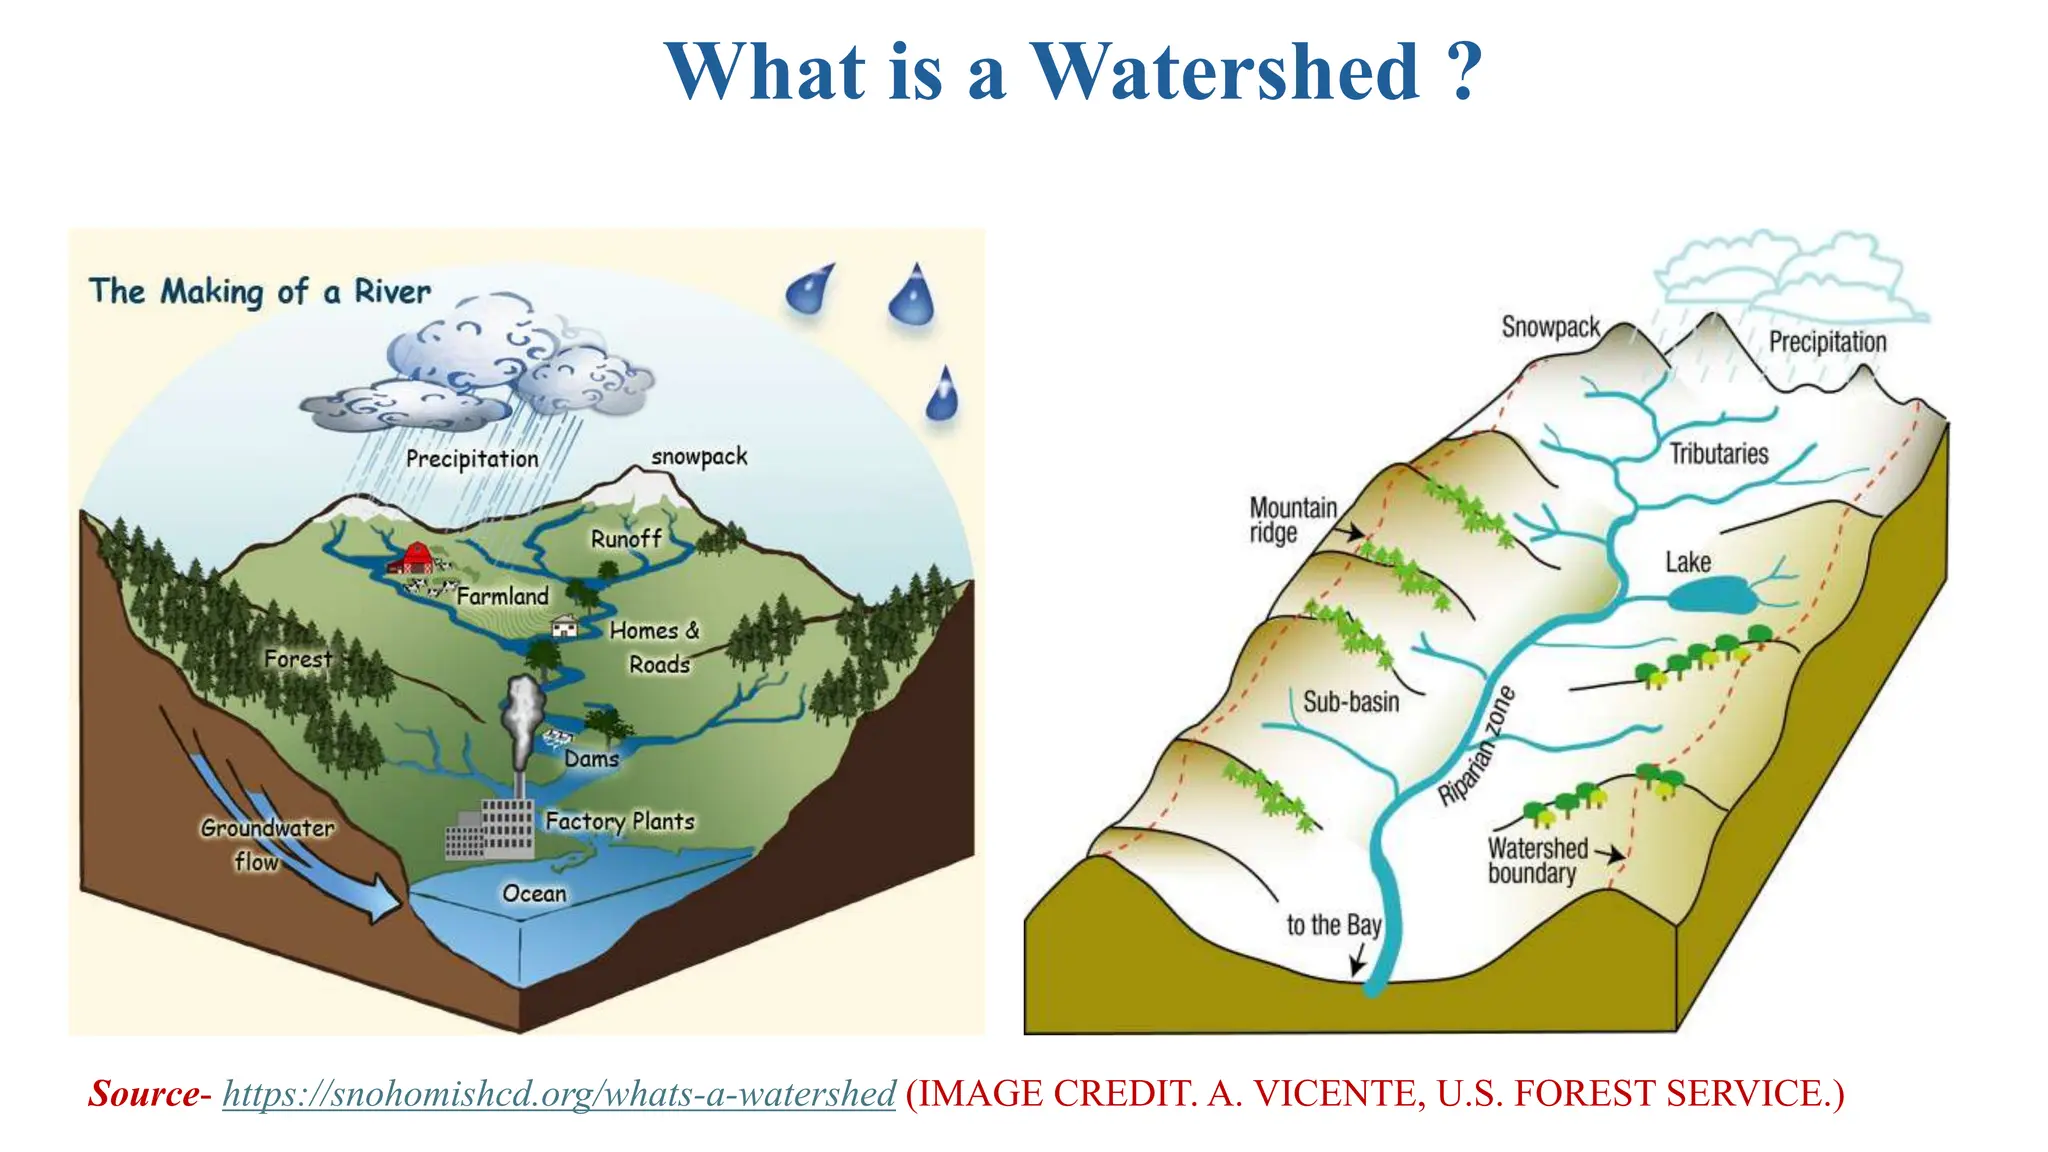
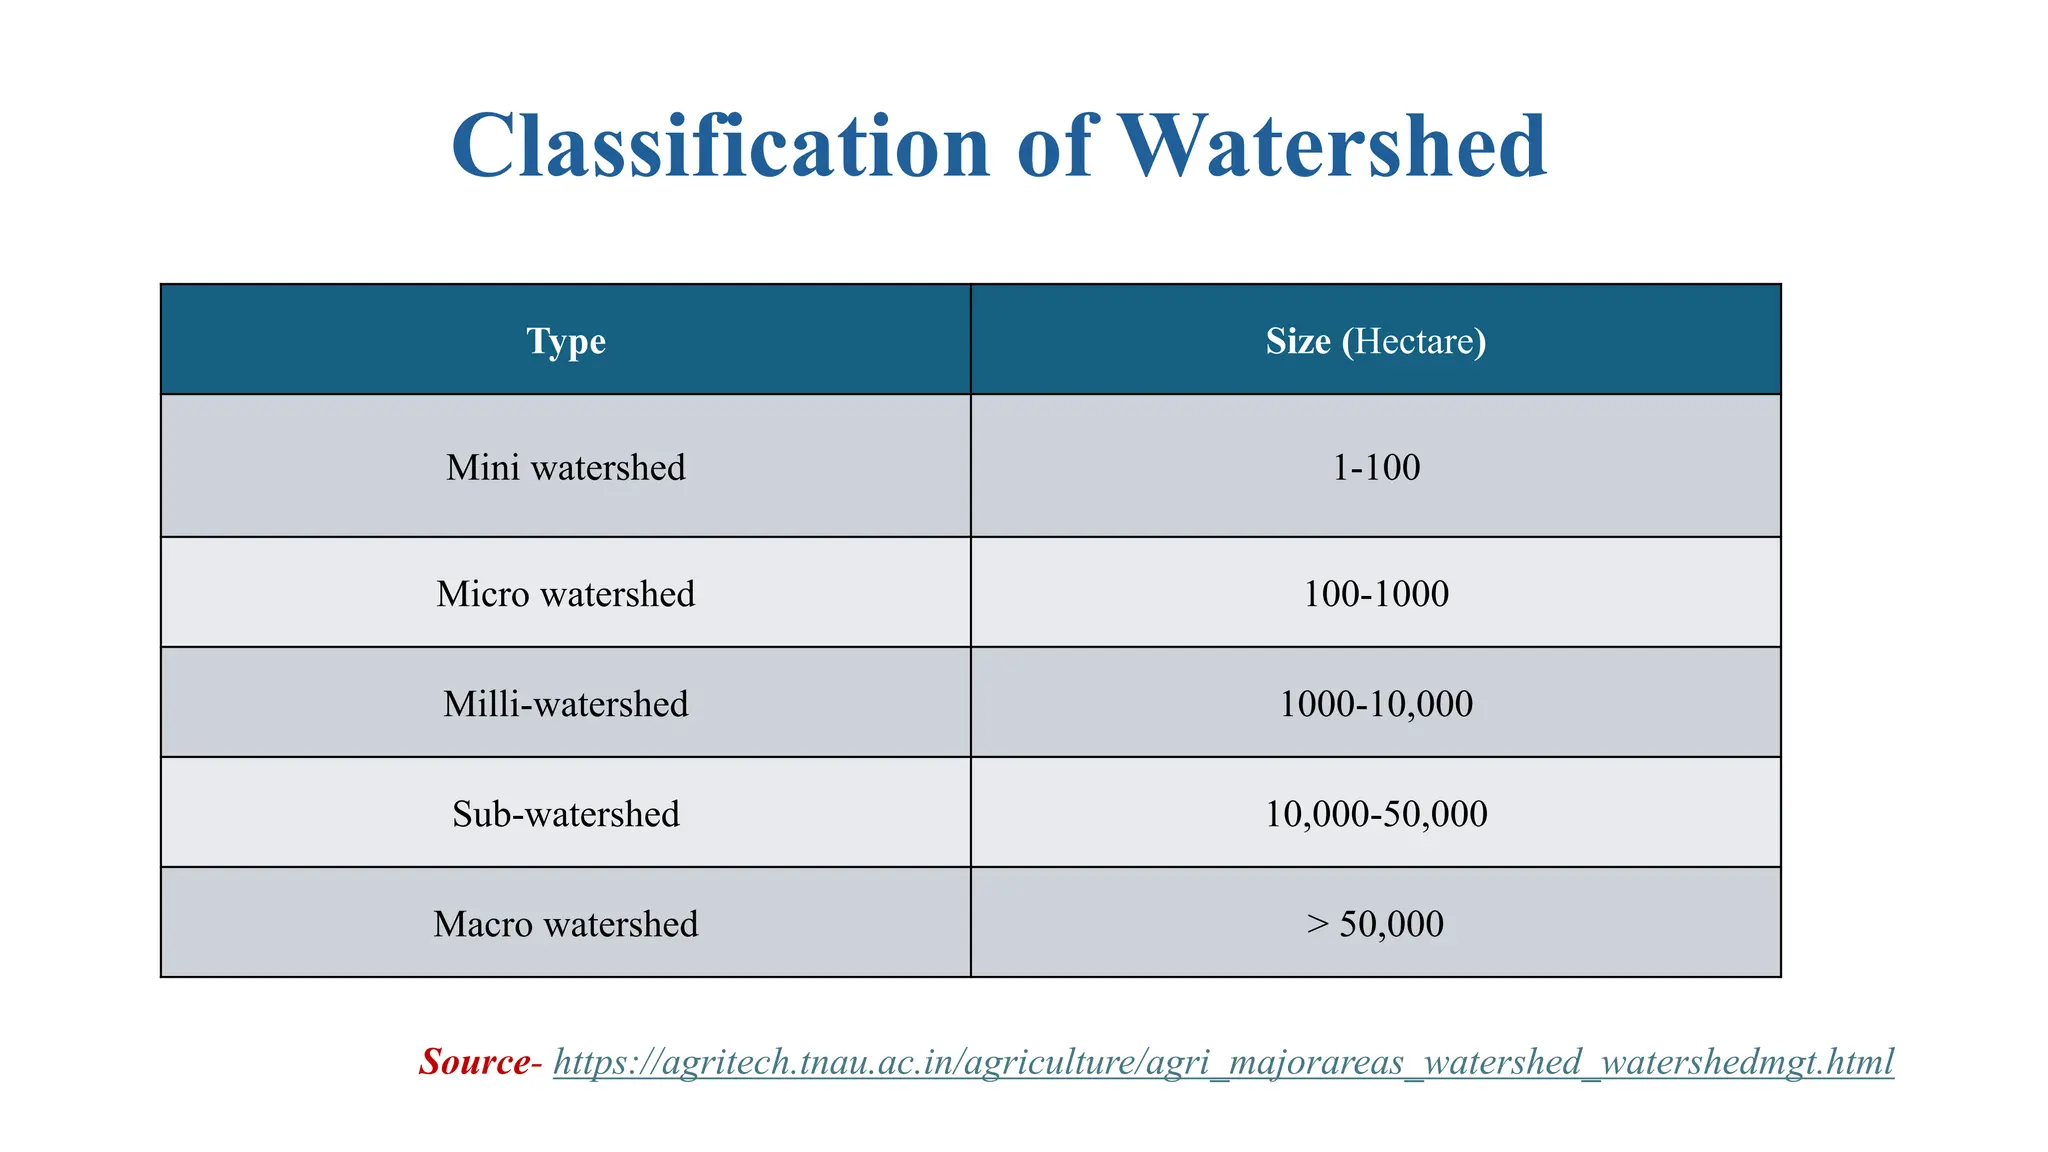
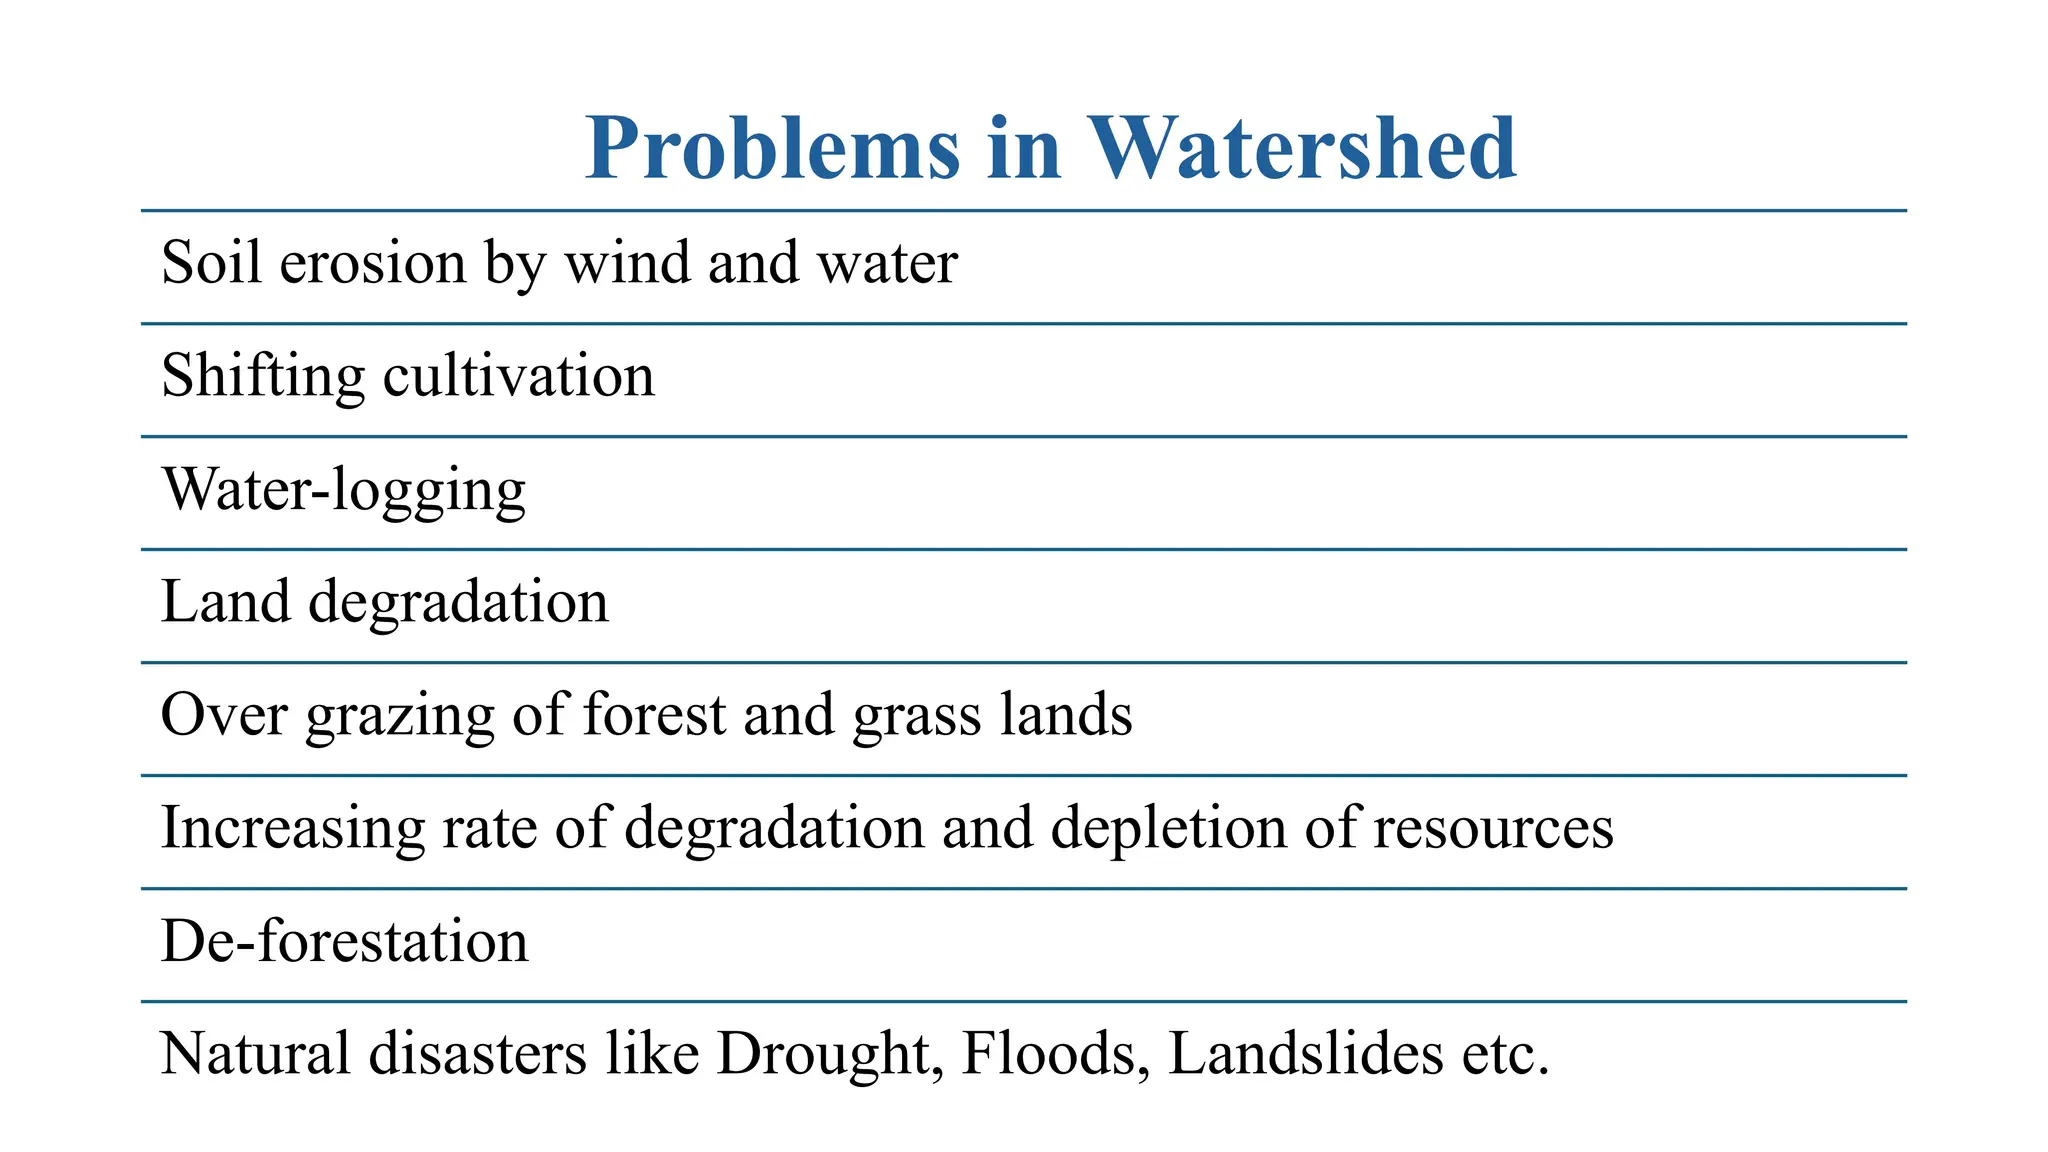
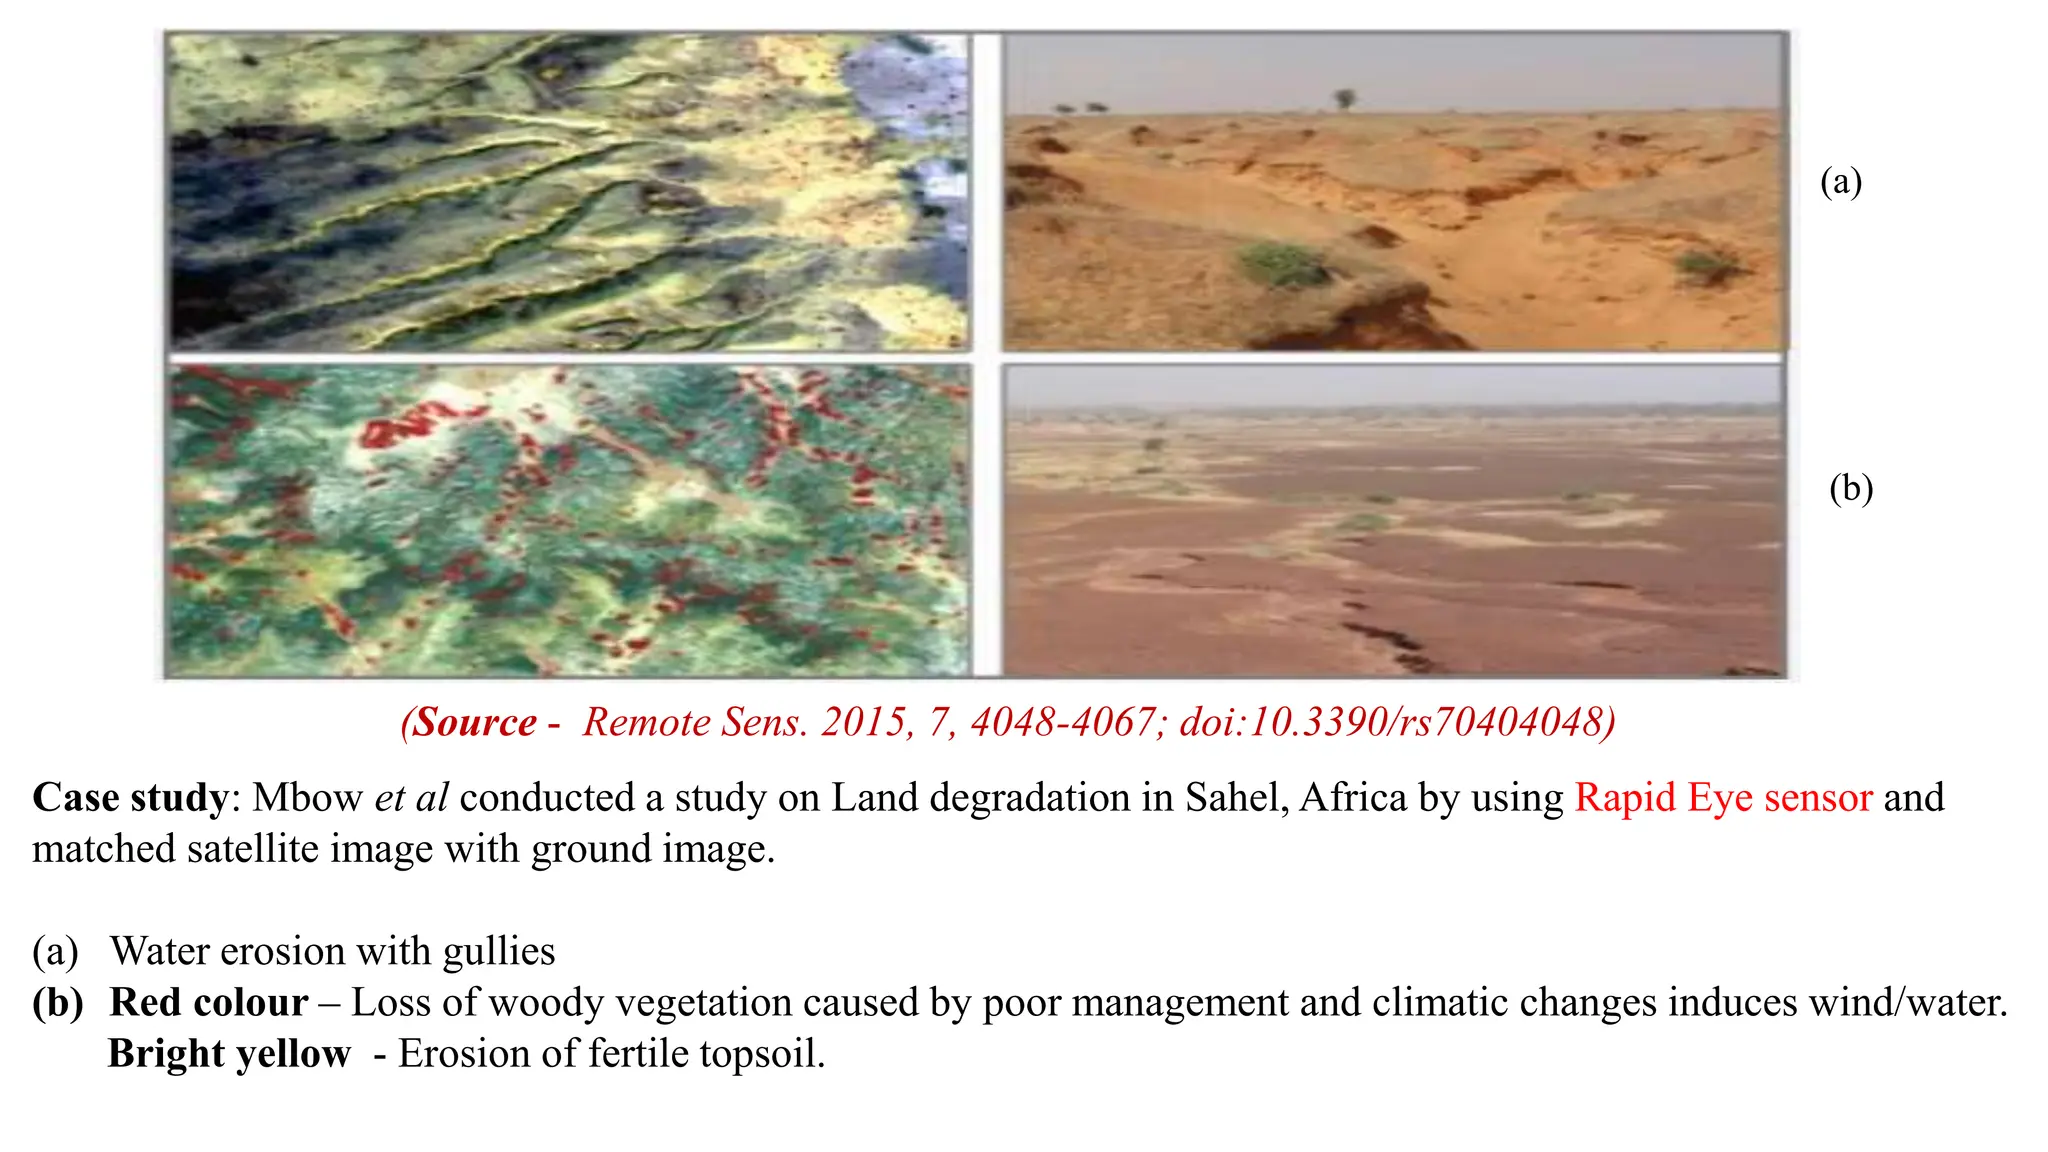
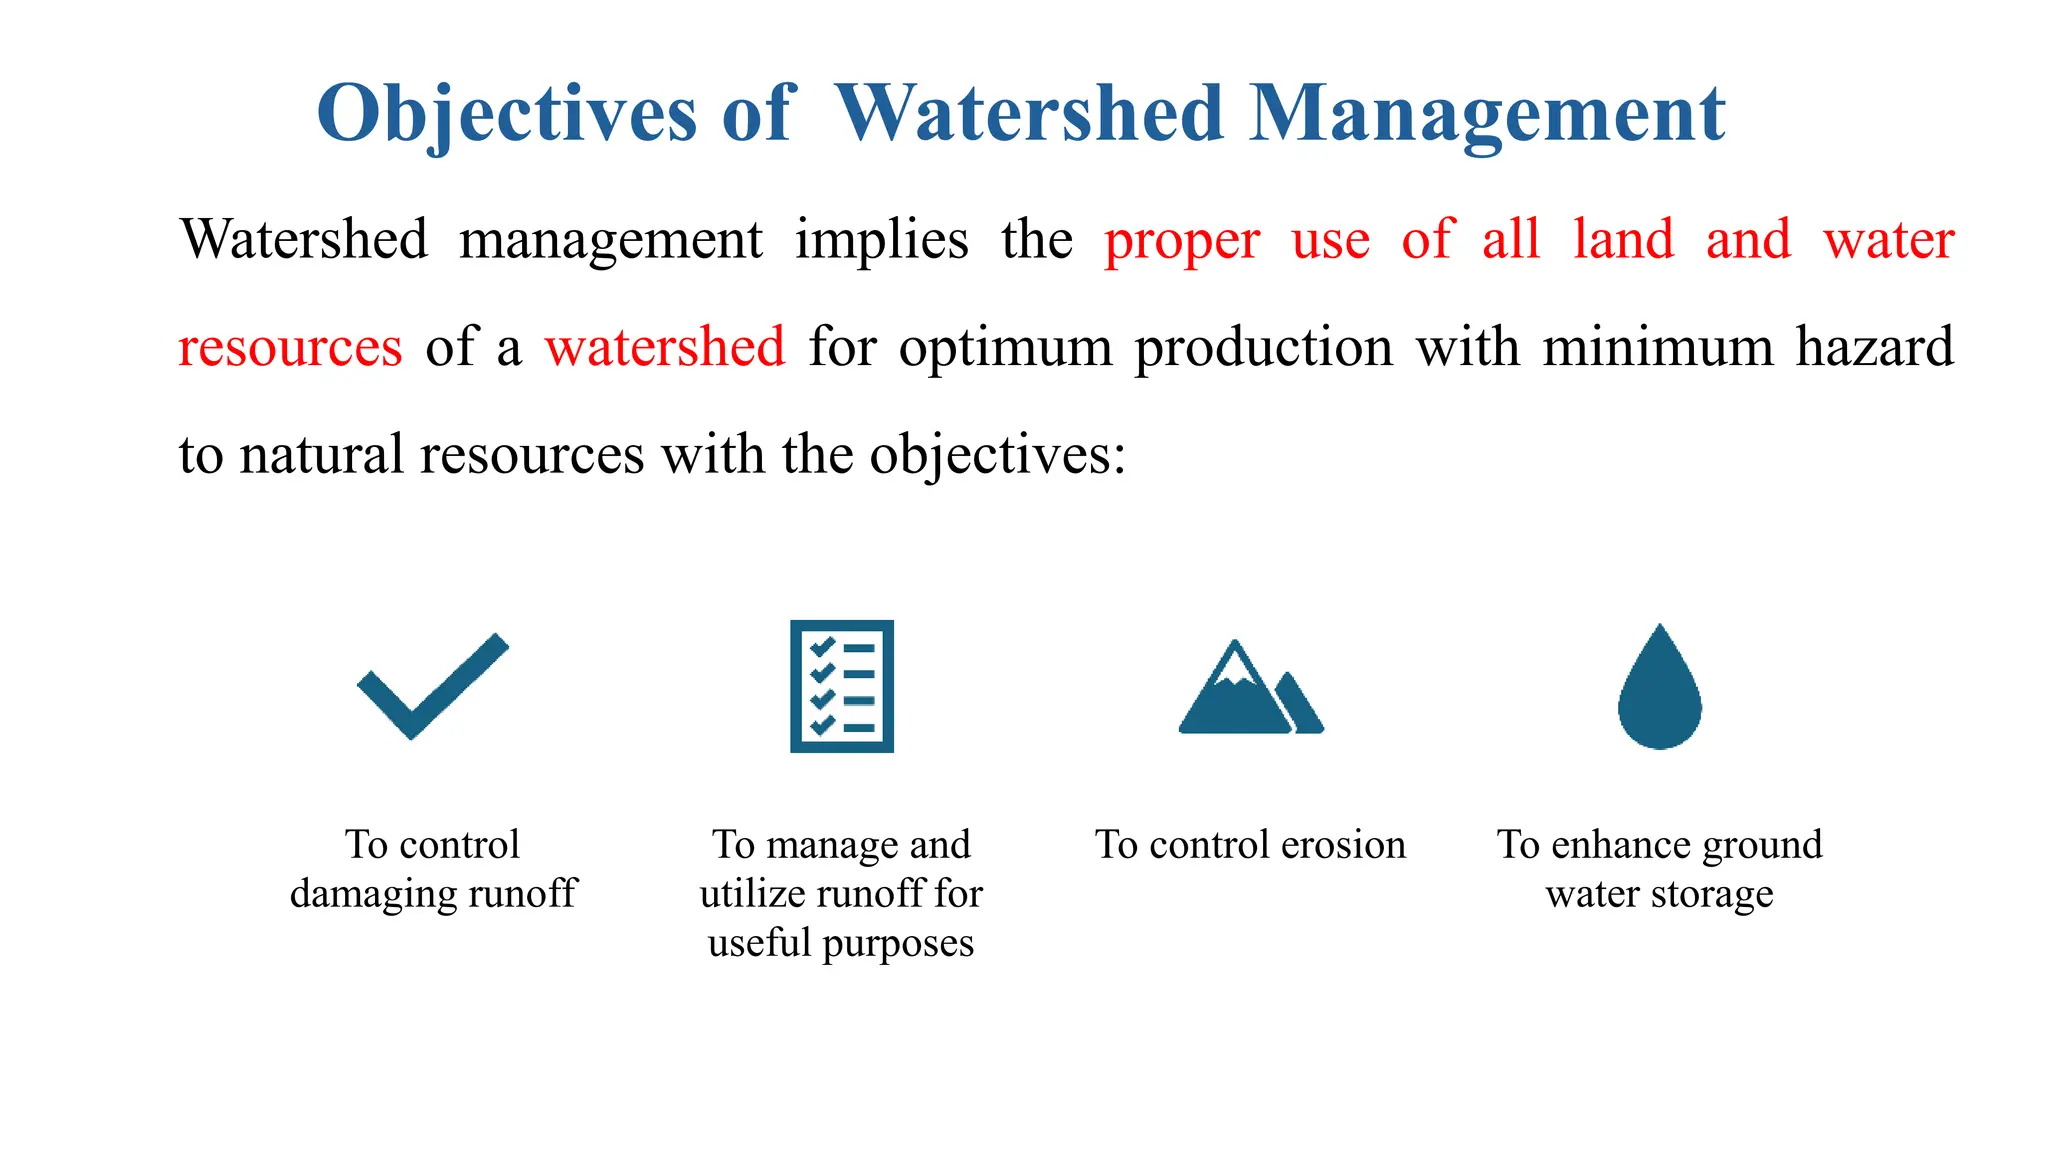
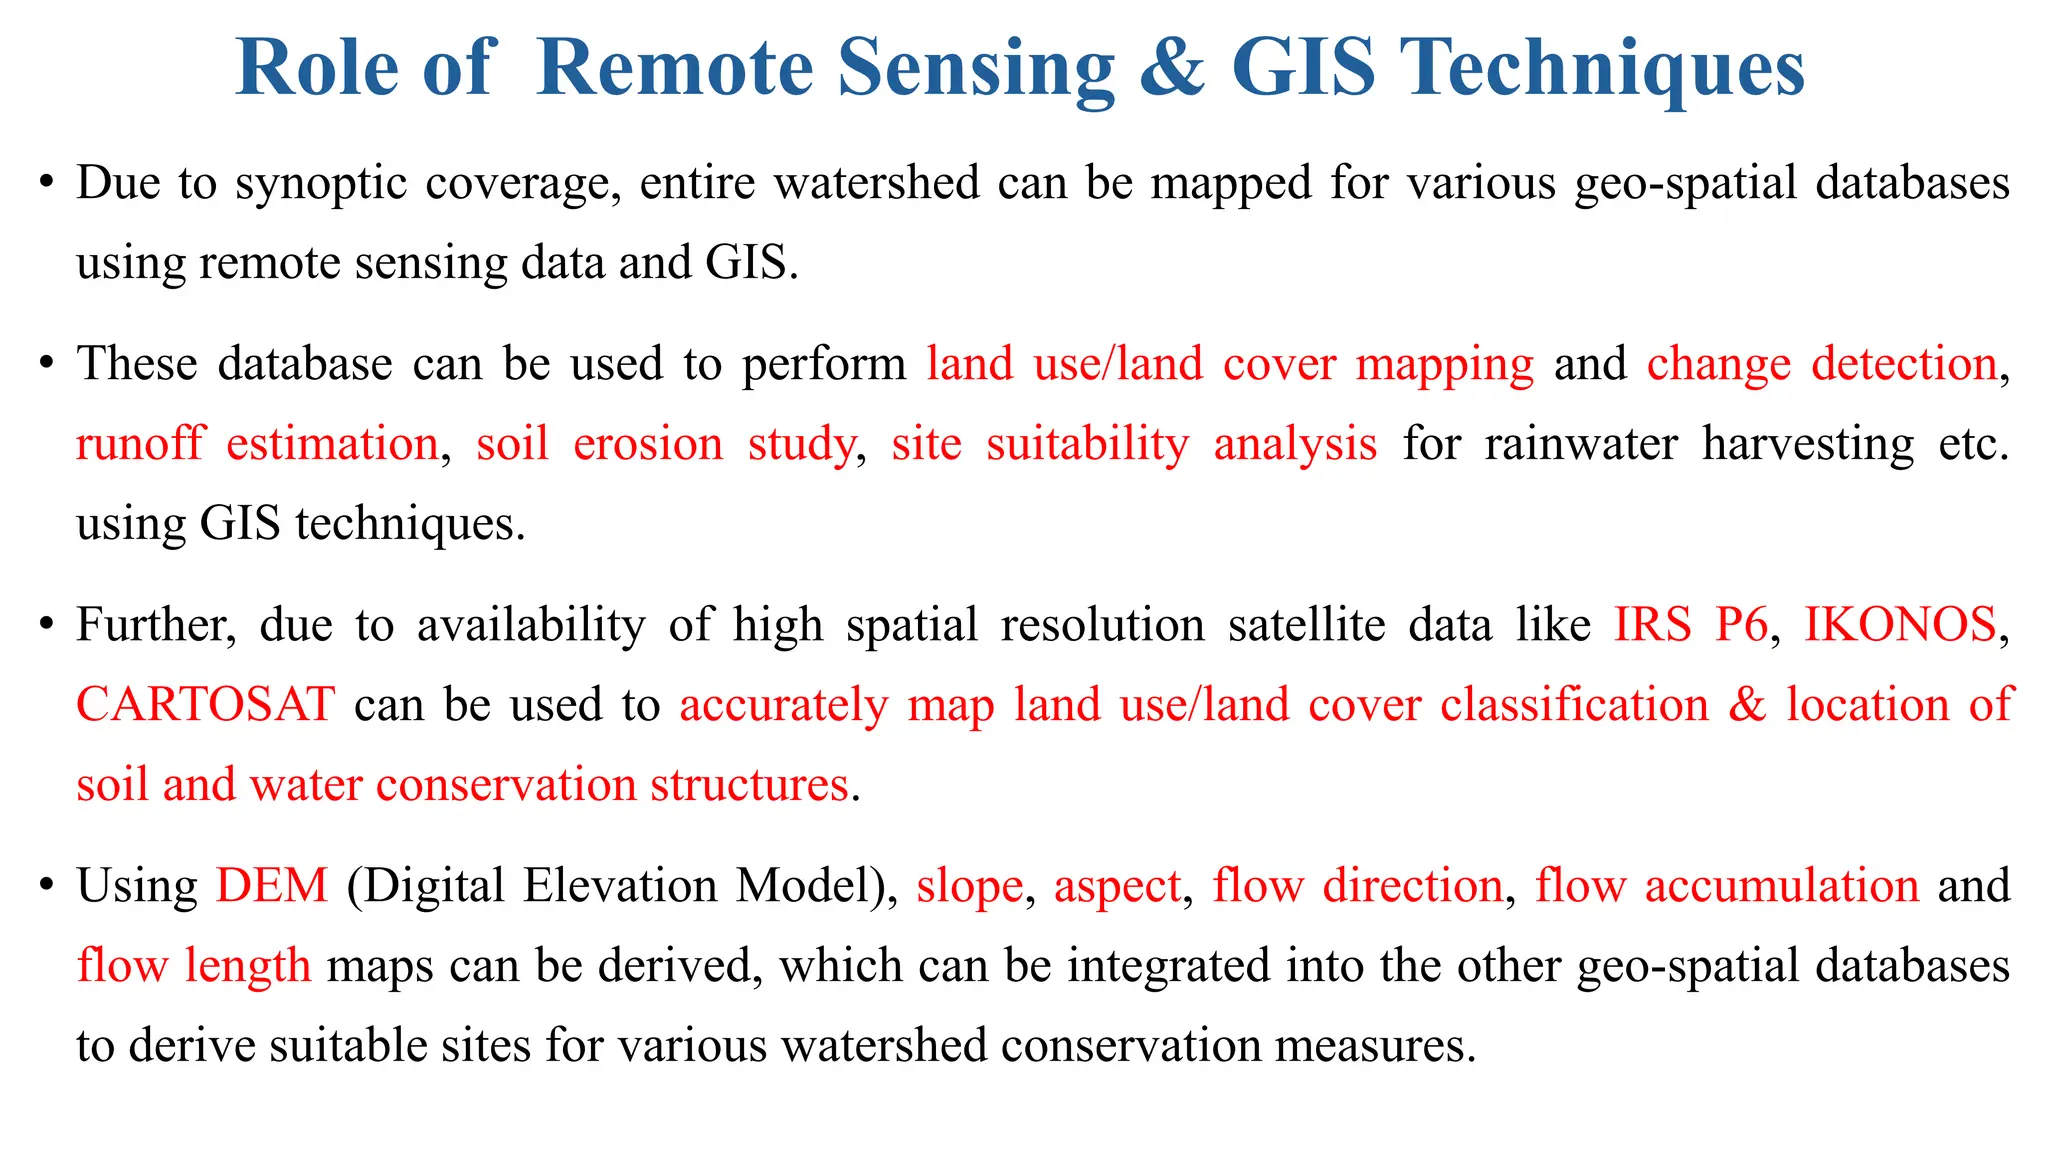
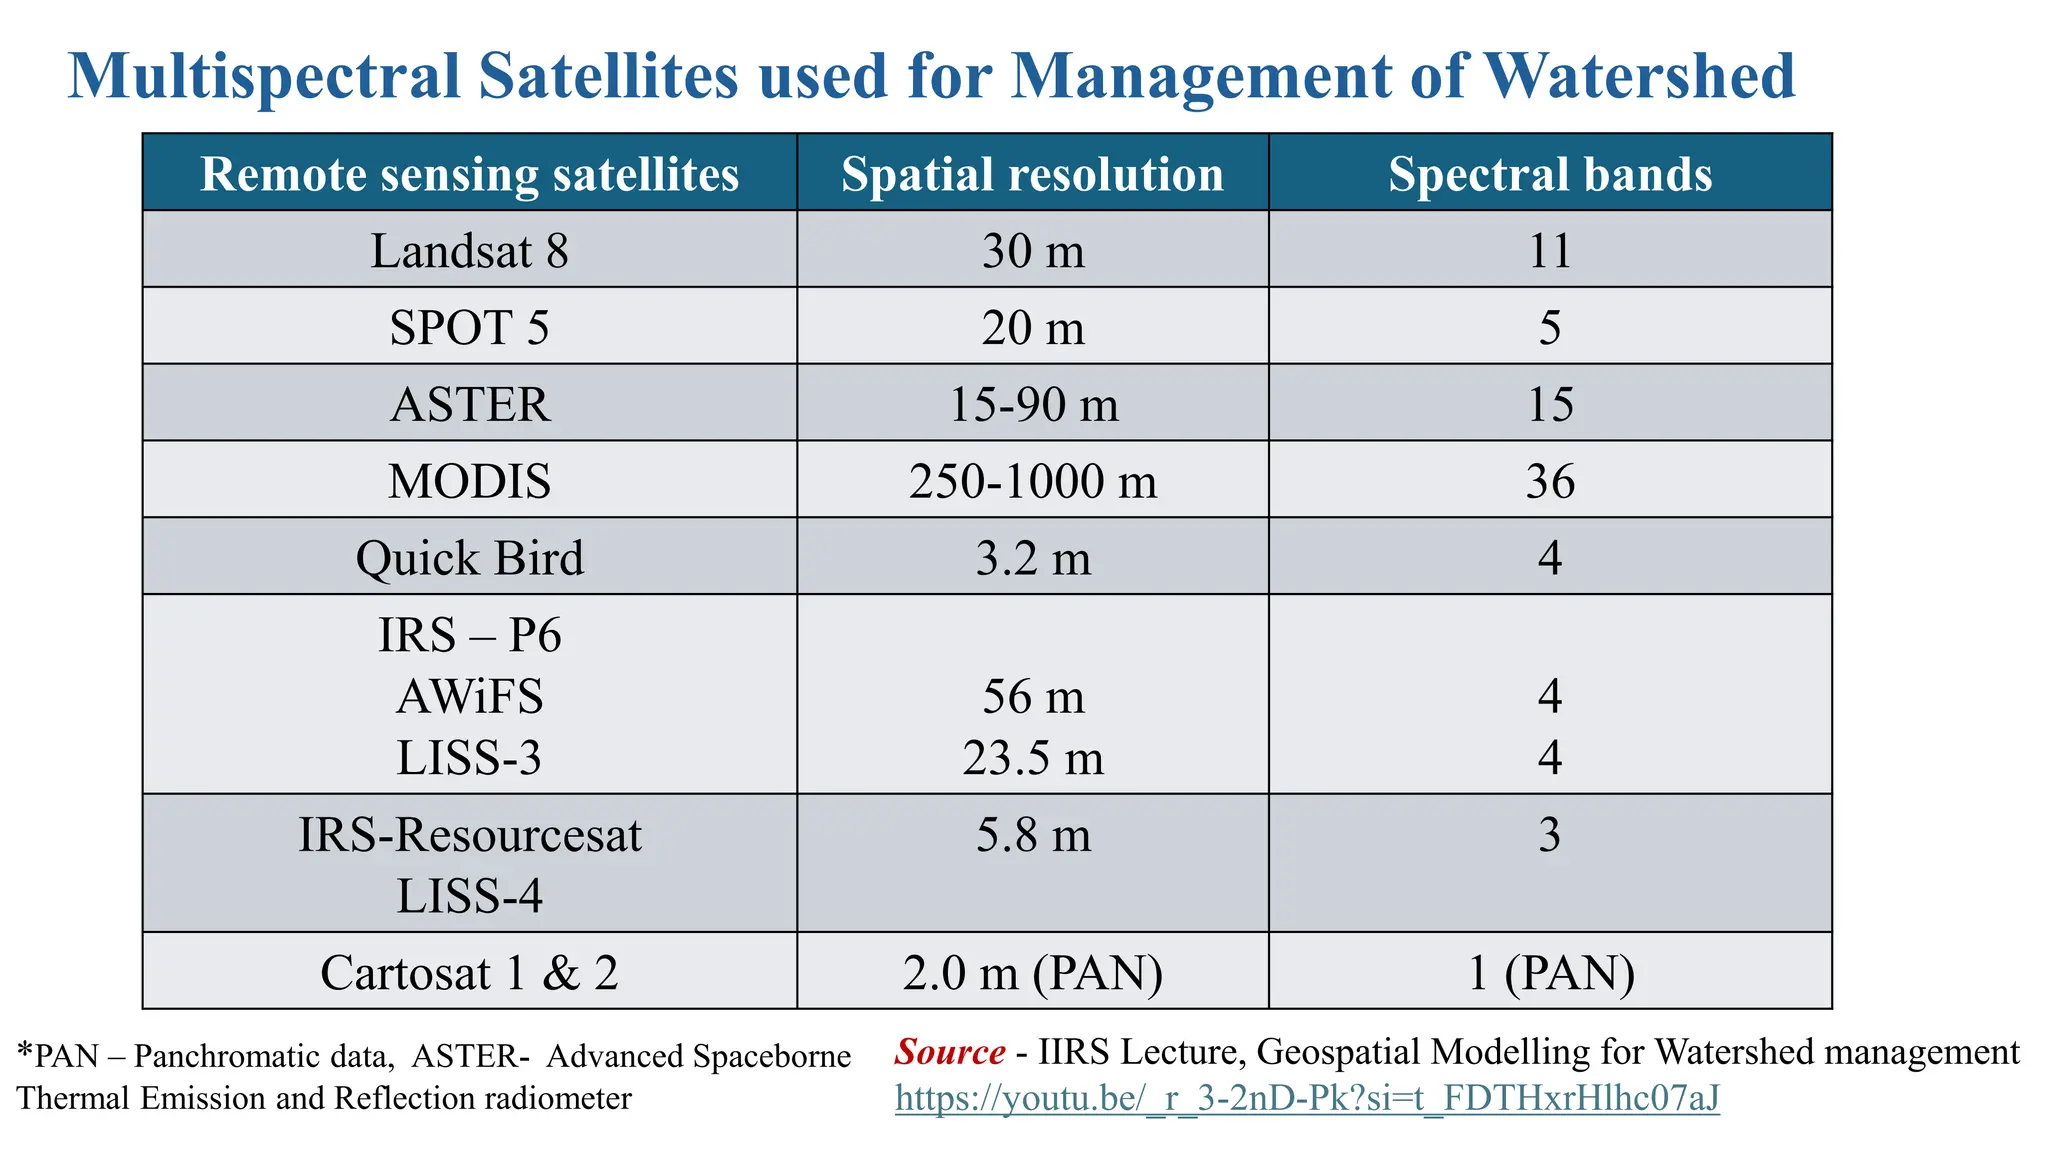
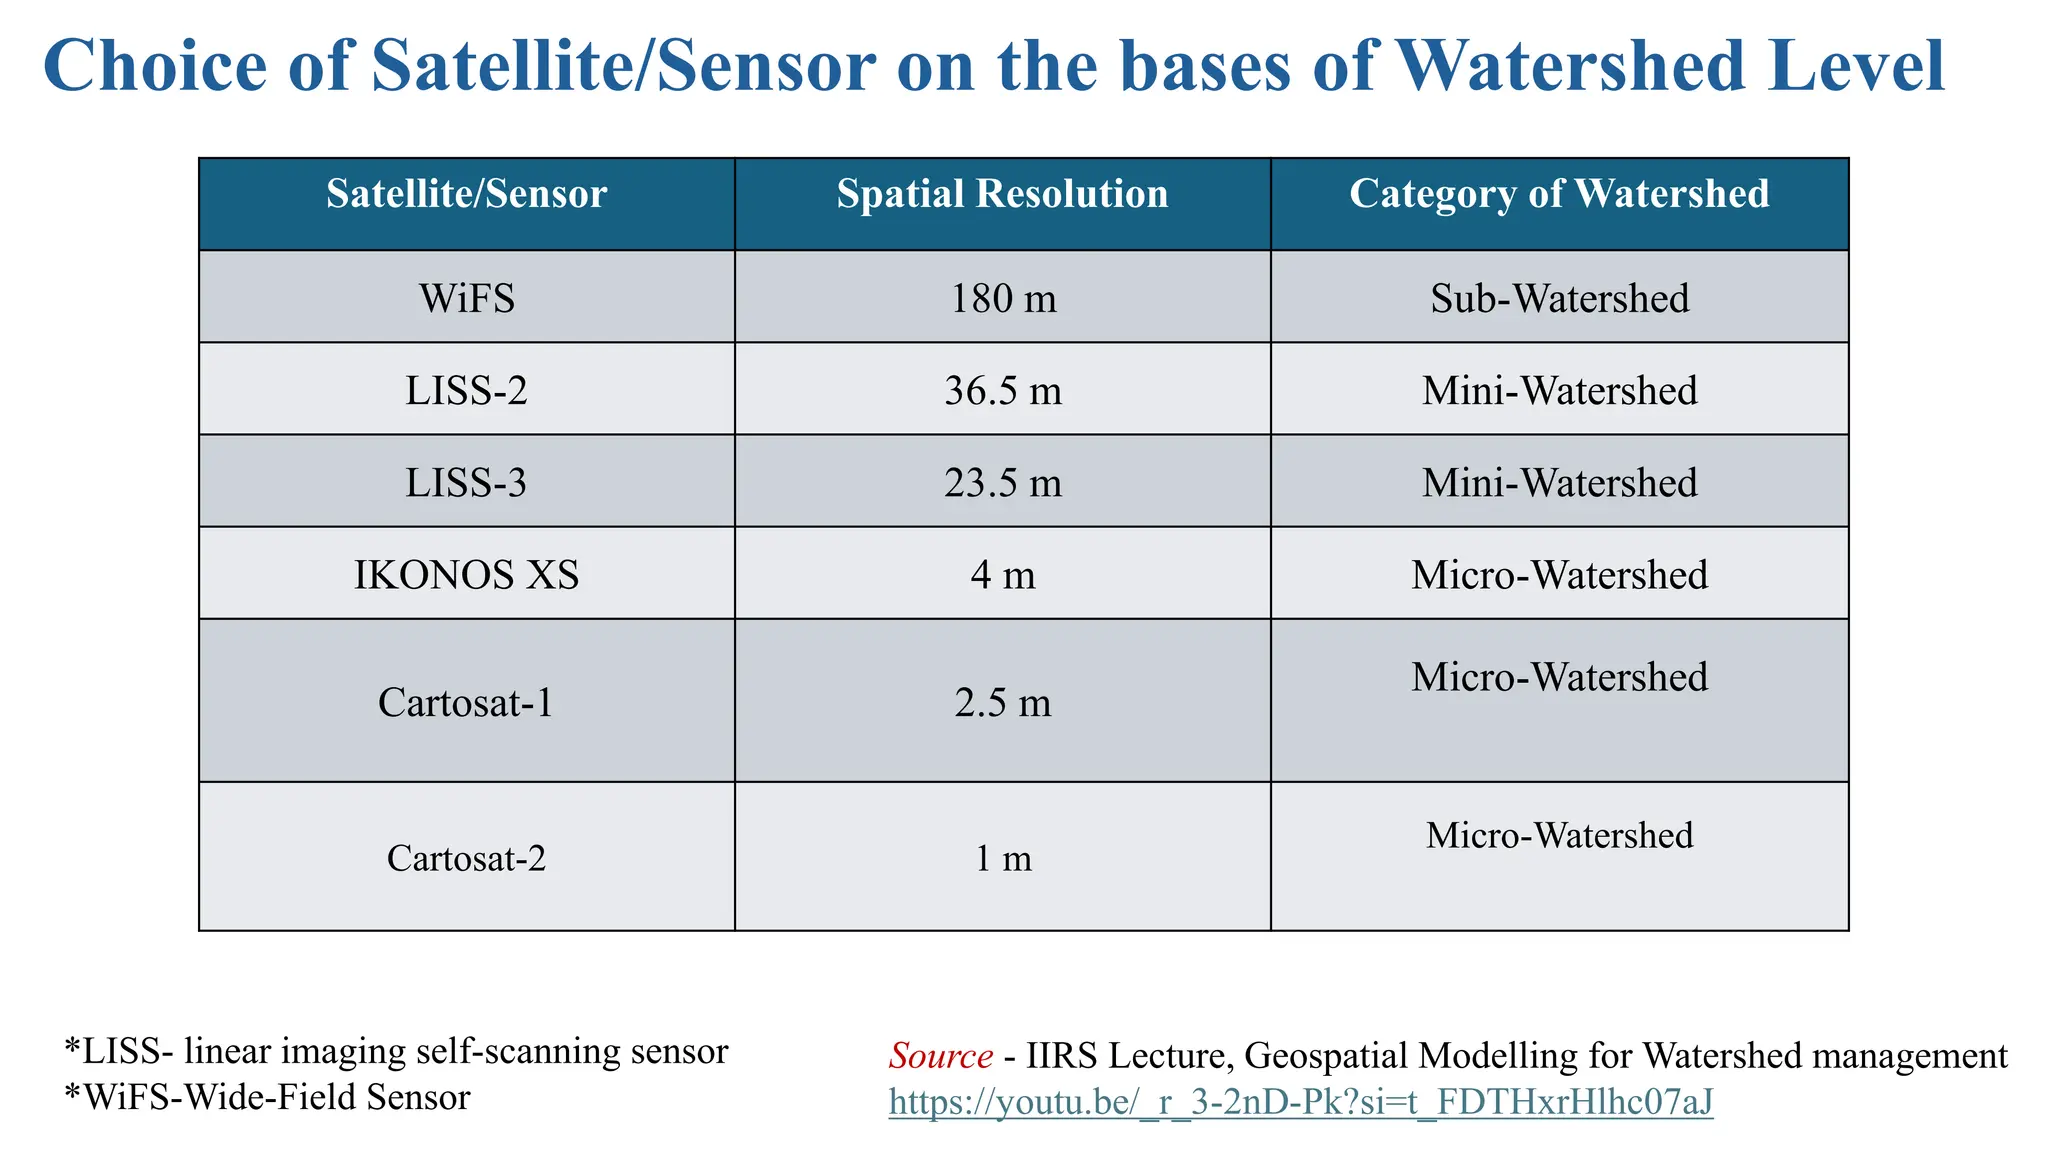
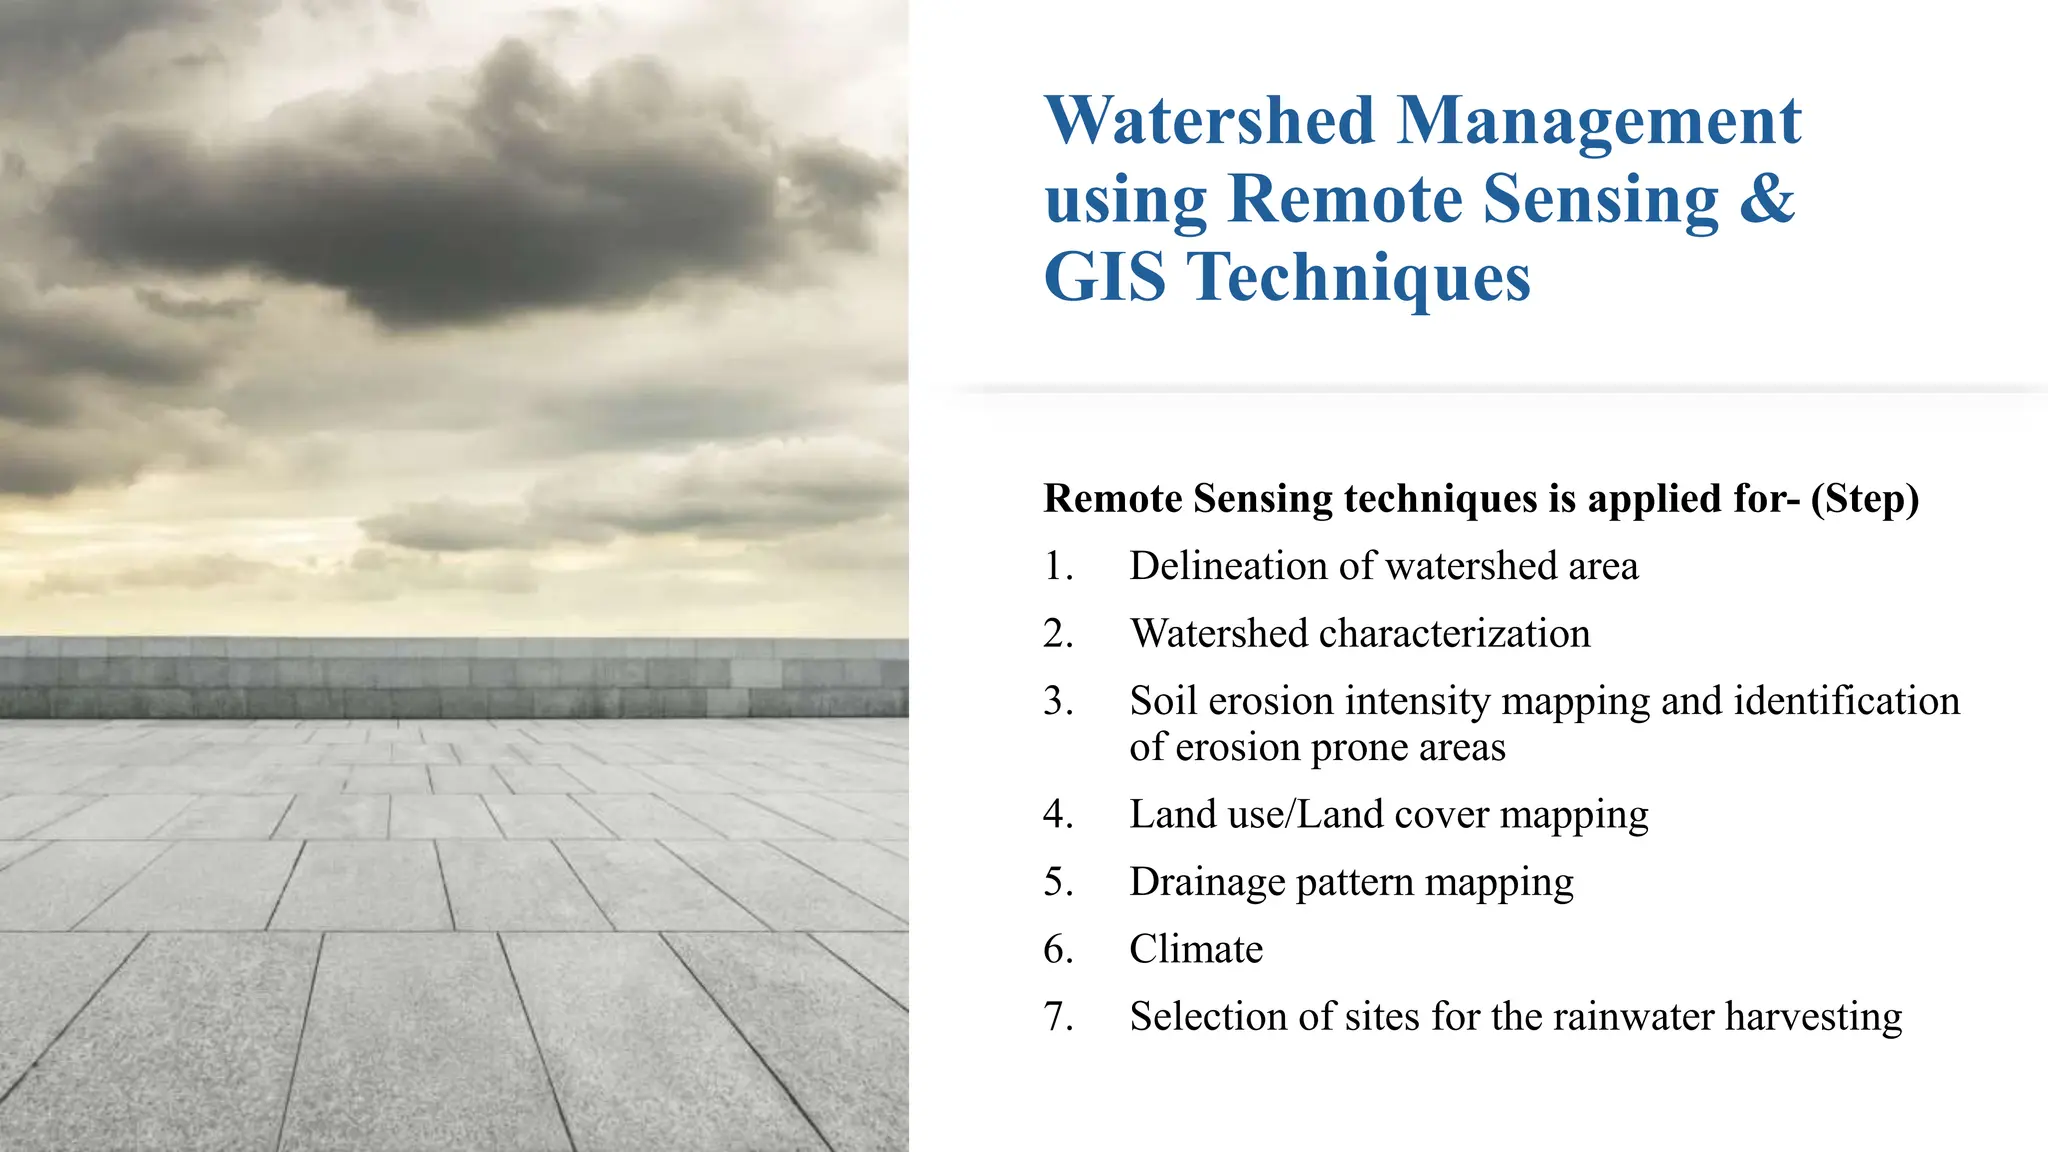
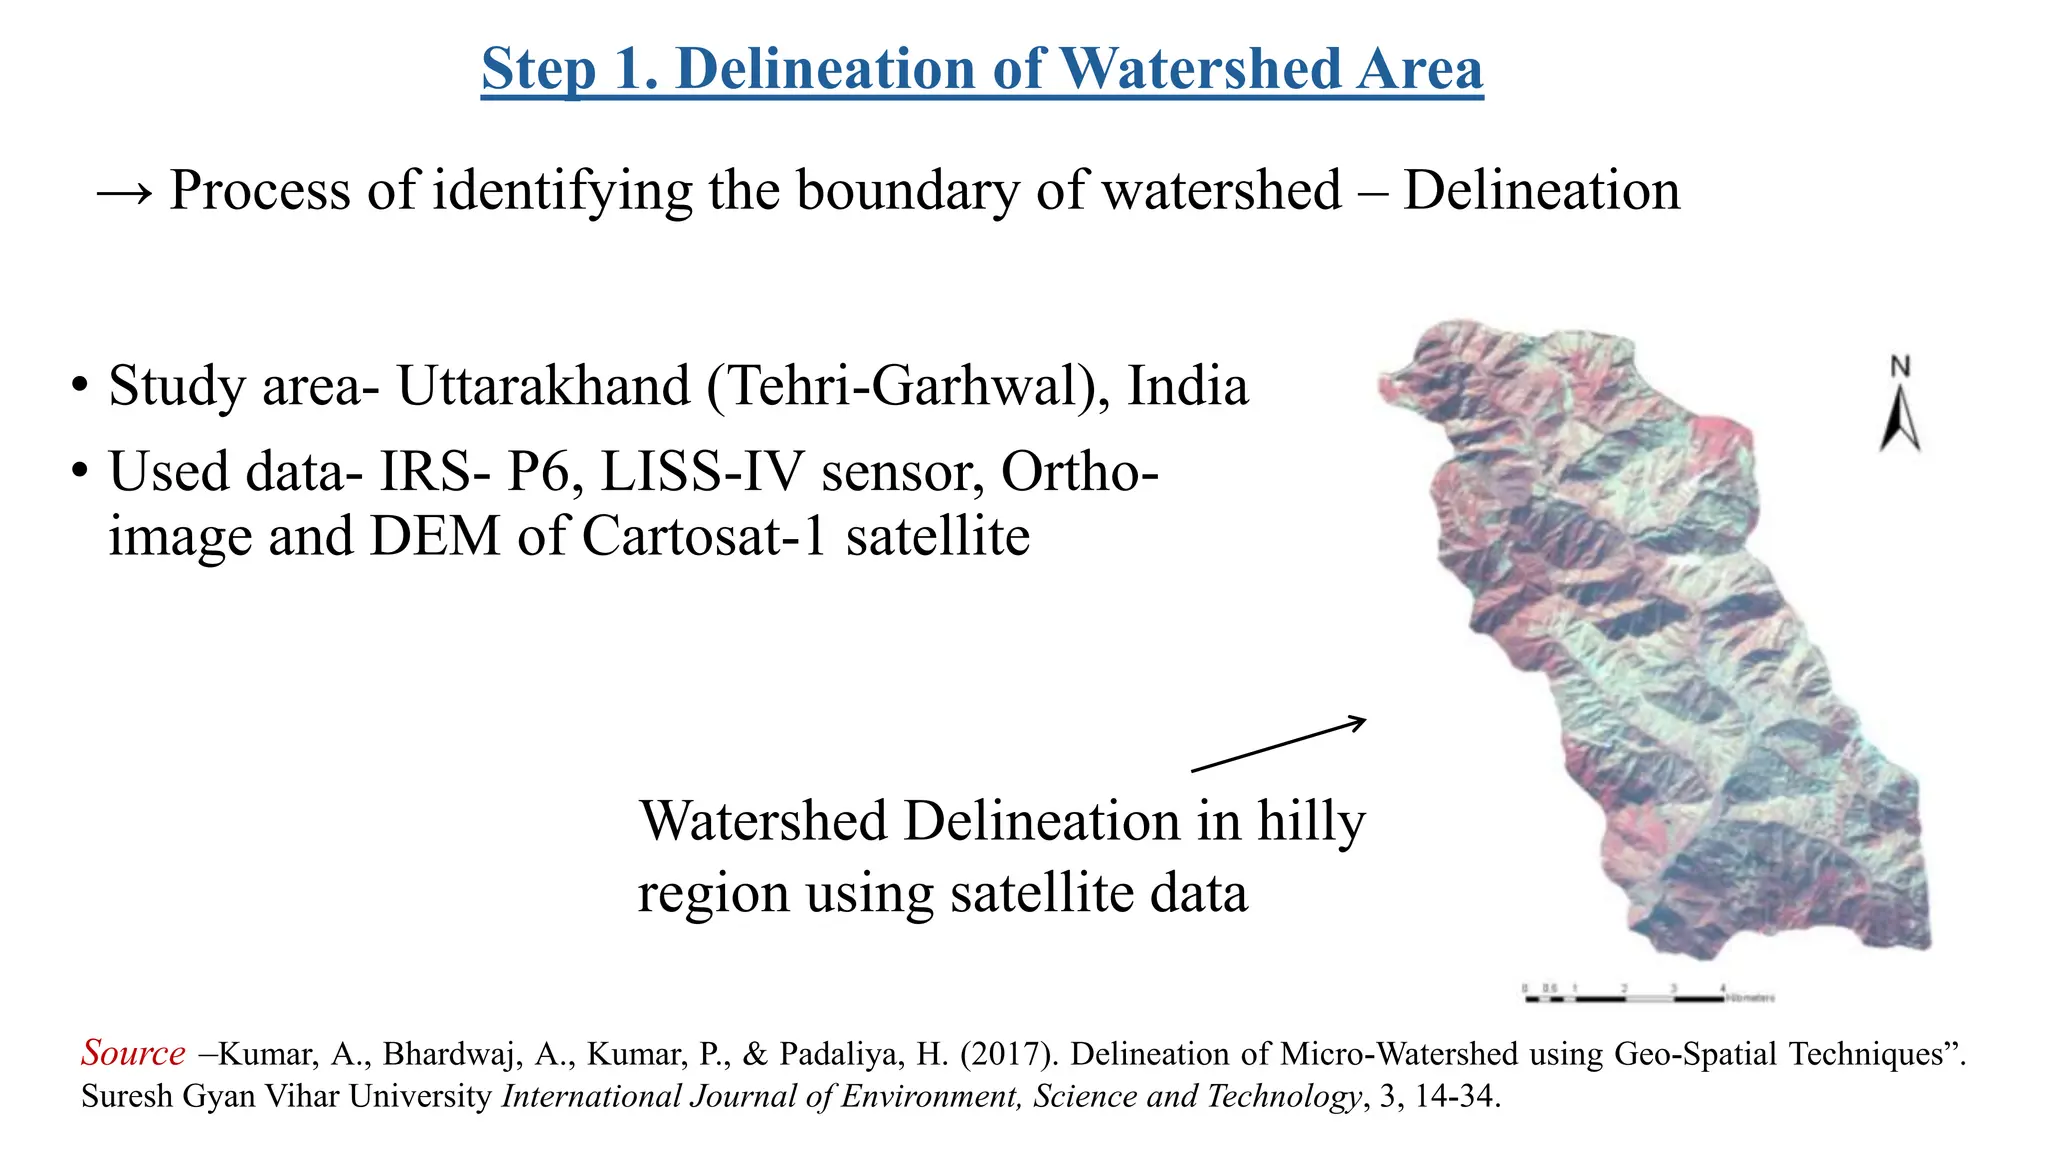
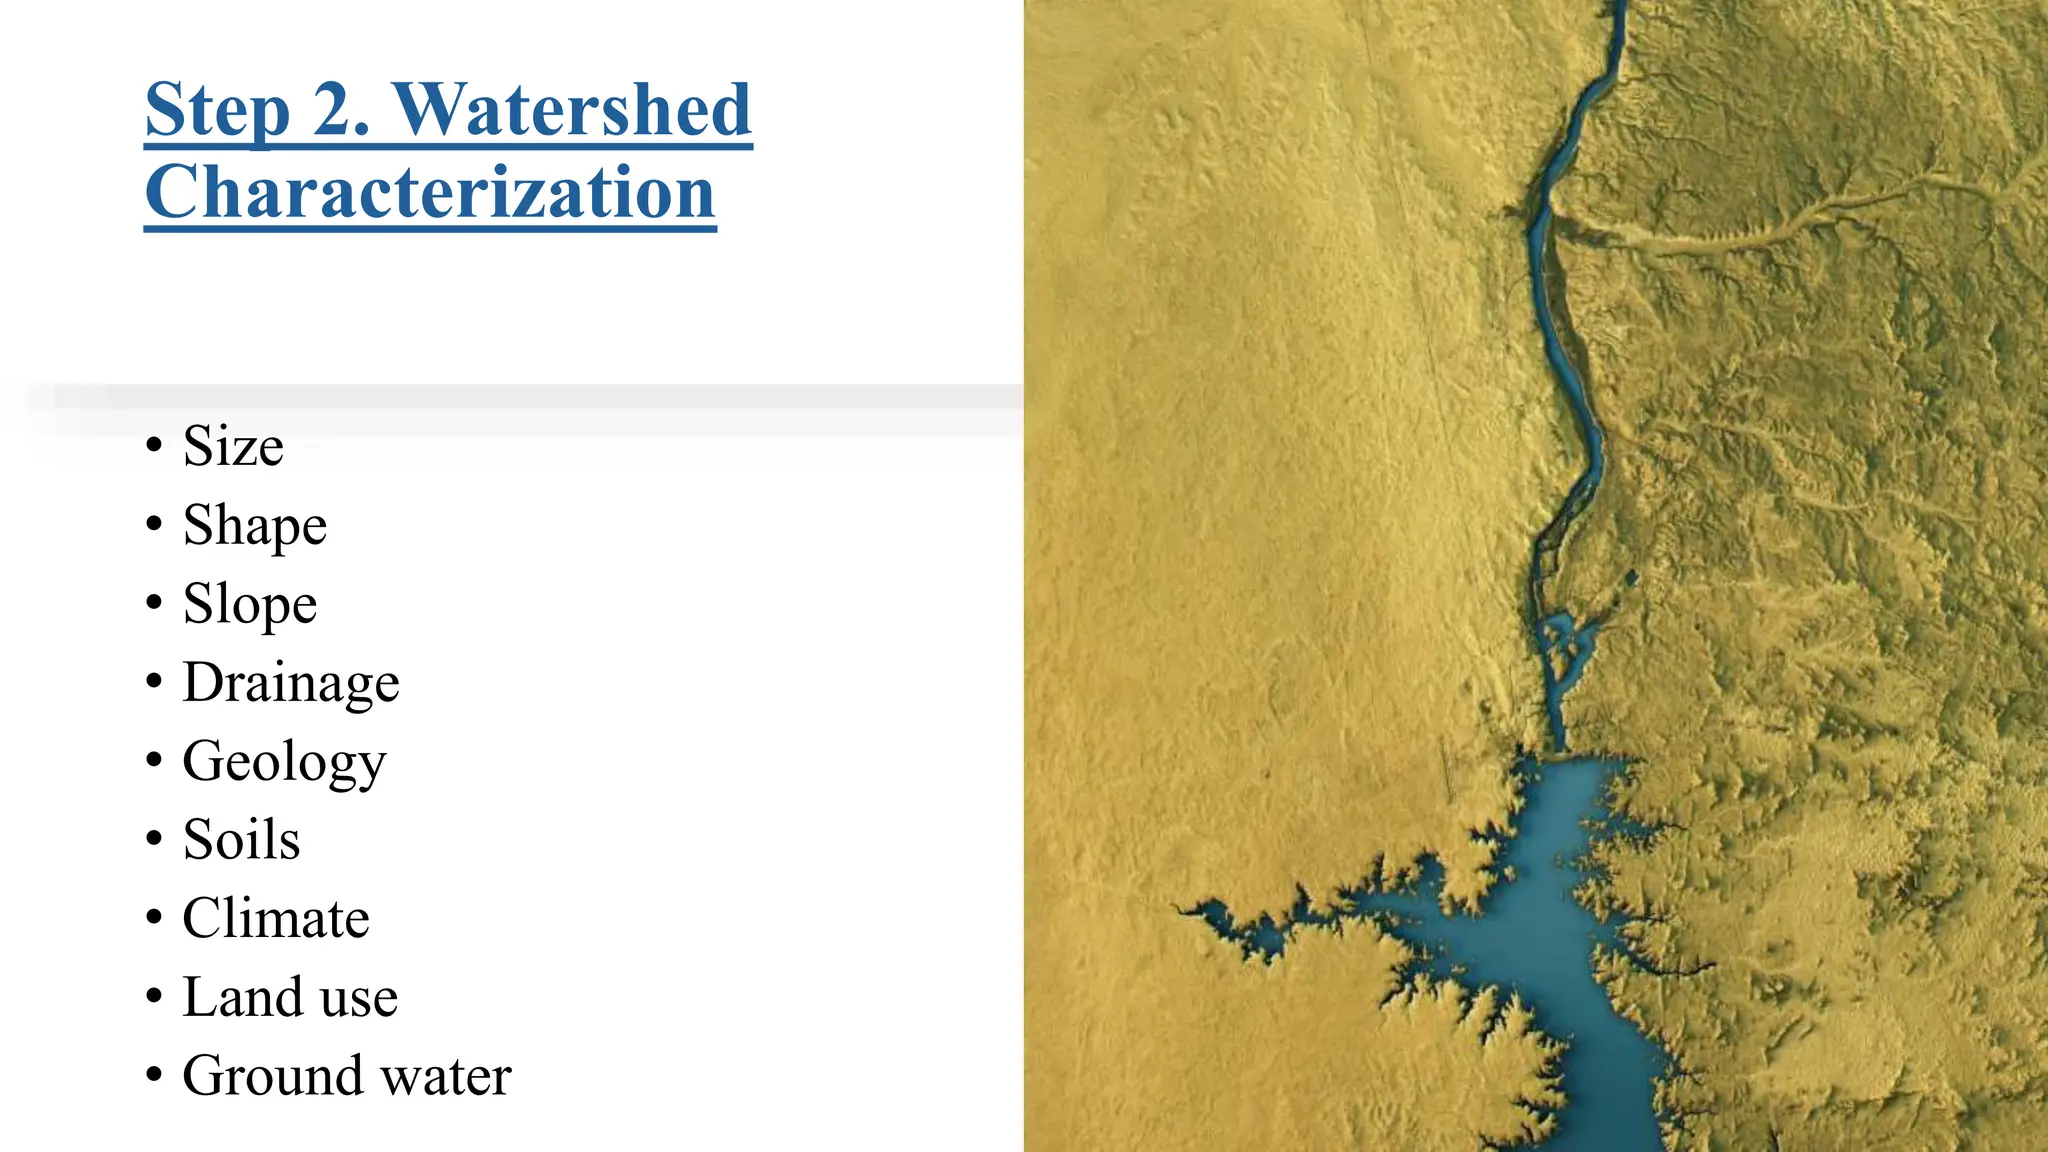
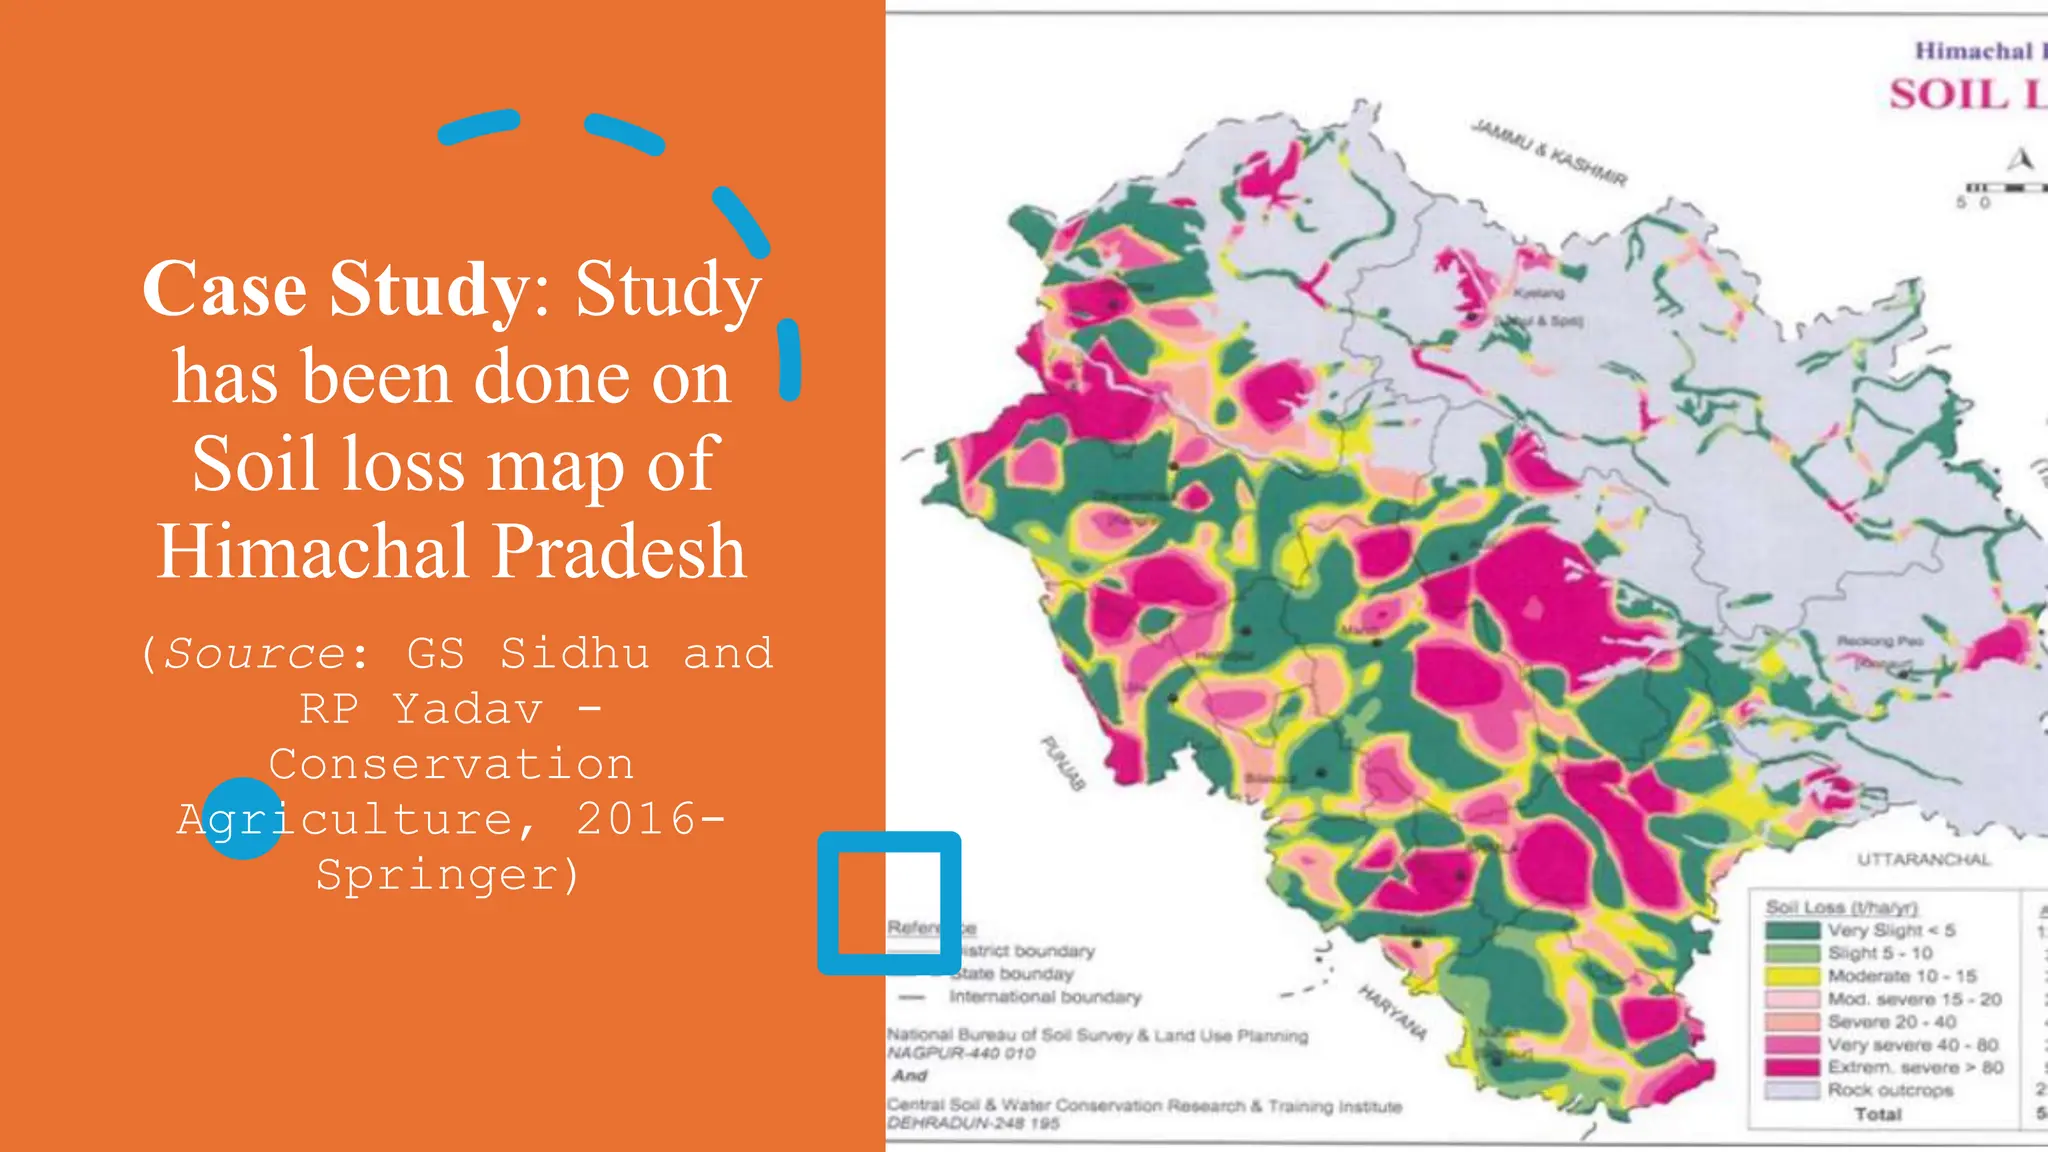
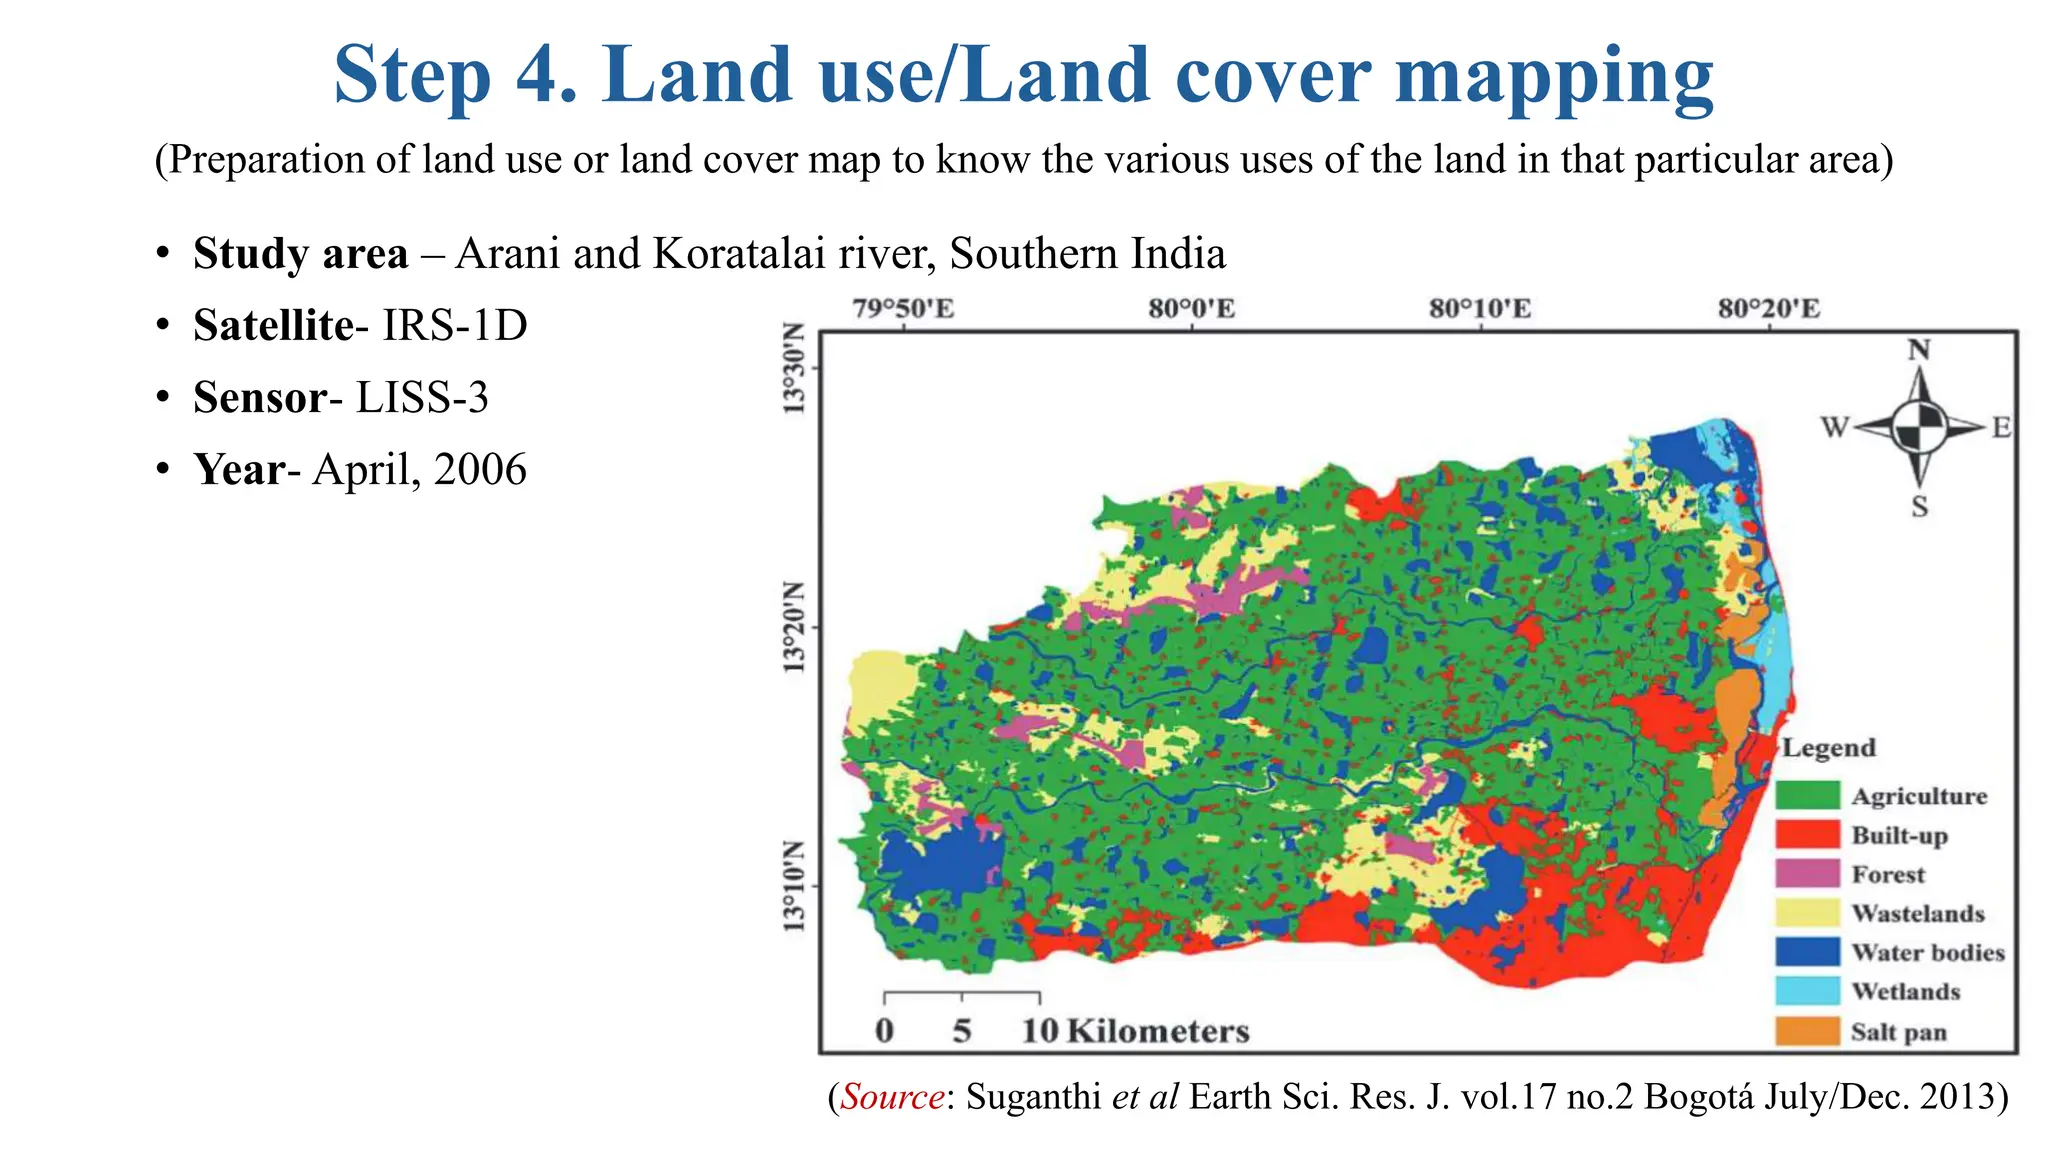
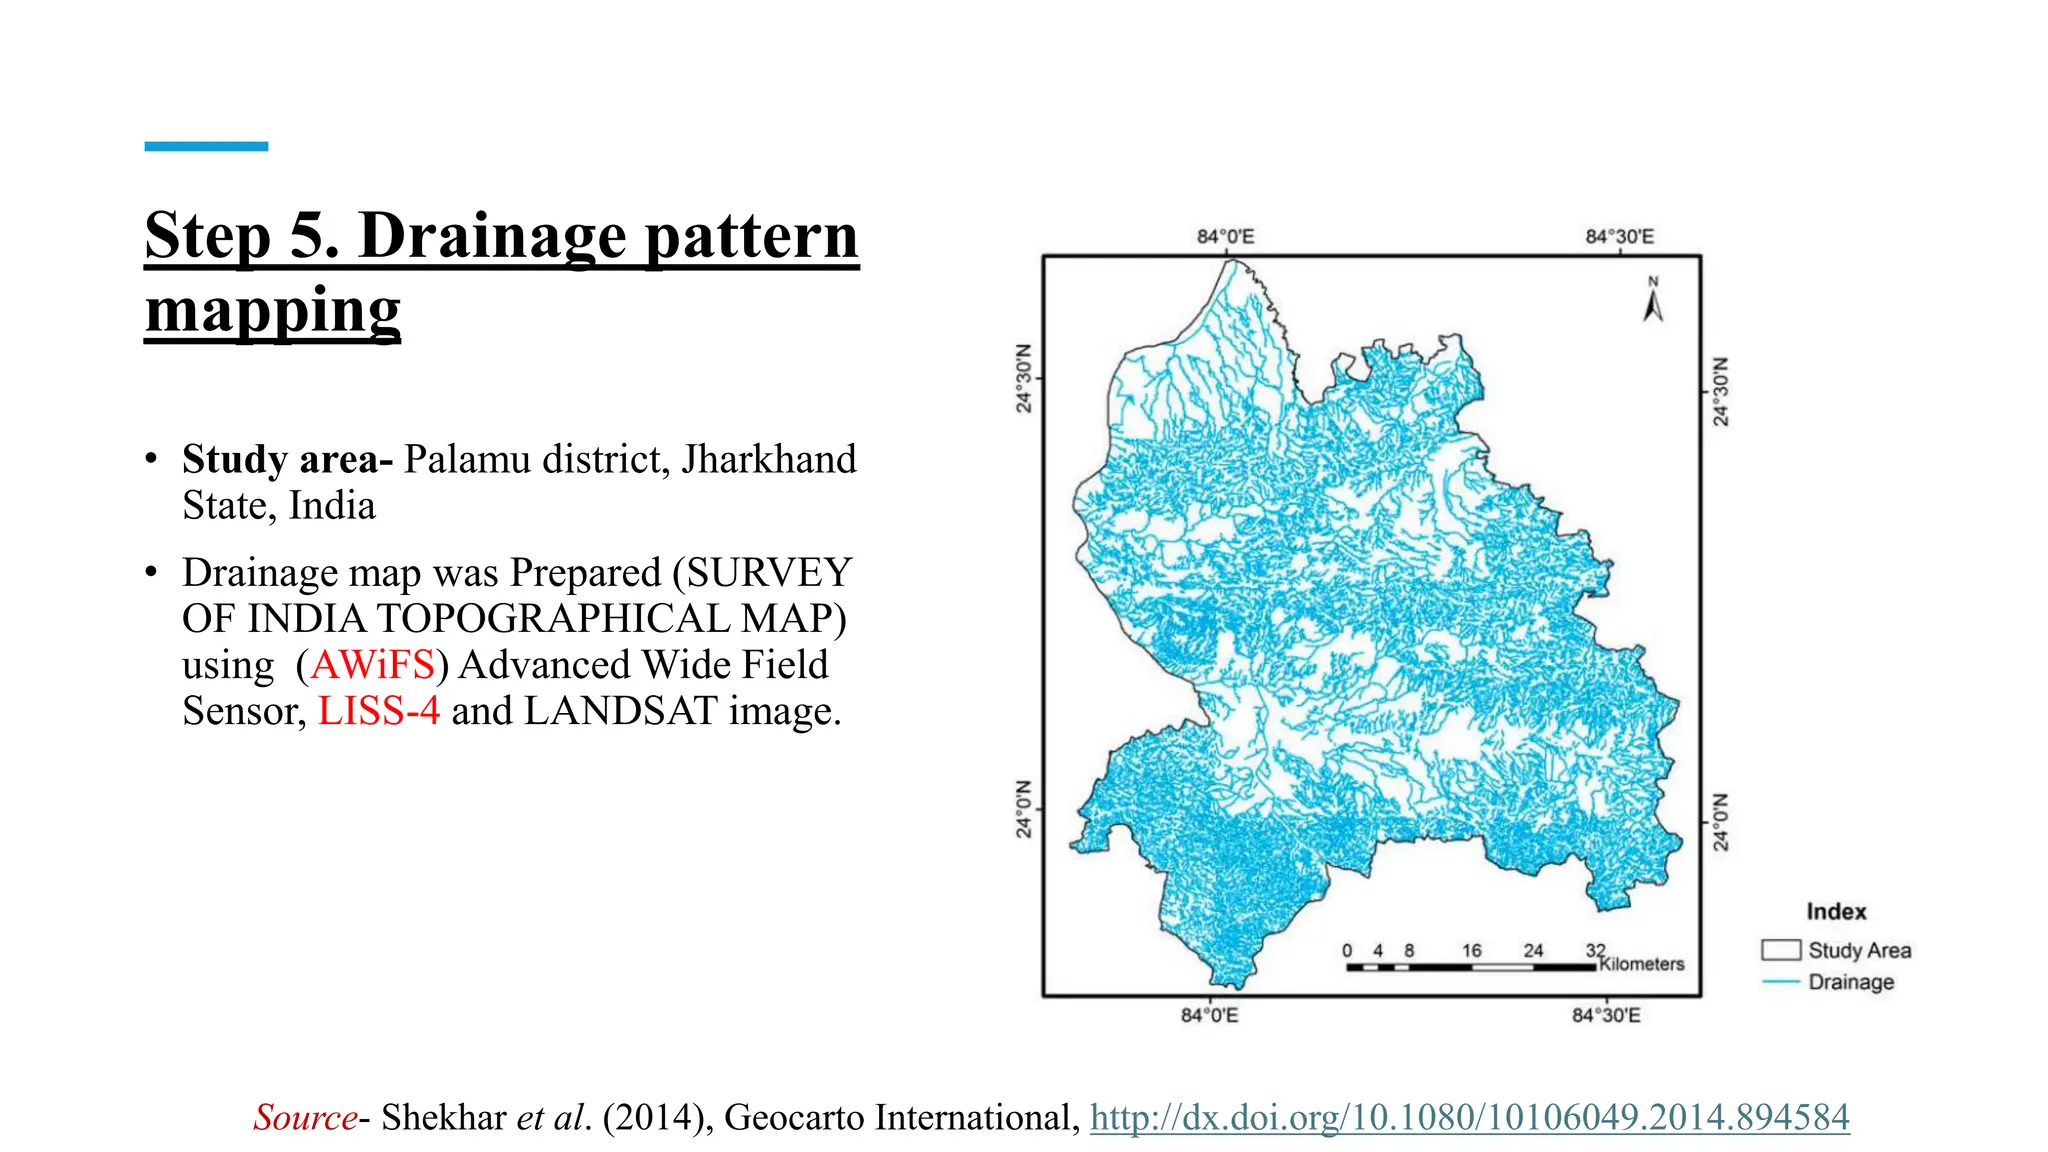
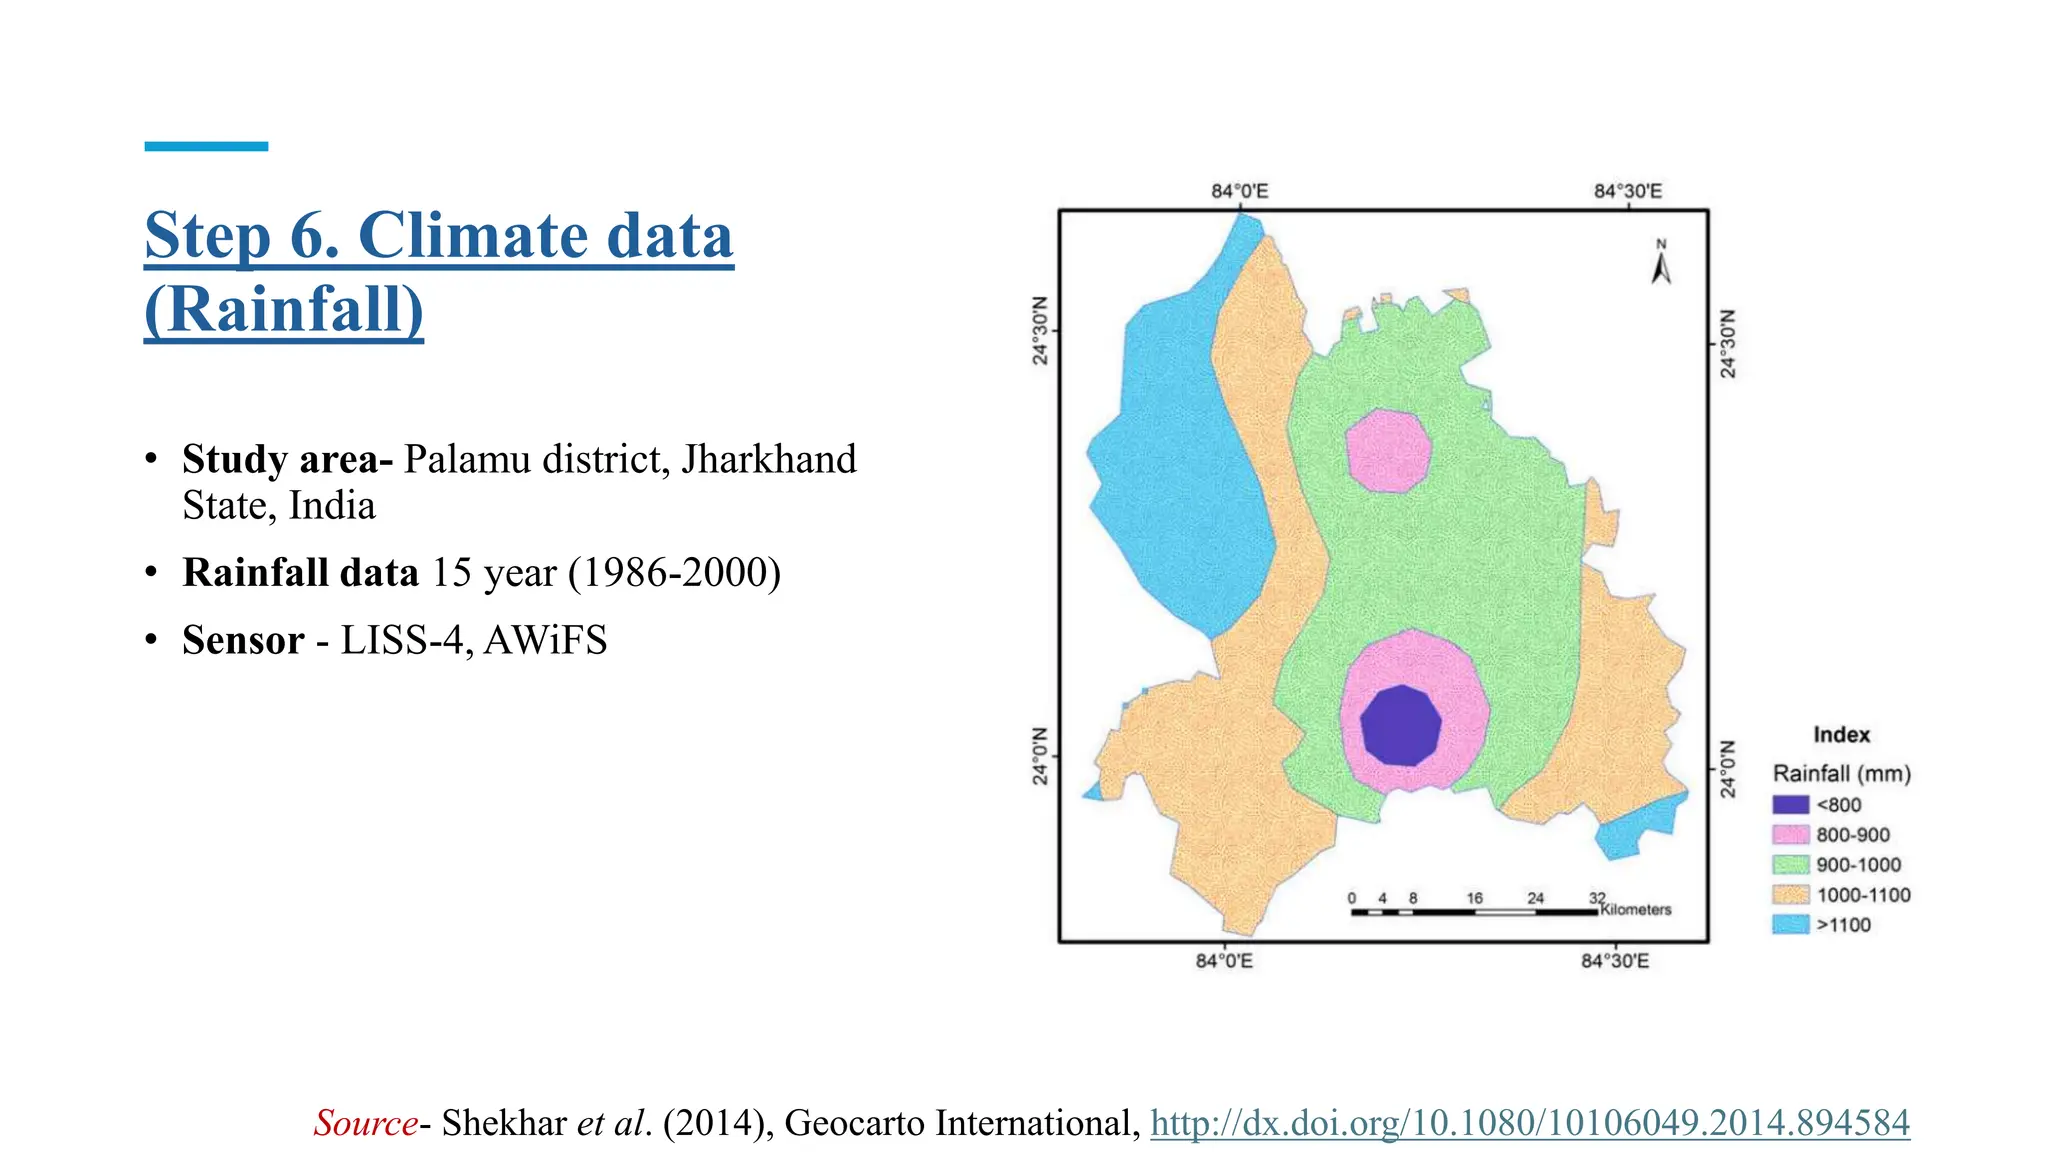
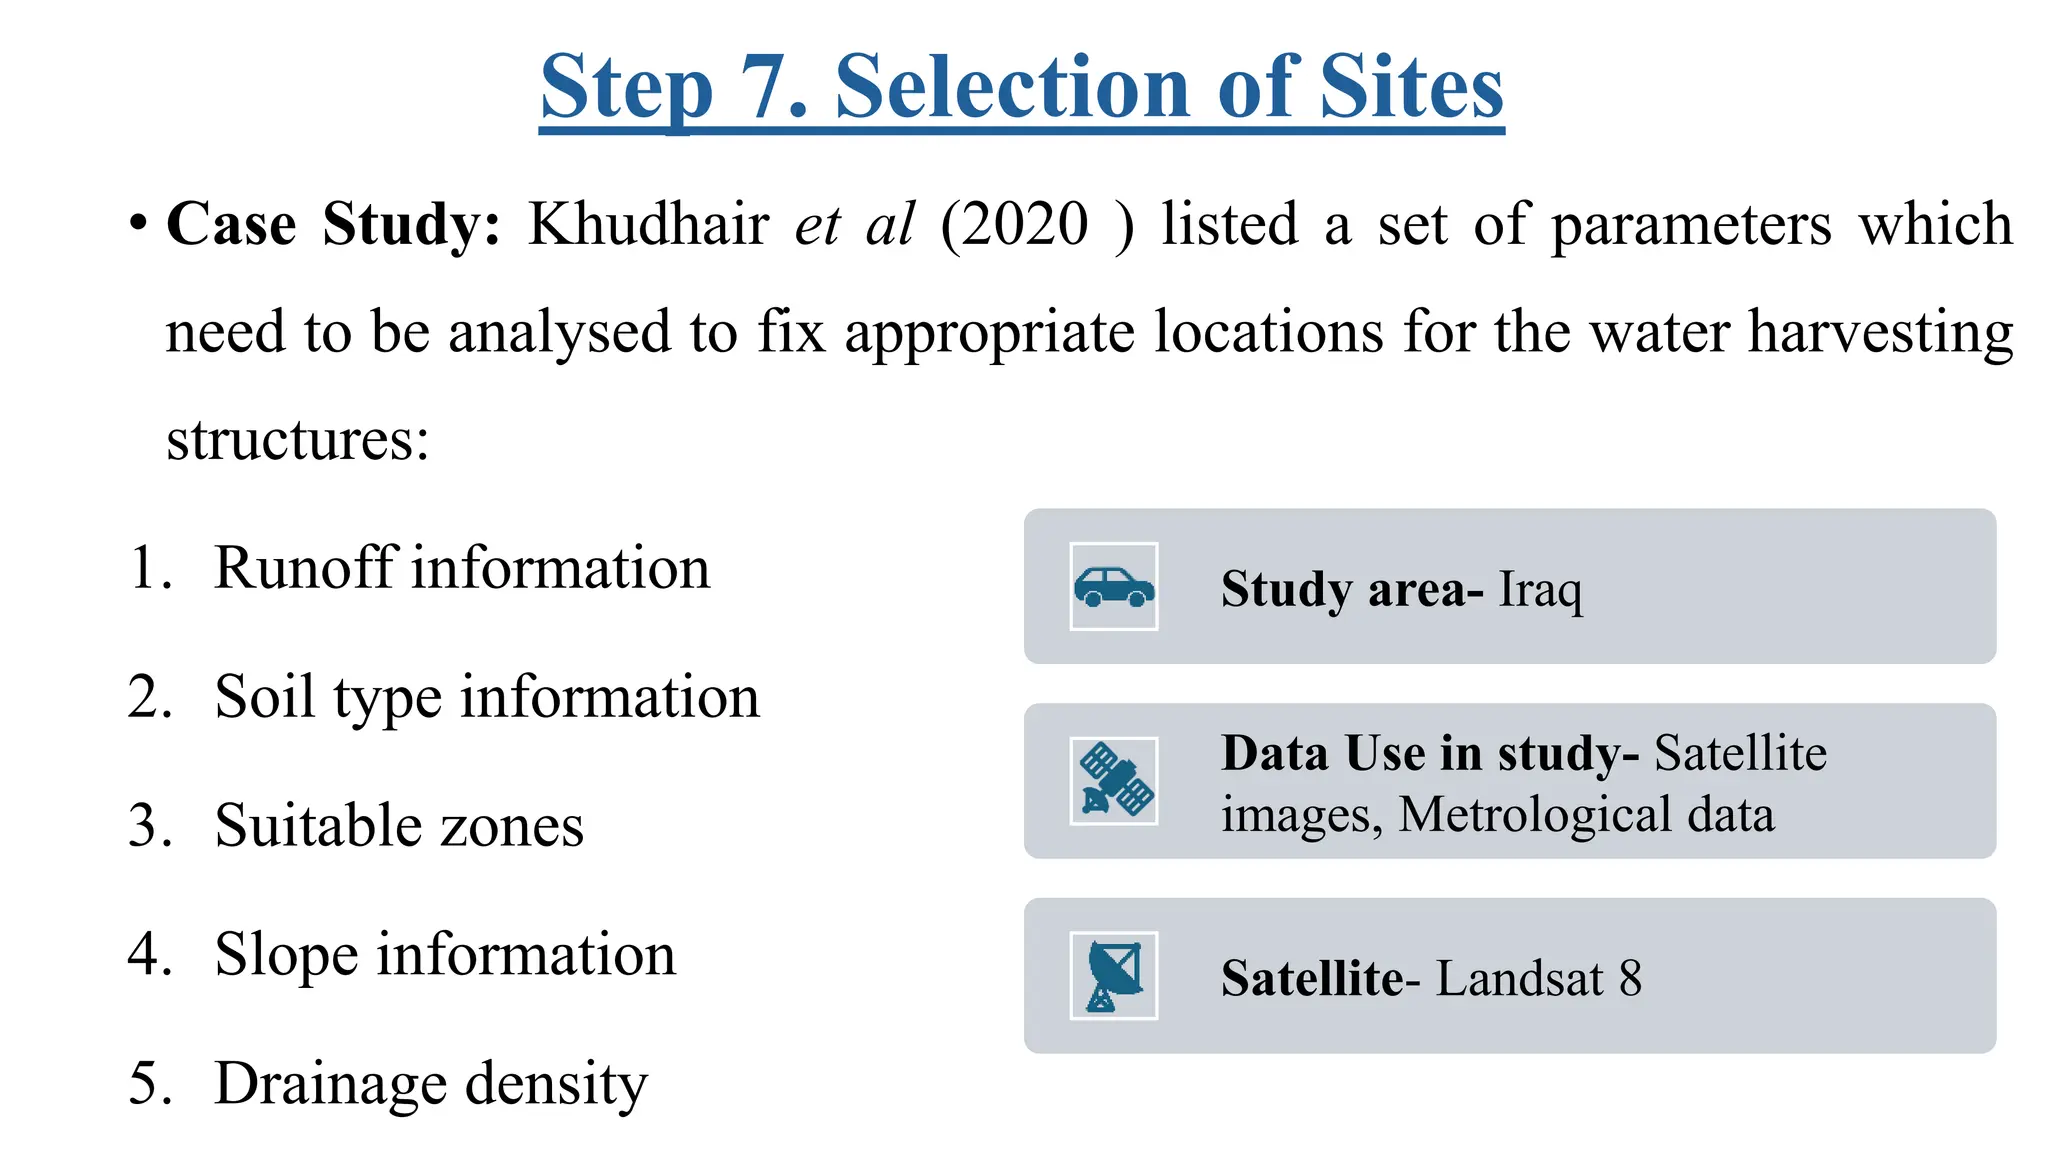
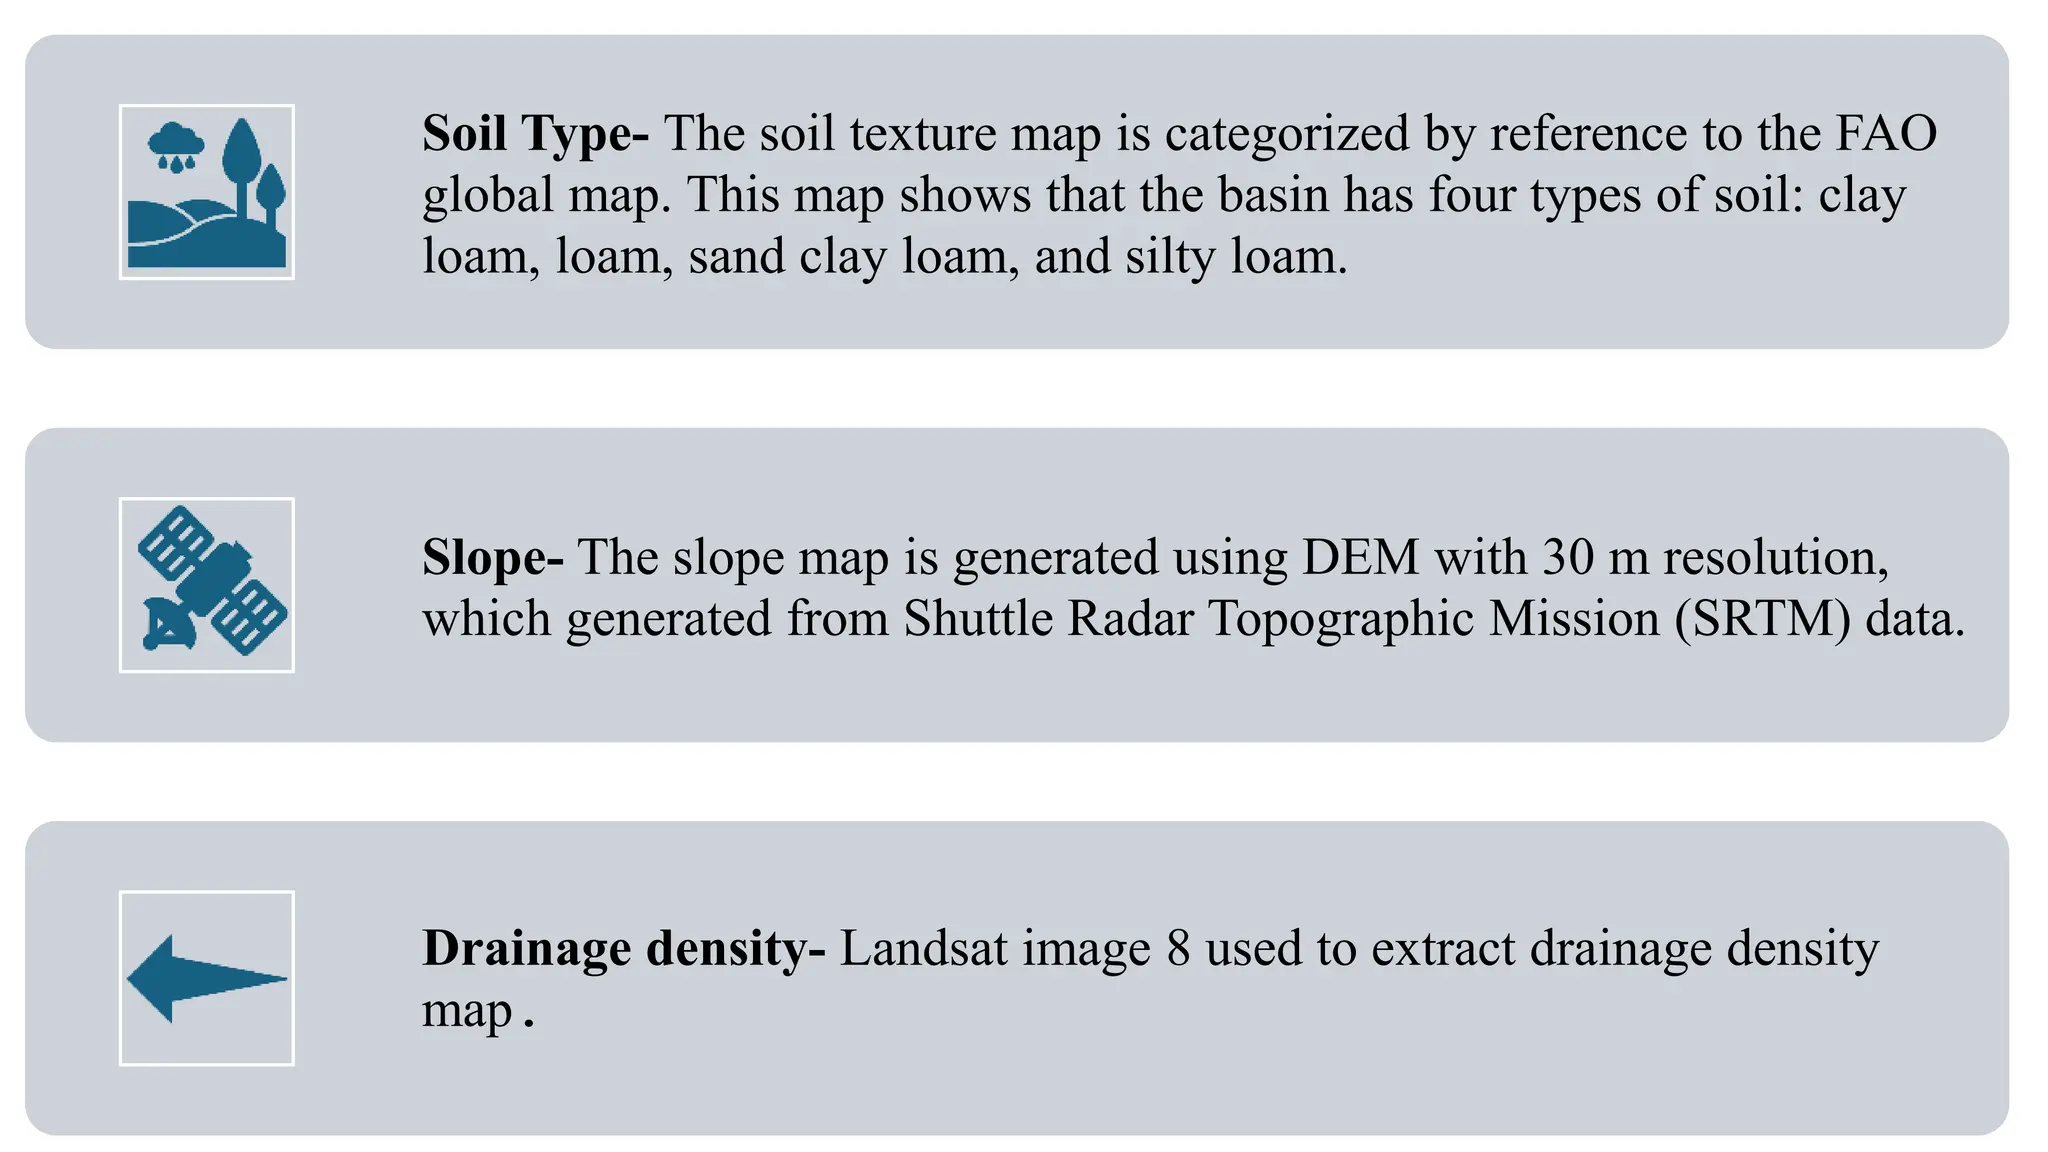
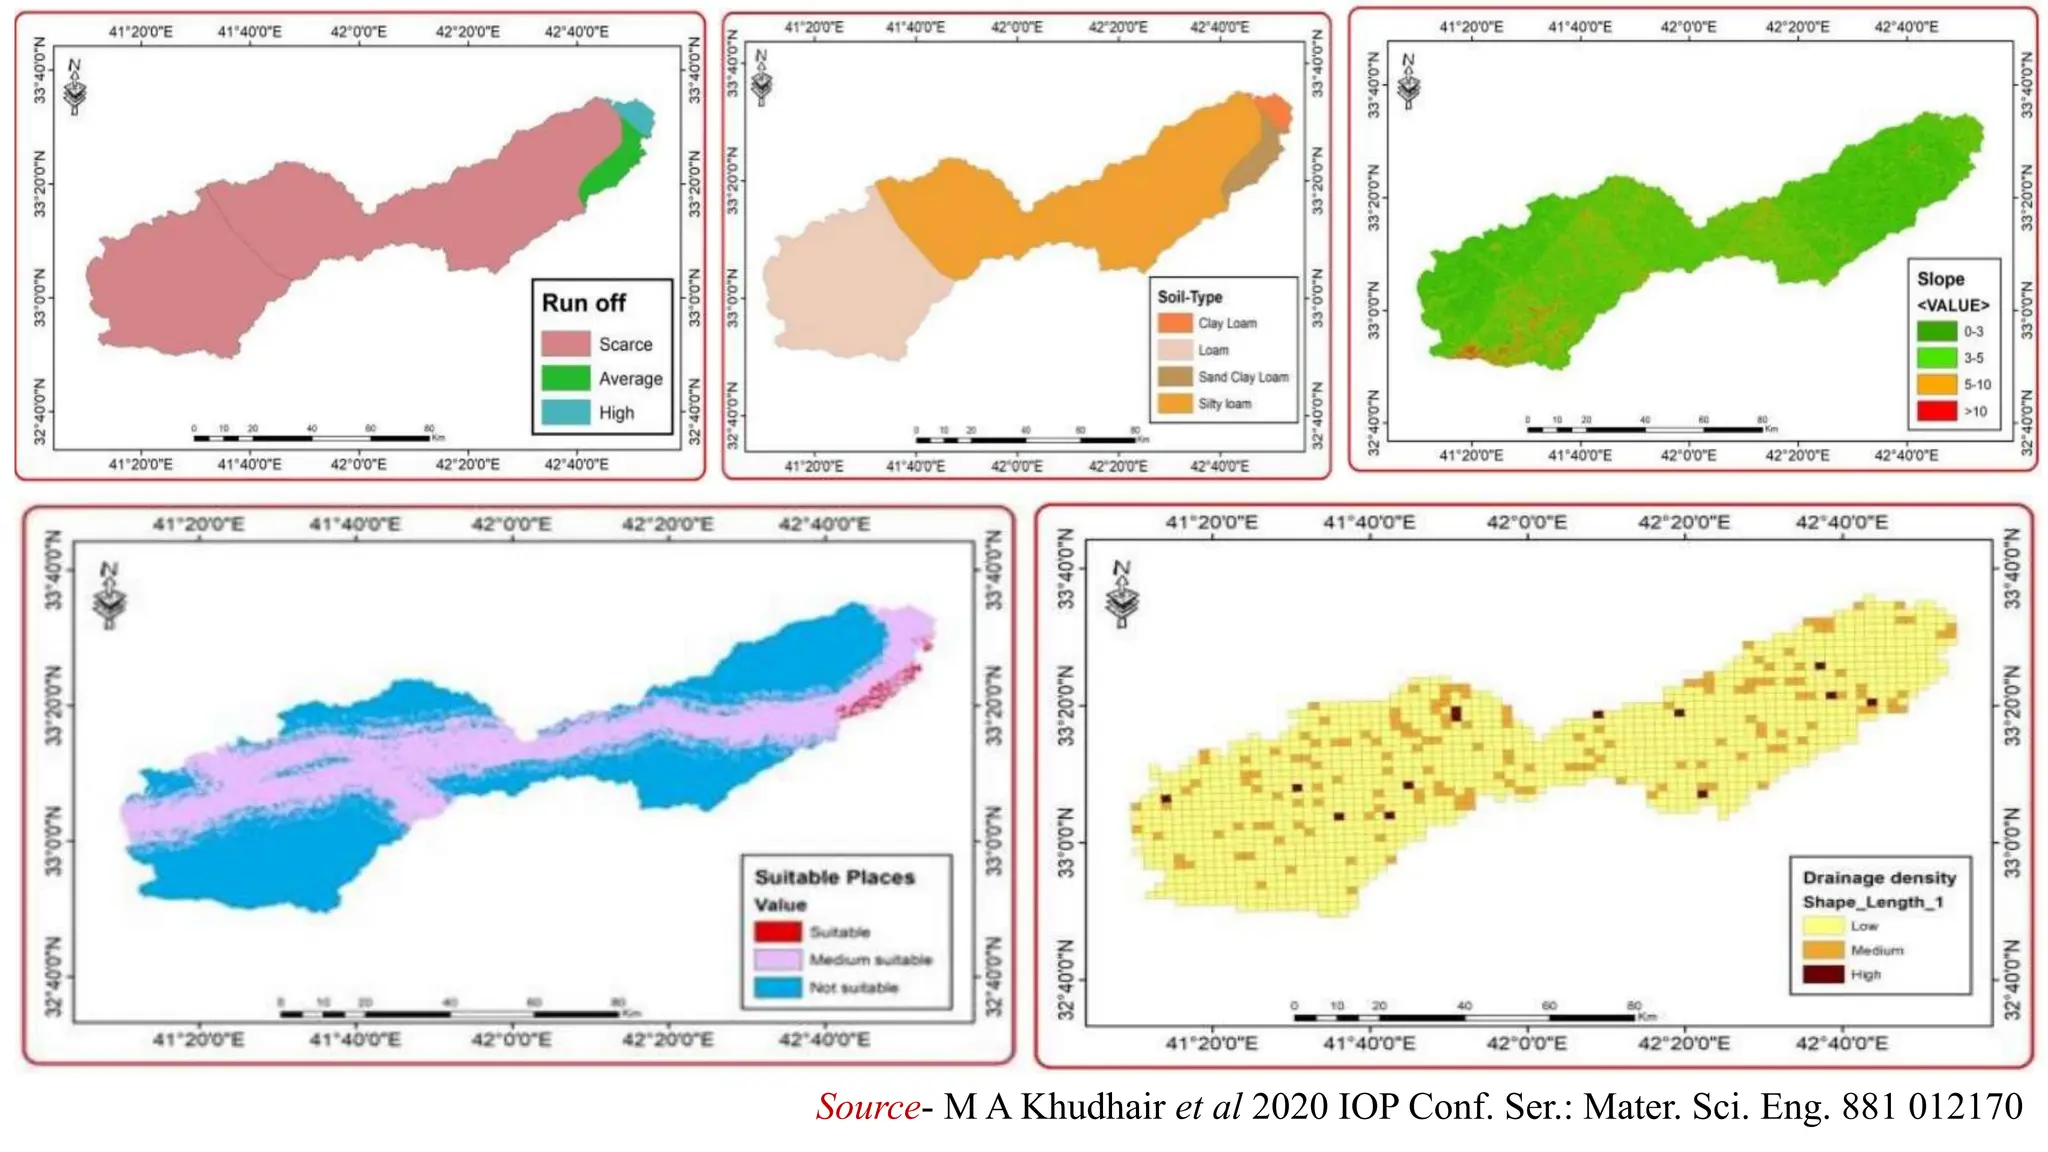
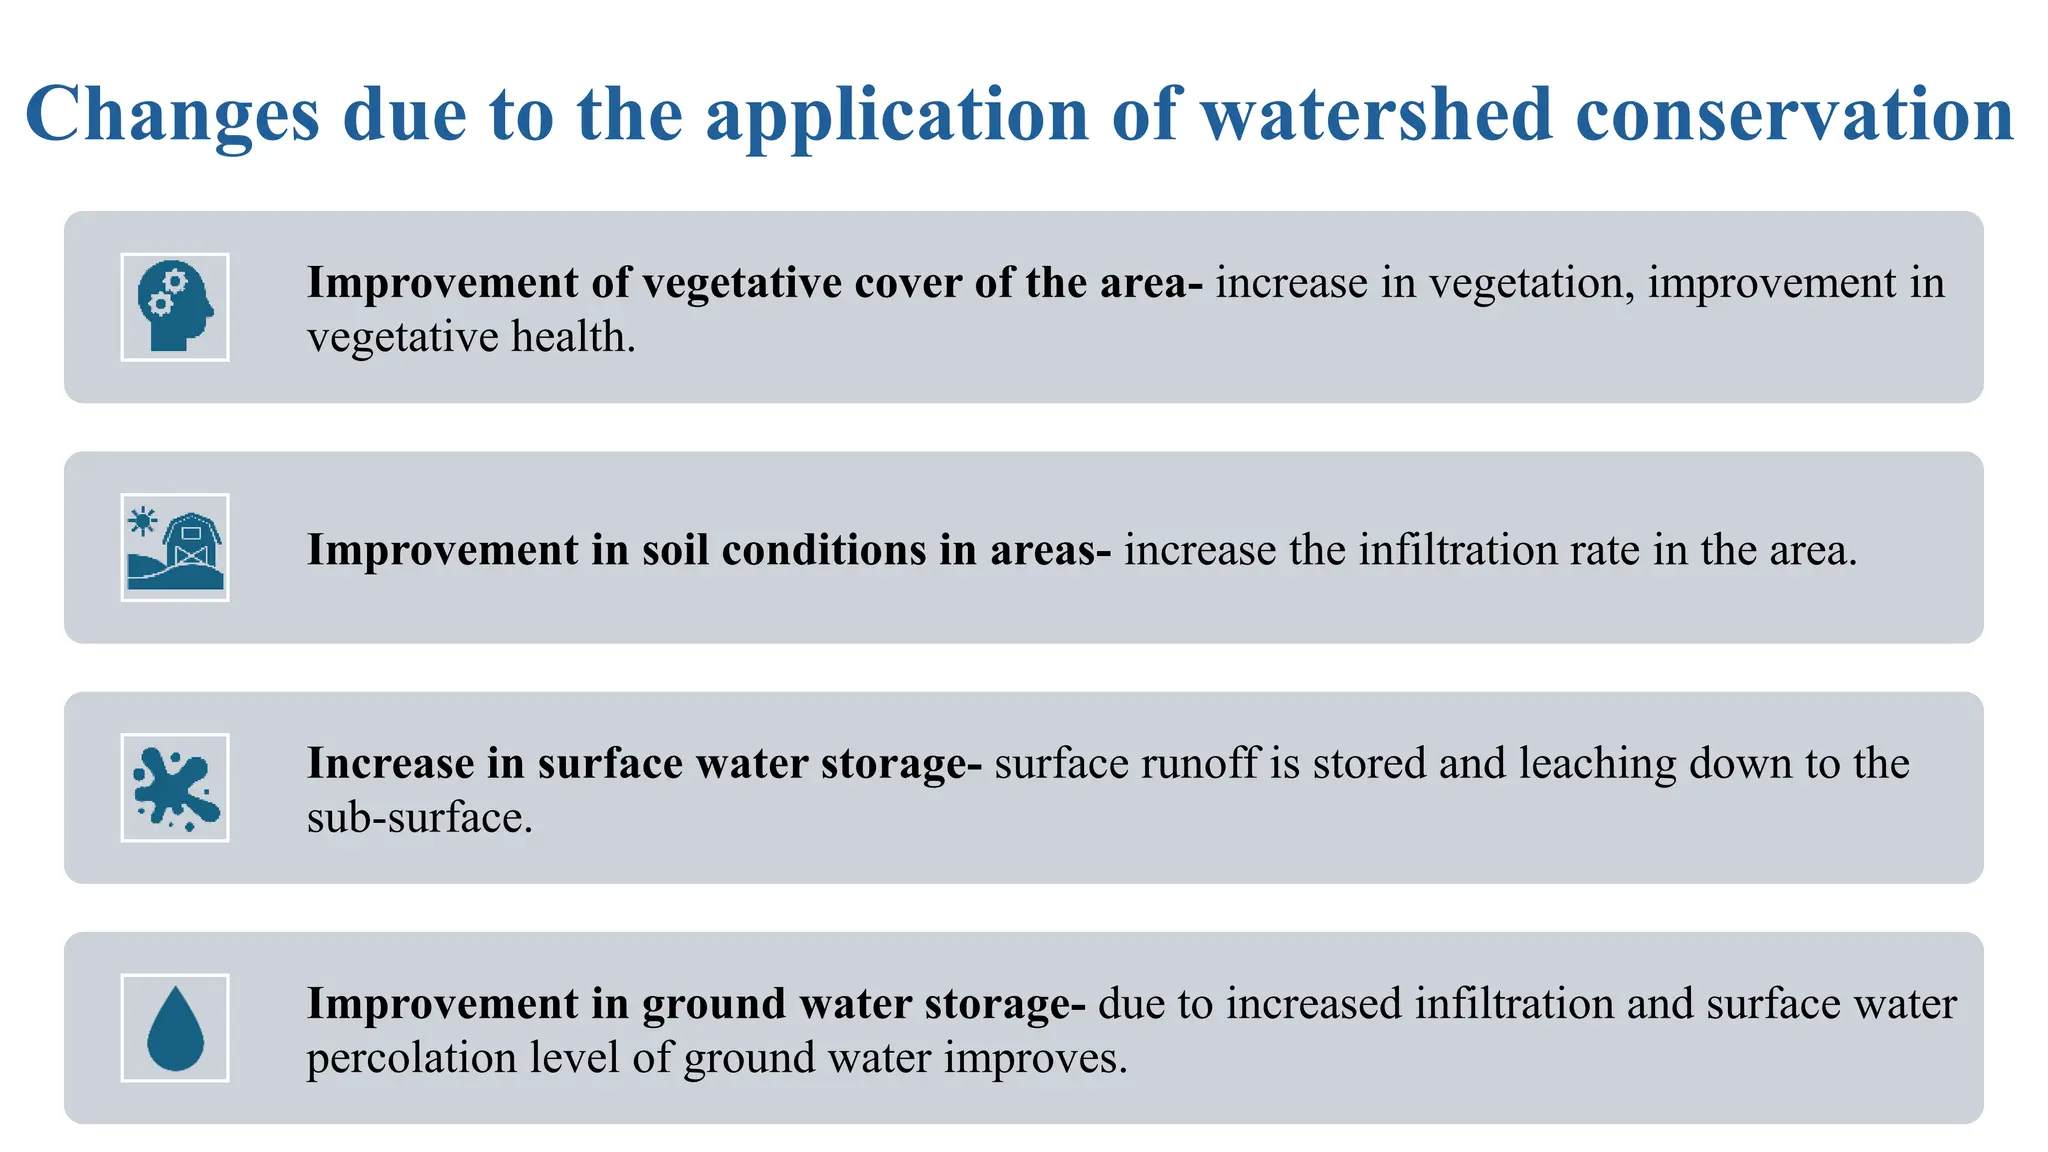
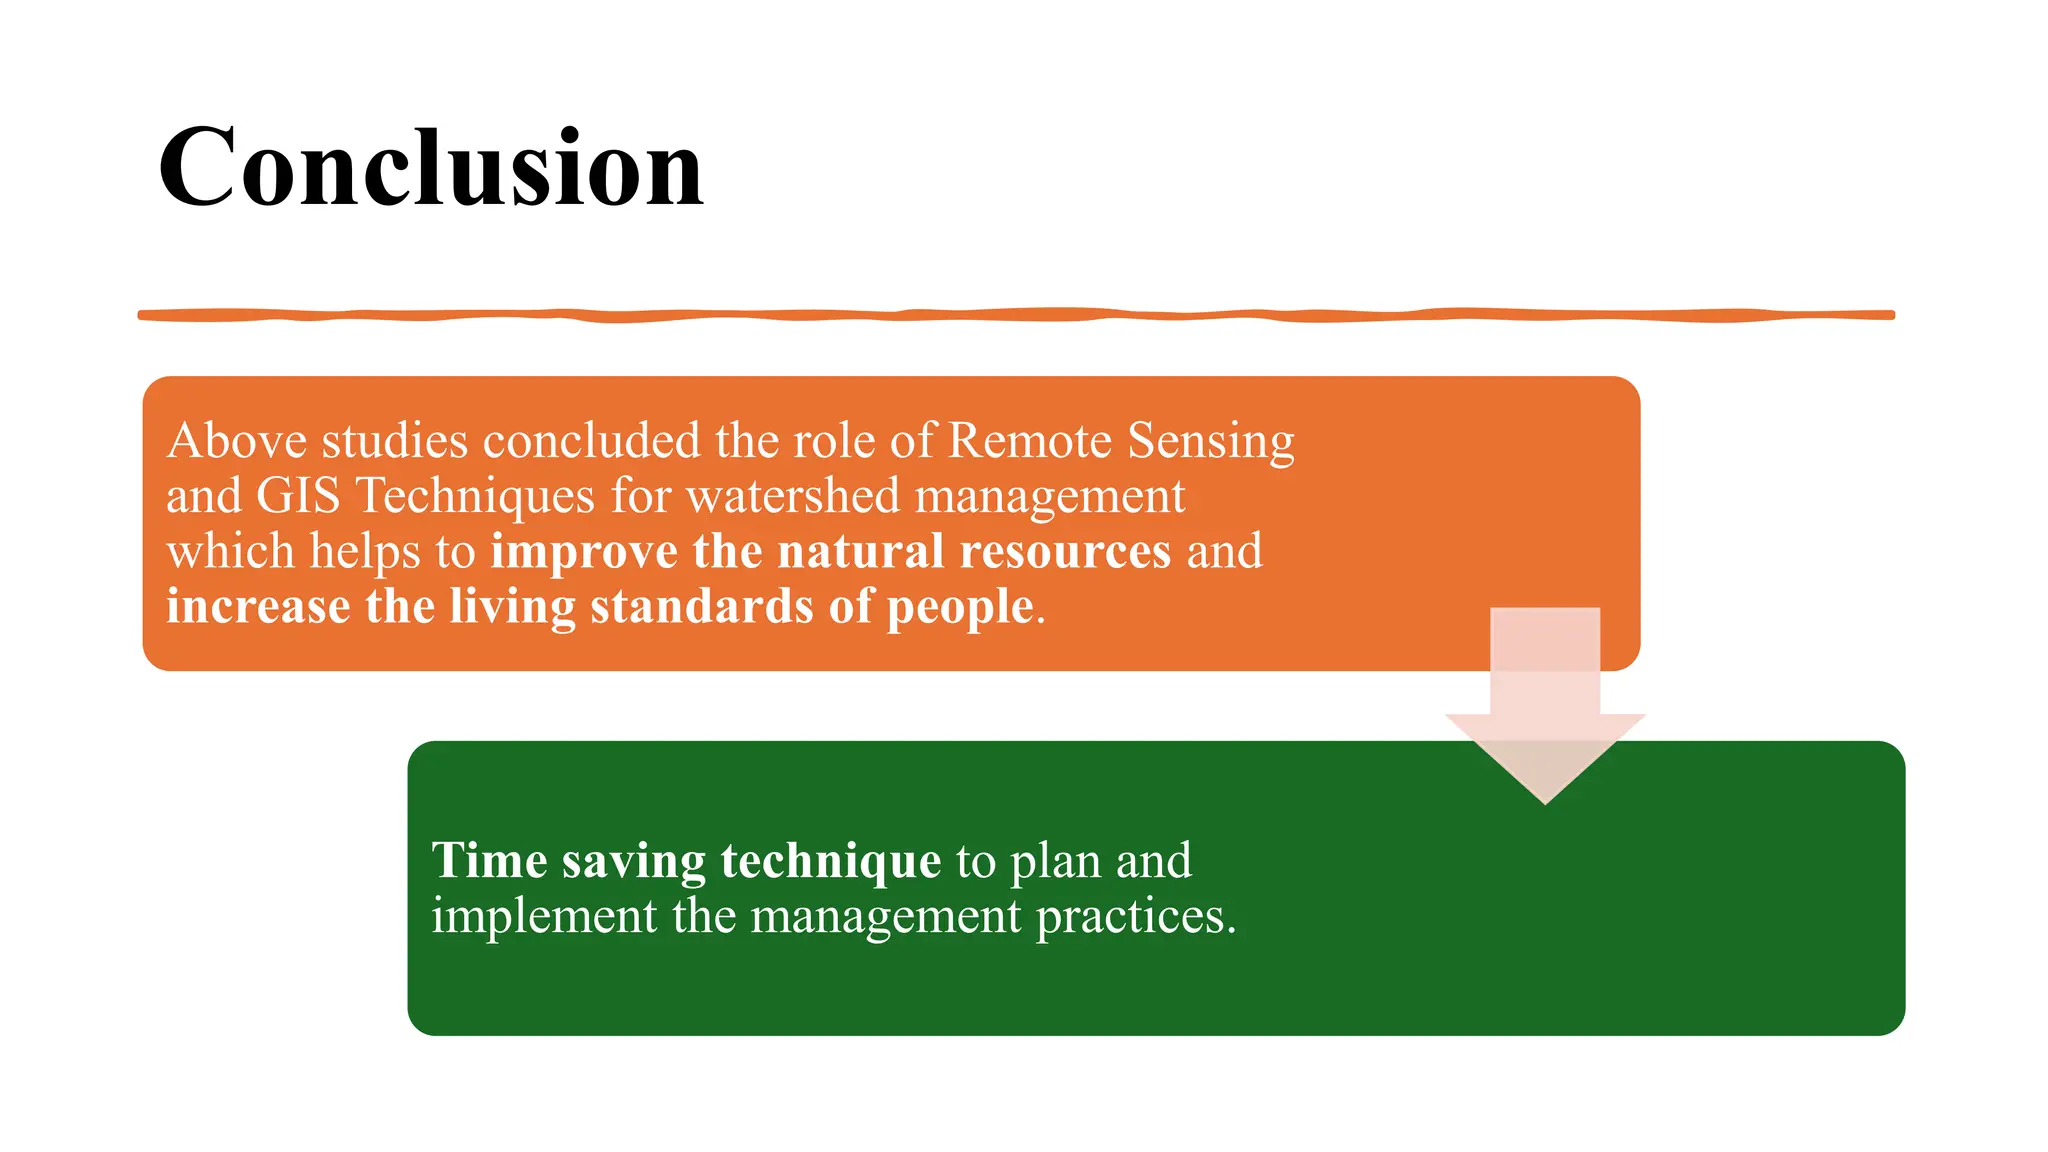
SOL- 512
Remote Sensing and GIS Techniques for Soil and Crop Studies
(Batch: 2023)
Submitted by:
Ajeet Jakhad
Ph.D. Scholar
Registration number: 12327430
Submitted to:
Dr. Princy Thakur
(Department of Soil Science, School of
Agriculture, LPU)
Application of Remote Sensing
&
GIS Techniques in Watershed Management
Watershed Watershed is defined as the
hydrological unit and an area that
generally drains the surface water
to a common outlet. These outlets
are in various forms such as
rivers, streams, wetlands etc.
A watershed is an area of land
that drains all the streams and
rainfall to a common outlet.
What is a Watershed ?
Source- https://snohomishcd.org/whats-a-watershed (IMAGE CREDIT. A. VICENTE, U.S. FOREST SERVICE.)
Classification of Watershed
Type Size (Hectare)
Mini watershed 1-100
Micro watershed 100-1000
Milli-watershed 1000-10,000
Sub-watershed 10,000-50,000
Macro watershed > 50,000
Source- https://agritech.tnau.ac.in/agriculture/agri_majorareas_watershed_watershedmgt.html
Problems in Watershed
Soil erosion by wind and water
Shifting cultivation
Water-logging
Land degradation
Over grazing of forest and grass lands
Increasing rate of degradation and depletion of resources
De-forestation
Natural disasters like Drought, Floods, Landslides etc.
(Source - Remote Sens. 2015, 7, 4048-4067; doi:10.3390/rs70404048)
(a)
(b)
Case study: Mbow et al conducted a study on Land degradation in Sahel, Africa by using Rapid Eye sensor and
matched satellite image with ground image.
(a) Water erosion with gullies
(b) Red colour – Loss of woody vegetation caused by poor management and climatic changes induces wind/water.
Bright yellow - Erosion of fertile topsoil.
Watershed Management and Role of
Remote Sensing & GIS Techniques in
Watershed Management
• Watershed management is a term used to describe the process of implementing
land use practices and water management practices to protect and improve the
quality of the water and other natural resources within a watershed by managing
the use of those land and water resources in a comprehensive manner.
• Watershed based management is the most effective way to enhance water
quality and natural resources, protect aquatic habitat, prevent soil erosion.
To control
damaging runoff
To manage and
utilize runoff for
useful purposes
To control erosion To enhance ground
water storage
Objectives of Watershed Management
Watershed management implies the proper use of all land and water
resources of a watershed for optimum production with minimum hazard
to natural resources with the objectives:
Role of Remote Sensing & GIS Techniques
• Due to synoptic coverage, entire watershed can be mapped for various geo-spatial databases
using remote sensing data and GIS.
• These database can be used to perform land use/land cover mapping and change detection,
runoff estimation, soil erosion study, site suitability analysis for rainwater harvesting etc.
using GIS techniques.
• Further, due to availability of high spatial resolution satellite data like IRS P6, IKONOS,
CARTOSAT can be used to accurately map land use/land cover classification & location of
soil and water conservation structures.
• Using DEM (Digital Elevation Model), slope, aspect, flow direction, flow accumulation and
flow length maps can be derived, which can be integrated into the other geo-spatial databases
to derive suitable sites for various watershed conservation measures.
Multispectral Satellites used for Management of Watershed
Remote sensing satellites Spatial resolution Spectral bands
Landsat 8 30 m 11
SPOT 5 20 m 5
ASTER 15-90 m 15
MODIS 250-1000 m 36
Quick Bird 3.2 m 4
IRS – P6
AWiFS
LISS-3
56 m
23.5 m
4
4
IRS-Resourcesat
LISS-4
5.8 m 3
Cartosat 1 & 2 2.0 m (PAN) 1 (PAN)
Source - IIRS Lecture, Geospatial Modelling for Watershed management
https://youtu.be/_r_3-2nD-Pk?si=t_FDTHxrHlhc07aJ
*PAN – Panchromatic data, ASTER- Advanced Spaceborne
Thermal Emission and Reflection radiometer
Choice of Satellite/Sensor on the bases of Watershed Level
Satellite/Sensor Spatial Resolution Category of Watershed
WiFS 180 m Sub-Watershed
LISS-2 36.5 m Mini-Watershed
LISS-3 23.5 m Mini-Watershed
IKONOS XS 4 m Micro-Watershed
Cartosat-1 2.5 m
Micro-Watershed
Cartosat-2 1 m
Micro-Watershed
Source - IIRS Lecture, Geospatial Modelling for Watershed management
https://youtu.be/_r_3-2nD-Pk?si=t_FDTHxrHlhc07aJ
*LISS- linear imaging self-scanning sensor
*WiFS-Wide-Field Sensor
Watershed Management
using Remote Sensing &
GIS Techniques
Remote Sensing techniques is applied for- (Step)
1. Delineation of watershed area
2. Watershed characterization
3. Soil erosion intensity mapping and identification
of erosion prone areas
4. Land use/Land cover mapping
5. Drainage pattern mapping
6. Climate
7. Selection of sites for the rainwater harvesting
Step 1. Delineation of Watershed Area
• Study area- Uttarakhand (Tehri-Garhwal), India
• Used data- IRS- P6, LISS-IV sensor, Ortho-
image and DEM of Cartosat-1 satellite
Watershed Delineation in hilly
region using satellite data
Source –Kumar, A., Bhardwaj, A., Kumar, P., & Padaliya, H. (2017). Delineation of Micro-Watershed using Geo-Spatial Techniques”.
Suresh Gyan Vihar University International Journal of Environment, Science and Technology, 3, 14-34.
→ Process of identifying the boundary of watershed – Delineation
Step 2. Watershed
Characterization
• Size
• Shape
• Slope
• Drainage
• Geology
• Soils
• Climate
• Land use
• Ground water
Step 3. Soil Erosion intensity mapping and
identification of erosion prone areas
• Remote sensing data utilized for the mapping of soil erosion by visual image
interpretation methods and erosion can be seen in the form of :
SLIGHT EROSION: Splash/ Very thin sheet
MODERATE EROSION: Sheet erosion
SEVERE EROSION: Rill erosion
VERY SEVERE EROSION: Gully erosion.
• Rill and Gully erosion can be seen on high resolution satellite data
Case Study: Study
has been done on
Soil loss map of
Himachal Pradesh
(Source: GS Sidhu and
RP Yadav -
Conservation
Agriculture, 2016-
Springer)
Step 4. Land use/Land cover mapping
• Study area – Arani and Koratalai river, Southern India
• Satellite- IRS-1D
• Sensor- LISS-3
• Year- April, 2006
(Preparation of land use or land cover map to know the various uses of the land in that particular area)
(Source: Suganthi et al Earth Sci. Res. J. vol.17 no.2 Bogotá July/Dec. 2013)
Step 5. Drainage pattern
mapping
• Study area- Palamu district, Jharkhand
State, India
• Drainage map was Prepared (SURVEY
OF INDIA TOPOGRAPHICAL MAP)
using (AWiFS) Advanced Wide Field
Sensor, LISS-4 and LANDSAT image.
Source- Shekhar et al. (2014), Geocarto International, http://dx.doi.org/10.1080/10106049.2014.894584
Step 6. Climate data
(Rainfall)
• Study area- Palamu district, Jharkhand
State, India
• Rainfall data 15 year (1986-2000)
• Sensor - LISS-4, AWiFS
Source- Shekhar et al. (2014), Geocarto International, http://dx.doi.org/10.1080/10106049.2014.894584
Step 7. Selection of Sites
• Case Study: Khudhair et al (2020 ) listed a set of parameters which
need to be analysed to fix appropriate locations for the water harvesting
structures:
1. Runoff information
2. Soil type information
3. Suitable zones
4. Slope information
5. Drainage density
Study area- Iraq
Data Use in study- Satellite
images, Metrological data
Satellite- Landsat 8
Soil Type- The soil texture map is categorized by reference to the FAO
global map. This map shows that the basin has four types of soil: clay
loam, loam, sand clay loam, and silty loam.
Slope- The slope map is generated using DEM with 30 m resolution,
which generated from Shuttle Radar Topographic Mission (SRTM) data.
Drainage density- Landsat image 8 used to extract drainage density
map.
Source- M A Khudhair et al 2020 IOP Conf. Ser.: Mater. Sci. Eng. 881 012170
Changes due to the application of watershed conservation
Improvement of vegetative cover of the area- increase in vegetation, improvement in
vegetative health.
Improvement in soil conditions in areas- increase the infiltration rate in the area.
Increase in surface water storage- surface runoff is stored and leaching down to the
sub-surface.
Improvement in ground water storage- due to increased infiltration and surface water
percolation level of ground water improves.
Conclusion
Above studies concluded the role of Remote Sensing
and GIS Techniques for watershed management
which helps to improve the natural resources and
increase the living standards of people.
Time saving technique to plan and
implement the management practices.
References
• https://snohomishcd.org/whats-a-watershed (IMAGE CREDIT. A. VICENTE, U.S. FOREST SERVICE.)
• https://agritech.tnau.ac.in/agriculture/agri_majorareas_watershed_watershedmgt.html
• Mbow, C., Brandt, M., Ouedraogo, I., De Leeuw, J., & Marshall, M. (2015). What four decades of earth observation
tell us about land degradation in the Sahel?. Remote Sensing, 7(4), 4048-4067.
• https://youtu.be/_r_3-2nD-Pk?si=t_FDTHxrHlhc07aJ
• Shekhar, S., & Pandey, A. C. (2015). Delineation of groundwater potential zone in hard rock terrain of India using
remote sensing, geographical information system (GIS) and analytic hierarchy process (AHP) techniques. Geocarto
International, 30(4), 402-421.
• Suganthi, S., Elango, L., & Subramanian, S. K. (2013). Groundwater potential zonation by Remote Sensing and GIS
techniques and its relation to the Groundwater level in the Coastal part of the Arani and Koratalai River Basin,
Southern India. Earth Sciences Research Journal, 17(2), 87-95.
• Khudhair, M. A., Sayl, K. N., & Darama, Y. (2020, July). Locating site selection for rainwater harvesting structure
using remote sensing and GIS. In IOP Conference series: Materials science and engineering (Vol. 881, No. 1, p.
012170). IOP Publishing.
Thank you 

Application of Remote Sensing & GIS Techniques in Watershed Management

  • 1.
    SOL- 512 Remote Sensingand GIS Techniques for Soil and Crop Studies (Batch: 2023) Submitted by: Ajeet Jakhad Ph.D. Scholar Registration number: 12327430 Submitted to: Dr. Princy Thakur (Department of Soil Science, School of Agriculture, LPU)
  • 2.
    Application of RemoteSensing & GIS Techniques in Watershed Management
  • 3.
    Watershed Watershed isdefined as the hydrological unit and an area that generally drains the surface water to a common outlet. These outlets are in various forms such as rivers, streams, wetlands etc. A watershed is an area of land that drains all the streams and rainfall to a common outlet.
  • 4.
    What is aWatershed ? Source- https://snohomishcd.org/whats-a-watershed (IMAGE CREDIT. A. VICENTE, U.S. FOREST SERVICE.)
  • 5.
    Classification of Watershed TypeSize (Hectare) Mini watershed 1-100 Micro watershed 100-1000 Milli-watershed 1000-10,000 Sub-watershed 10,000-50,000 Macro watershed > 50,000 Source- https://agritech.tnau.ac.in/agriculture/agri_majorareas_watershed_watershedmgt.html
  • 6.
    Problems in Watershed Soilerosion by wind and water Shifting cultivation Water-logging Land degradation Over grazing of forest and grass lands Increasing rate of degradation and depletion of resources De-forestation Natural disasters like Drought, Floods, Landslides etc.
  • 7.
    (Source - RemoteSens. 2015, 7, 4048-4067; doi:10.3390/rs70404048) (a) (b) Case study: Mbow et al conducted a study on Land degradation in Sahel, Africa by using Rapid Eye sensor and matched satellite image with ground image. (a) Water erosion with gullies (b) Red colour – Loss of woody vegetation caused by poor management and climatic changes induces wind/water. Bright yellow - Erosion of fertile topsoil.
  • 8.
    Watershed Management andRole of Remote Sensing & GIS Techniques in Watershed Management
  • 9.
    Watershed Management • Watershedmanagement is a term used to describe the process of implementing land use practices and water management practices to protect and improve the quality of the water and other natural resources within a watershed by managing the use of those land and water resources in a comprehensive manner. • Watershed based management is the most effective way to enhance water quality and natural resources, protect aquatic habitat, prevent soil erosion.
  • 10.
    To control damaging runoff Tomanage and utilize runoff for useful purposes To control erosion To enhance ground water storage Objectives of Watershed Management Watershed management implies the proper use of all land and water resources of a watershed for optimum production with minimum hazard to natural resources with the objectives:
  • 11.
    Role of RemoteSensing & GIS Techniques • Due to synoptic coverage, entire watershed can be mapped for various geo-spatial databases using remote sensing data and GIS. • These database can be used to perform land use/land cover mapping and change detection, runoff estimation, soil erosion study, site suitability analysis for rainwater harvesting etc. using GIS techniques. • Further, due to availability of high spatial resolution satellite data like IRS P6, IKONOS, CARTOSAT can be used to accurately map land use/land cover classification & location of soil and water conservation structures. • Using DEM (Digital Elevation Model), slope, aspect, flow direction, flow accumulation and flow length maps can be derived, which can be integrated into the other geo-spatial databases to derive suitable sites for various watershed conservation measures.
  • 12.
    Multispectral Satellites usedfor Management of Watershed Remote sensing satellites Spatial resolution Spectral bands Landsat 8 30 m 11 SPOT 5 20 m 5 ASTER 15-90 m 15 MODIS 250-1000 m 36 Quick Bird 3.2 m 4 IRS – P6 AWiFS LISS-3 56 m 23.5 m 4 4 IRS-Resourcesat LISS-4 5.8 m 3 Cartosat 1 & 2 2.0 m (PAN) 1 (PAN) Source - IIRS Lecture, Geospatial Modelling for Watershed management https://youtu.be/_r_3-2nD-Pk?si=t_FDTHxrHlhc07aJ *PAN – Panchromatic data, ASTER- Advanced Spaceborne Thermal Emission and Reflection radiometer
  • 13.
    Choice of Satellite/Sensoron the bases of Watershed Level Satellite/Sensor Spatial Resolution Category of Watershed WiFS 180 m Sub-Watershed LISS-2 36.5 m Mini-Watershed LISS-3 23.5 m Mini-Watershed IKONOS XS 4 m Micro-Watershed Cartosat-1 2.5 m Micro-Watershed Cartosat-2 1 m Micro-Watershed Source - IIRS Lecture, Geospatial Modelling for Watershed management https://youtu.be/_r_3-2nD-Pk?si=t_FDTHxrHlhc07aJ *LISS- linear imaging self-scanning sensor *WiFS-Wide-Field Sensor
  • 14.
    Watershed Management using RemoteSensing & GIS Techniques Remote Sensing techniques is applied for- (Step) 1. Delineation of watershed area 2. Watershed characterization 3. Soil erosion intensity mapping and identification of erosion prone areas 4. Land use/Land cover mapping 5. Drainage pattern mapping 6. Climate 7. Selection of sites for the rainwater harvesting
  • 15.
    Step 1. Delineationof Watershed Area • Study area- Uttarakhand (Tehri-Garhwal), India • Used data- IRS- P6, LISS-IV sensor, Ortho- image and DEM of Cartosat-1 satellite Watershed Delineation in hilly region using satellite data Source –Kumar, A., Bhardwaj, A., Kumar, P., & Padaliya, H. (2017). Delineation of Micro-Watershed using Geo-Spatial Techniques”. Suresh Gyan Vihar University International Journal of Environment, Science and Technology, 3, 14-34. → Process of identifying the boundary of watershed – Delineation
  • 16.
    Step 2. Watershed Characterization •Size • Shape • Slope • Drainage • Geology • Soils • Climate • Land use • Ground water
  • 17.
    Step 3. SoilErosion intensity mapping and identification of erosion prone areas • Remote sensing data utilized for the mapping of soil erosion by visual image interpretation methods and erosion can be seen in the form of : SLIGHT EROSION: Splash/ Very thin sheet MODERATE EROSION: Sheet erosion SEVERE EROSION: Rill erosion VERY SEVERE EROSION: Gully erosion. • Rill and Gully erosion can be seen on high resolution satellite data
  • 18.
    Case Study: Study hasbeen done on Soil loss map of Himachal Pradesh (Source: GS Sidhu and RP Yadav - Conservation Agriculture, 2016- Springer)
  • 19.
    Step 4. Landuse/Land cover mapping • Study area – Arani and Koratalai river, Southern India • Satellite- IRS-1D • Sensor- LISS-3 • Year- April, 2006 (Preparation of land use or land cover map to know the various uses of the land in that particular area) (Source: Suganthi et al Earth Sci. Res. J. vol.17 no.2 Bogotá July/Dec. 2013)
  • 20.
    Step 5. Drainagepattern mapping • Study area- Palamu district, Jharkhand State, India • Drainage map was Prepared (SURVEY OF INDIA TOPOGRAPHICAL MAP) using (AWiFS) Advanced Wide Field Sensor, LISS-4 and LANDSAT image. Source- Shekhar et al. (2014), Geocarto International, http://dx.doi.org/10.1080/10106049.2014.894584
  • 21.
    Step 6. Climatedata (Rainfall) • Study area- Palamu district, Jharkhand State, India • Rainfall data 15 year (1986-2000) • Sensor - LISS-4, AWiFS Source- Shekhar et al. (2014), Geocarto International, http://dx.doi.org/10.1080/10106049.2014.894584
  • 22.
    Step 7. Selectionof Sites • Case Study: Khudhair et al (2020 ) listed a set of parameters which need to be analysed to fix appropriate locations for the water harvesting structures: 1. Runoff information 2. Soil type information 3. Suitable zones 4. Slope information 5. Drainage density Study area- Iraq Data Use in study- Satellite images, Metrological data Satellite- Landsat 8
  • 23.
    Soil Type- Thesoil texture map is categorized by reference to the FAO global map. This map shows that the basin has four types of soil: clay loam, loam, sand clay loam, and silty loam. Slope- The slope map is generated using DEM with 30 m resolution, which generated from Shuttle Radar Topographic Mission (SRTM) data. Drainage density- Landsat image 8 used to extract drainage density map.
  • 24.
    Source- M AKhudhair et al 2020 IOP Conf. Ser.: Mater. Sci. Eng. 881 012170
  • 25.
    Changes due tothe application of watershed conservation Improvement of vegetative cover of the area- increase in vegetation, improvement in vegetative health. Improvement in soil conditions in areas- increase the infiltration rate in the area. Increase in surface water storage- surface runoff is stored and leaching down to the sub-surface. Improvement in ground water storage- due to increased infiltration and surface water percolation level of ground water improves.
  • 26.
    Conclusion Above studies concludedthe role of Remote Sensing and GIS Techniques for watershed management which helps to improve the natural resources and increase the living standards of people. Time saving technique to plan and implement the management practices.
  • 27.
    References • https://snohomishcd.org/whats-a-watershed (IMAGECREDIT. A. VICENTE, U.S. FOREST SERVICE.) • https://agritech.tnau.ac.in/agriculture/agri_majorareas_watershed_watershedmgt.html • Mbow, C., Brandt, M., Ouedraogo, I., De Leeuw, J., & Marshall, M. (2015). What four decades of earth observation tell us about land degradation in the Sahel?. Remote Sensing, 7(4), 4048-4067. • https://youtu.be/_r_3-2nD-Pk?si=t_FDTHxrHlhc07aJ • Shekhar, S., & Pandey, A. C. (2015). Delineation of groundwater potential zone in hard rock terrain of India using remote sensing, geographical information system (GIS) and analytic hierarchy process (AHP) techniques. Geocarto International, 30(4), 402-421. • Suganthi, S., Elango, L., & Subramanian, S. K. (2013). Groundwater potential zonation by Remote Sensing and GIS techniques and its relation to the Groundwater level in the Coastal part of the Arani and Koratalai River Basin, Southern India. Earth Sciences Research Journal, 17(2), 87-95. • Khudhair, M. A., Sayl, K. N., & Darama, Y. (2020, July). Locating site selection for rainwater harvesting structure using remote sensing and GIS. In IOP Conference series: Materials science and engineering (Vol. 881, No. 1, p. 012170). IOP Publishing.
  • 28.