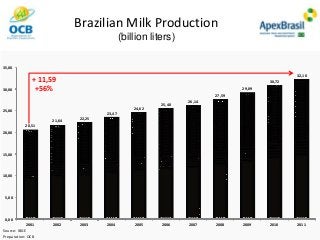
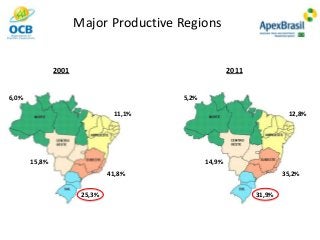
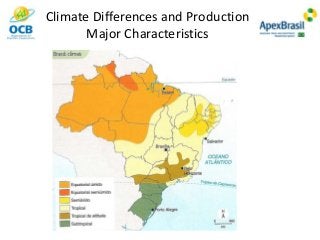
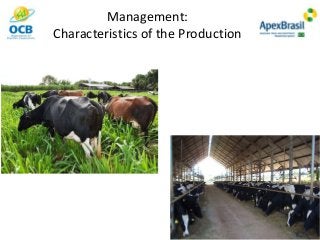
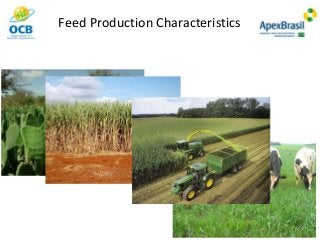
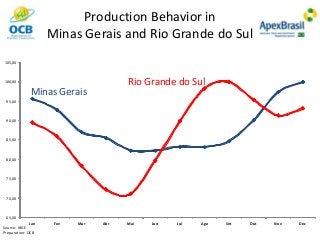
Brazilian Dairy Market:
Major Productive Regions, Main Characteristics
and Business Opportunities
Bernhard J. Smid
bernhardsmid@yahoo.de
projetoocbapex@ocb.coop.br
Agenda
Brazil in the World
Brazilian Potential
Major Productive Regions
Characteristics of the Brazilian Production
Opportunities
Global Milk Production:
727 billion litters (2011)
COW
84%
Goat
2%
Sheep
1%
Bubaline
13%
Source: FAO
Elaboration: OCB
Latin American and Asian Market
Share in the Global Milk Production
Source: FAO
Elaboration: OCB
1992 2011
LATIN
AMERICA
9.8 Africa
3.7
Oceania
3.3
Europe
51.2
North
America
16.5
Asia
16
LATIN
AMERICA
13.4
Africa
4.5
Oceania
4.5
Europe
34.6
North
America
16.5
Asia
27.0
Source: Faostat
2001 2011 Variation
Argentina 9.769 10.502 8%
Brazil 21.146 32.091 52%
Chile 2.190 2.620 20%
Paraguay 331 396 20%
Uruguay 1.506 2.057 37%
Total South Cone 34.941 47.666 36%
(million liters)
Milk Production in the South Cone
67% of
South Cone
89.015
52.500
36.929
32.091
31.386
30.301
24.427
17.894
14.246
13.802
12.906
12.414
11.627
10.804
10.724
10.502
10.479
9.101
8.400
7.500
-
10.000
20.000
30.000
40.000
50.000
60.000
70.000
80.000
90.000
100.000
Produçãode Leite nos PrincipaisPaíses
(milhõesde litros)
World’s 4th largest
producer
Source: FAO
Preparation: OCB
(million liters)
Global Milk Production
Agenda
Brazil in the World
Brazilian Potential
Major Productive Regions
Characteristics of the Brazilian Production
Opportunities
LATIN AMERICA
Source: FAO
Elaboration: Glauco Carvalho/Embrapa Gado de Leite
Land Availability
(million hectares)
Non used pastures and areas Agriculture
Africa Latin America Asia North America Europe Oceania
Potential Arable Land
(2009)
World potential land use capabilities
Source: http://www.fao.org/docrep/u8480e/u8480e0e.htm
Water Availability and Consumption
Availability
Consumption
CO2 Emissions
Agenda
Brazil in the World
Brazilian Potential
Major Productive Regions
Characteristics of the Brazilian Production
Opportunities
20,51
21,64
22,25
23,47
24,62
25,40
26,14
27,59
29,09
30,72
32,10
0,00
5,00
10,00
15,00
20,00
25,00
30,00
35,00
2001 2002 2003 2004 2005 2006 2007 2008 2009 2010 2011
Source: IBGE
Preparation: OCB
+ 11,59
+56%
Brazilian Milk Production
(billion liters)
2001 2011
6,0%
15,8%
25,3%
41,8%
11,1%
5,2%
14,9%
31,9%
35,2%
12,8%
Major Productive Regions
Agenda
Brazil in the World
Brazilian Potential
Major Productive Regions
Characteristics of the Brazilian Production
Opportunities
Climate Differences and Production
Major Characteristics
Management:
Characteristics of the Production
Feed Production Characteristics
65,00
70,00
75,00
80,00
85,00
90,00
95,00
100,00
105,00
Jan Fev Mar Abr Mai Jun Jul Ago Set Out Nov Dez
Rio Grande do Sul
Source: IBGE
Preparation: OCB
Production Behavior in
Minas Gerais and Rio Grande do Sul
Minas Gerais
Agenda
Brazil in the World
Brazilian Potential
Major Productive Regions
Characteristics of the Brazilian Production
Opportunities
The Brazilian Dairy Market.  Major Productive Regions, Main Characteristics and Business Opportunities.

The Brazilian Dairy Market. Major Productive Regions, Main Characteristics and Business Opportunities.