1. Flood Characteristics of th Haor A
Fl d Ch t i ti f the Ha Area i B gl d h and the P t ti l I
in Bangladesh d th Potential Impact of
t f
Climate Change
Cli Ch g
A. Su a a d B.
A Suman1 and B Bhattacharya2
attac a ya
suman_fs@y
suman fs@y
yahoo.com
yahoo com and B Bhattacharya@unesco ihe org
B.Bhattacharya@unesco ihe.org
B.Bhattacharya@unesco-ihe.org
Abstract Climate Change I
Cli t Ch Impacts on flooding in the Haor area
t fl di i th H
Haors are large saucer-shaped flood plain depressions located in the North-East region of Bangladesh During the dry season Haors are used for agriculture and
saucer shaped North East Bangladesh. n
during the rainy season they are used as fisheries The hydrograph characteristics such as the rising curve gradient (K) flood m
fisheries. (K), magnitude ratio (M) and time to peak Three GCMs CSIRO Mk3 5, ECHam5 and
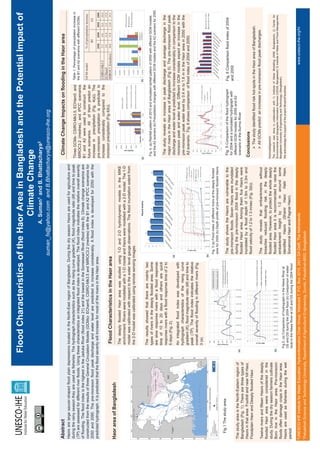
GCMs- CSIRO-Mk3.5, Table 1: Percentage of precipitation increase in
(TP) are assessed for different river floods. Using these characteristics an integrated flood index is developed. The flood index indicates the relative overall severity MIROC3.2 (medres),
MIROC3 2 (medres) and IPCC scenarios
( ) the B1 and A2 scenarios with different GCMs
GCMs.
of fl di
f flooding. Th fl d i d i th hi h t i th J d k Ri
The flood index is the highest in the Jaduka River (fl d i d 21) and th l
(flood index d the lowest i th S
t in the Someswari Ri
i River (fl d i d 8) Cli t change scenarios are
(flood ind 8). Climate h
dex i B1 and A2 were used to construct the
constructed f
t t d from th results of th
the lt f three G General Ci l ti M d l (GCM ) ECh 5, CSIRO Mk3 5 and MIROC3 2 ( d ) wit th B1 and A2 IPCC scenarios f
l Circulation Models (GCMs)- ECham5, CSIRO-Mk3.5 d MIROC3.2 (medres) it the
( th d i for GCM model % of precipitation increase
future scenarios All of them predict an
scenarios.
2050 and 2090 Th pre-monsoon fl d peak di h g and water l
d 2090. The p flood p k discharge d t level are predicted t i
l p di t d to increase considerably. A fl d index i d
id bly flood ind is developed f 2050 with th
l p d for ith the B1 A2
increase in precipitation (Fig 4(a)) The
(Fig. 4(a)).
p
predicted hydrograph It is predicted that the flood severity will increase for most of the rivers in the Haor area .
hydrograph.
y g p p y area. pre-monsoon precipitation is predicted to 2050 2090 2050 2090
CSIRO-Mk3.5
CSIRO Mk3 5 5.3
3 6.6
66 8.4
84 16.4
16 4
increase considerably compared to the
ECHam5 2.8
28 11.8
11 8 3.4
34 17.8
17 8
monsoon precipitation (Fig 4(b))
4(b)). MIROC3.2(medres)
( ) 10.0 15.8 12.0 19.2
Case study: R
C t d Ruvubu catchment
b t h t Flood Characteristics i th H
Fl d Ch t i ti in the Haor area
Haor area of Bangladesh
g
The deeply flooded Haor area was studied using 1 D and 2 D hyd dy
Th d ply fl d d H t di d i g 1-D d 2-D hydrodynamic models i th MIKE
i d l in the
environment.
environment Rivers were modelled with a 1 D model and Haors were m
1-D modelled with a 2 D model The 1 D
2-D model. 1-D
model was calibrated with respect to the water level gauge observation The flood inundation extent from
g g ns.
ns
the 2 D model was calibrated using remote sensing images
2-D images.
(a) (b)
The
Th results showed th t th
lt h d that there are mainly t
i ly two
types f i
typ of rivers i th d ply fl d d area. S
in the deeply flooded Some Fig. 4.
Fig 4 (a) Rainfall pattern of 2010 and simulated rainfall pattern of 2050 with different GCM models
and the A2 scenario (b) P ipi i changes with different GCM models and the A2 scenario for 2050
d h i ( ) Precipitation h g i h diff d l d h i f 20 0
are slow response rivers with a flood response
p p
time of 10 to 20 days and others are quick
response rivers with a flood response time of 2 to The t d
Th study reveals an i
l increase i peak di h
in k discharge and average di h
d discharge i th
in the
5 days (Fig 2)
(Fig. 2). major rivers i th H
j i in the Haor area of B gl d h (Fig 5) Th pre-monsoon fl d peak
f Bangladesh (Fig 5). The p
( ) flood p k
(a)
( ) discharge d
di h g and water l t level i predicted t i
l is p di t d to increase considerably i comparison t th
id bly in p i to the
An integrated flood index was developed with monsoon peak and water level Different GCM models expect an increase in the
p level. p
hydrograph characteristics of the rising curve pre-monsoon
pre monsoon peak water level by 0 4 m to 1 6 m in the Haor area in 2050 with the
0.4 1.6
gradient (K) flood magnitude ratio (M) and time to
(K), A2 scenario Fig 6 shows comparison of flood index of 2004 and 2050
scenario. Fig. 2050.
peak (TP). The flood index indicates the relative
overall severity of fl di i diff
ll it f flooding in different rivers (Fi
t i (Fig.
3( )
(a).
(b)
Fig.
Fig 3 (a) Flood inde of different rivers at the deeply flooded
ex
area for 2004 (b) De
epth profile of pre-monsoon flooded Haors
pre monsoon
Fig.1
Fig 1 The study area.
area
The study shows the Haors are vulnerable to the
s Fig.
Fig 5 Comparison of the flood hydrograph Fig.
Fig 6 Comparison flood index of 2004
pre monsoon
pre-monsoon floo ods.
ods Seven Haors were inundated for 2004 and a simulated hydrograph with and 2050
during the pre-m
pre m
monsoon 2004 flood in the deeply different GCM models for 2050 and A2
The study area is the North Eastern region of
North-Eastern (a)
.
flooded Haor are Among them f
f ea. five Haors were scenario in the Surma River
Bangladesh (Fig 1) There are three types of
(Fig. 1).
Haors in that area: Foothill and near hill Haor
Haor, inundated b a fl d d th of 1 5 t 3 3 and
i d t d by flood depth f 1.5m to 3.3m d
Conclusions
C l i
Floodplain Haor and Deeply flooded Haor
Haor. flood l ity f 1.2 to 1.3 /
fl d velocity of 1 2 t 1 3 m/sec (Fig 3(b))
(
(Fig. 3(b)).
( ))
hot spots Bangladesh.
¾ The study identified flood risk hot-spots in the Haor area of Bangladesh
The study e e
The study reve ls that embankments without
d ea
eals that e ba k e ts
b ithout discharges.
¾ All GCMs predict an increase in pre-monsoon flood peak discharges
Twelve rivers and fifteen Haors of the deeply
flooded Haor area were considered in the breaches reduced fl di g risk i th d ply
b h d d flooding i k in the deeply
flooded
fl d d area. However, t protect th whole d ply
Ho , to p t t the h l deeply Acknowledgement:
study.
study During the dry season farmers cultivate
The research was done in collaboration with 1) Institute of Water Modelling (IWM Bangladesh) 2) Center for
(IWM, Bangladesh),
Boro rice in the Haor area. Pre-monsoon
Pre monsoon (b) flooded Haor are it is recommended to raise the
ea
Environmental and Geographic Information Services (CEGIS Bangladesh) 3) Institute of Water and Flood Management
(CEGIS, Management,
floods ft
fl d often d damage crops i th H
in the Haor area. embankment he eight by 1 0 m around some
1.0 Bangladesh University of Engineering and Technology ( Bangladesh).
g y g g gy g )
Fig.2: (a) Comparison of hydrograph in the Nawa River at identified Haors (Shanir Haor
s Haor, Halir Haor
Haor, We k
W acknowledge th support of th project M h Fl dH
l d the t f the j t MorphoFloodHaor
Haors are used as fi h i
H d fisheries d i g th wet
during the t US and DS during the 2004 flood (b) Comparison of water
p i d
period. Sonamoral Haor and Pagnar Haor)
Haor).
level in the Nawa River at US and DS during the 2004 flood
2UNESCO-IHE Institute for Water Education, Hydroinformatics Chair Group, Westvest 7 P O Box 3015 2601 DA Delft The Neth
Education Group 7, P.O. 3015, Delft, herlands www.unesco-ihe.org/hi
www unesco-ihe org/hi
1Patuakhali Science and Technology University Department of Agricultural Engineering Dumki Patuakhali 8602 Bangladesh
gy University,
y p g Engineering, Dumki, Patuakhali-8602,
g g g