1. Identifying Proteins in Mouse Kidneys by Using
Matrix-Assisted Laser Desorption/Ionization Mass
Spectrometry
Results & Discussion - con’t
Conclusions
Methods
Results & Discussion
Background
• Greaves, John, and John Roboz. Mass Spectrometry for the Novice. Boca Raton, FL: CRC,2011. Print.
• Walch, Axel, Sandra Rauser, Sören-Oliver Deininger, and Heinz HöXer. “MALDI Imaging Mass Spectrometry for Direct
Tissue Analysis: A New Frontier for Moelcular Histology.” Histochem Cell Biol (2008): 130: 421-434.
• Walther, D. M., and M. Mann. "Accurate Quantification of More Than 4000 Mouse Tissue Proteins Reveals Minimal
Proteome Changes During Aging." Molecular & Cellular Proteomics 10, no. 2 (2010). doi:10.1074/mcp.m110.004523.
• Weiss, Robert H. "G Protein–Coupled Receptor Signalling in the Kidney."ResearchGate. N.p., n.d. Web. 10 May 2016.
<http://www.researchgate.net/publication/13591932_G_ProteinCoupled_Receptor_Signalling_in_the_Kidney>.
• Yang, Junhai, and Richard M. Caprioli. "Matrix Sublimation/Recrystallization for Imaging Proteins by Mass Spectrometry at
High Spatial Resolution." Analytical Chemistry Anal. Chem. 83, no. 14 (2011): 5728-734. doi:10.1021/ac200998a.
Abstract
Matrix-assisted laser desorption/ionization (MALDI) time-of-flight
mass spectrometry is routinely used to analyze large molecules like
peptides, proteins and nucleic acid. MALDI-TOF is used to identify
and localize the proteins found in a mouse kidney. Using an ITO
slide with the sample slices of mouse kidneys to be prepared to be
used in the MALDI. The preparation part of this research is done by
ensuring the slide is ready to be analyzed; the first step is a washing
step to improve sensitivity, then sublimation to add the matrix to our
sample and finally a rehydration step to ensure the analytes are
drawn to the matrix layer. This process has to be done before the
analyte can be used in the MALDI. After getting our different mass
spectrums, we can localize where these proteins can be found
around the kidney slices to help make out the shape of the organ
itself. The mass spectra obtained from this experiment showed
proteins ranging from 4,000 to 20,000 Da. Not all the proteins were
identified, but some of the ones identified were G-protein, beta-
actin, and profilin. These correlate with the proteins found in the
literature..
• MALDI imaging mass spectrometry (MALDI-IMS) is a tool for
analyzing the distribution of proteins through analysis of the
tissue sections. This technique can determine the distribution of
hundreds of different compounds while maintaining the integrity
of the tissue.
• Time-of-flight (TOF) analyzers are simple systems that measure
the time it takes for an ion of a given m/z to travel from the
source to the detector.
.
MALDI-TOF was used to do a proteomic analysis on
mouse kidney slices. Proteins were identified by mass using
literature data and the website Uniprot.
Not all proteins were identified, but the ones identified were
G-protein, β-actin, and profilin collate with the literature data.
Future work included doing a trypsin digest on the kidney
slices to break down proteins into peptides. This will help with
further confirmation of the proteins found.
References
Acknowledgements
This project was supported by a grant from the National Institute on
Minority Health and Health Disparities (G12MD007591) from the
National Institutes of Health and the National Science
Foundation under CHE-1126708.
Maria Cruz, Madeline Colley, Andrea R. Kelly, Stephan B.H. Bach
Department of Chemistry, University of Texas at San Antonio
Instrumental Conditions
• Mouse kidney tissue provided from Dr. Forsthuber from the
Department of Biology at UTSA. ITO glass side with tissue
was prepared by research fellow Madeline Colley.
• Washing protocol for tissue slide: 70% ethanol for 30 seconds,
100% ethanol for 30 seconds, Carnoy’s fluid (60 mL of
ethanol, 30 mL of chloroform, and 10 mL of acetic acid) for 2
minutes, 100% ethanol for 30 seconds, Nano pure water for 30
seconds, and 100% ethanol for 30 seconds.
• Sublimation: 200 mg of 2,5-Dihydrobenzoic acid (DHB) the
matrix used was added to the bottom of sublimation
glassware. Methanol was added, to help spread the matrix
evenly across the bottom. All excess methanol was
evaporated off. Tissue slide was attached using conductive
tape. The apparatus was then put in oil ~130°C, ice was
added to the top of glassware, and then was connected to the
vacuum pump. Process took about 8 minutes.
• Rehydration: Using 1 mL of nano water and 50 μL of acetic
acid on a filter paper and attaching to the top of a petri dish.
Then inserting the slide with the matrix coating in the petri
dish, using electrical tape to seal the petri dish air tight. Was
then placed in the over for 3 minutes at a 85°C temperature.
• Bruker Daltonics ultrafleXtreme MALDI-TOF
• Ion polarity: Positive
• Scan mode: MS
• Mass Range: 4 to 20 kDa
• Mode: Linear positive
• Raster width: 60 μm
• Ion source 1: 25.00 V
• Ion source 2: 22.70 V
Fig. 1 - Picture of original ITO slide with sample slices of the mouse kidneys.
The kidney slice used for analysis is marked with the number one.
Fig. 2 – Mass Spectra taken from application Mmass. The labeled peaks (a) 7663
m/z, (b) 8510 m/z, and (c) 15008 m/z were identified.
1
Fig. 3 – Mass filters for the proteins identified (a) G-protein, (b) β-actin, and (c)
profilin.
(a) (b) (c)
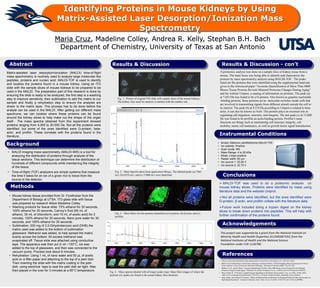
A proteomic analysis was done on a sample slice of kidney tissue from a
mouse. The main focus was being able to identify and characterize the
proteins by mass spectrometry analysis using MALDI-TOF . The peaks
listed are the proteins that were identified using the supplemental materials
given in the referenced paper “Accurate Quantification of More Than 4000
Mouse Tissue Proteins Reveals Minimal Proteome Changes During Aging”
and the website Uniprot, a catalog of information on proteins. The peak (a)
at 7,652 Da was found to be a G-protein. Also known as guanine nucleotide
-binding proteins, these proteins act as molecular switches inside cells that
are involved in transmitting signals from different stimuli outside the cell to
its interior. The peak (b) at 8,510 Da according to Uniprot is related to beta-
actin; it can also be known as Actb. This protein plays an essential role in
regulating cell migration, structure, and integrity. The last peak (c) at 15,008
Da was found to be profilin an actin-binding protein. Profilin’s main
functions are things such as maintaining cell structure integrity, cell
mobility, tumor cell metastasis, as well as growth factor signal transduction.
Fig. 4 – Mass spectra labeled with all major peaks (top). Mass filter images of where the
proteins m/z peaks are found in the actual kidney slice (bottom).