Download to read offline
![International Journal on Computational Sciences & Applications (IJCSA) Vol.5, No.3, June 2015
DOI:10.5121/ijcsa.2015.5304 37
PORTFOLIO SELECTION BY THE MEANS OF CUCKOO
OPTIMIZATION ALGORITHM
Elham Shadkam, Reza Delavari, FarzadMemariani, MortezaPoursaleh
Department of Industrial Engineering, Faculty of Eng., Khayyam University, Mashhad,
Iran
ABSTRACT
Portfolio selection is one of the most important and vital decisions that a real or legal person, who invests
in stock market should make. The main purpose of this paper is the determination of the optimal portfolio
with regard to stock returns of companies, which are active in Tehran’s stock market. For achieving this
purpose, annual statistics of companies’ stocks since Farvardin 1387 until Esfand 1392 have been used.
For analyzing statistics, information of companies’ stocks, the Cuckoo Optimization Algorithm (COA) and
Knapsack Problem have been used with the aim of increasing the total return, in order to form a financial
portfolio. At last, results merits of choosing the optimal portfolio using the COA rather than Genetic
Algorithm are given.
KEYWORDS
Meta-heuristic Algorithms, Cuckoo Optimization Algorithm, Return, Knapsack Problem.
1.INTRODUCTION
The Stock Market of Tehran is a dual purpose organization, which is a centre to collect savings
and money of the private sector in order to finance the long-period investment projects and is a
safe place to invest their surplus funds in different companies [1].
Nowadays, stock market acts a very important role in economic development using the tools like
pricing, reducing the risk, resource mobilization and optimal allocation of capital [2].Selecting
the optimal portfolio is the most important issue. There are different methods for selecting the
optimal portfolio based on the results of the research in this field [3]. During the time, the defects
of each method identified and new algorithm has been replaced.
One of the greatest theories in determining the optimal portfolio in past decades is the “Modern
Portfolio Theory” which is presented by Harry Markowitz and William Sharpe. The Modern
Portfolio Theory is a holistic approach to the stock market. Unlike the technical ones, this method
discuss about the whole stock in market. In other words, this theory has a macro perspective
versus a micro view. So the portfolio and the optimal combination of stocks are emphasized.
Although in making a portfolio, the relationship between risk and return of stocks is important.
One of the most important criteria of decision making in stock market is the return of stocks.
Return of stock itself includes information and investors can use them in their financial analysis
[4].](https://image.slidesharecdn.com/26-150708041025-lva1-app6892/85/PORTFOLIO-SELECTION-BY-THE-MEANS-OF-CUCKOO-OPTIMIZATION-ALGORITHM-1-320.jpg)
![International Journal on Computational Sciences & Applications (IJCSA) Vol.5, No.3, June 2015
DOI:10.5121/ijcsa.2015.5304 37
PORTFOLIO SELECTION BY THE MEANS OF CUCKOO
OPTIMIZATION ALGORITHM
Elham Shadkam, Reza Delavari, FarzadMemariani, MortezaPoursaleh
Department of Industrial Engineering, Faculty of Eng., Khayyam University, Mashhad,
Iran
ABSTRACT
Portfolio selection is one of the most important and vital decisions that a real or legal person, who invests
in stock market should make. The main purpose of this paper is the determination of the optimal portfolio
with regard to stock returns of companies, which are active in Tehran’s stock market. For achieving this
purpose, annual statistics of companies’ stocks since Farvardin 1387 until Esfand 1392 have been used.
For analyzing statistics, information of companies’ stocks, the Cuckoo Optimization Algorithm (COA) and
Knapsack Problem have been used with the aim of increasing the total return, in order to form a financial
portfolio. At last, results merits of choosing the optimal portfolio using the COA rather than Genetic
Algorithm are given.
KEYWORDS
Meta-heuristic Algorithms, Cuckoo Optimization Algorithm, Return, Knapsack Problem.
1.INTRODUCTION
The Stock Market of Tehran is a dual purpose organization, which is a centre to collect savings
and money of the private sector in order to finance the long-period investment projects and is a
safe place to invest their surplus funds in different companies [1].
Nowadays, stock market acts a very important role in economic development using the tools like
pricing, reducing the risk, resource mobilization and optimal allocation of capital [2].Selecting
the optimal portfolio is the most important issue. There are different methods for selecting the
optimal portfolio based on the results of the research in this field [3]. During the time, the defects
of each method identified and new algorithm has been replaced.
One of the greatest theories in determining the optimal portfolio in past decades is the “Modern
Portfolio Theory” which is presented by Harry Markowitz and William Sharpe. The Modern
Portfolio Theory is a holistic approach to the stock market. Unlike the technical ones, this method
discuss about the whole stock in market. In other words, this theory has a macro perspective
versus a micro view. So the portfolio and the optimal combination of stocks are emphasized.
Although in making a portfolio, the relationship between risk and return of stocks is important.
One of the most important criteria of decision making in stock market is the return of stocks.
Return of stock itself includes information and investors can use them in their financial analysis
[4].](https://image.slidesharecdn.com/26-150708041025-lva1-app6892/75/PORTFOLIO-SELECTION-BY-THE-MEANS-OF-CUCKOO-OPTIMIZATION-ALGORITHM-1-2048.jpg)
![International Journal on Computational Sciences & Applications (IJCSA) Vol.5, No.3, June 2015
38
Also, in different studies about determining the optimal portfolio, “Risk” is known as one of the
main criteria for determining the portfolio, which is clearly observable in earlier theories of
Markowitz and other classic economists. Modern portfolio theory is useful in making the
portfolios that have lower risk with respect to most return [5].
In the early 1950s Markowitz made the portfolio to quantity by defining the expected return as
the average of returns and the risk as its variance. In his expanded model, investors can decrease
the risk of their portfolio for certain return or increase the expected return of their portfolio for
certain risk level.
Meta-heuristic algorithms have been used in portfolio selection problem including Genetic
algorithm [6], [7], [8], [9]; particle swarm [10]; Ant colony algorithm [11], [12]; simulated
annealing algorithm [13].
In this research some of the superior companies of stock market have been chosen and the
information of their return is gathered. First, using the Knapsack model, portfolio selection
problem changed into a mathematical model and then in order to select the optimal portfolio,
Cuckoo optimization Algorithm (COA) is used for solving the Knapsack model. At last the
Knapsack model is solved using the Genetic algorithm and the results compare with COA.
In the second section, COA algorithm has been introduced briefly. The third section introduces
the data used in this article. The fourth section provides the results of implementing the COA in
portfolio selection problem, proves the effectiveness of this algorithm, and draws some
comparisons to a Genetic Algorithm implementation.
2.INTRODUCING THE CUCKOO OPTIMIZATION ALGORITHM
The Cuckoo optimization algorithm has been presented by Yang and Deb in 2009 [14]. This
algorithm is inspired by the life of cuckoos in egg laying method and the levy flight instead of
simple random isotropic step. Later, in 2011, the COA has been investigated with more details by
Rajabioun [15].
Like other evolutionary algorithms, this one begins with an initial population of answers
(cuckoos). These cuckoos have some eggs and they put these eggs in nests of other birds’ and
wait until the host bird maintains these eggs beside her eggs. In fact, this lazy bird forces other
birds to survive her generation so nicely. Some of the eggs that have less similarity to the host
bird’s eggs will be recognized and destroyed.
In fact the cuckoos improve to imitate the target host bird’s eggs and also the host birds learn how
to recognize the fake eggs continuously.The number of survived eggs in each zone shows
suitability of this zone, and the greater number of survived eggs, the more attention pays to that
zone. In fact, this is the parameter that the COA wants to optimize. This algorithm applied to
many problem and good results attained [16], [17]. The COA diagram is given Figure 1. In order
to solve an optimization problem, the variable values of the problem should take shape out of an
array called “habitat”. In an optimization problem, the varN of a habitat will be an var1 N× array
that shows the current living location of cuckoos. This array describes as:
[ ]1 2 var, ,..., Nhabitat X X X=](https://image.slidesharecdn.com/26-150708041025-lva1-app6892/85/PORTFOLIO-SELECTION-BY-THE-MEANS-OF-CUCKOO-OPTIMIZATION-ALGORITHM-2-320.jpg)
![International Journal on Computational Sciences & Applications (IJCSA) Vol.5, No.3, June 2015
39
The suitability (profit) in the current habitat obtains by evaluating the profit function ( pf ) in the
habitat. So:
Profit = f b(habitat) = f b(x1 ,x2 ,...,xNvar)
For starting an optimization algorithm, a habitat matrix in size of pop varN N∗ is made, then for
each habitat, a random number of eggs will be allocated. Considering the number of eggs that
each cuckoo egg lays and also the distance between the cuckoos and the current optimized zone,
the laying radius will be calculated and the cuckoos begin to egg lay in that zone.
<Figure 1> Flowchart of COA [15]
The Egg Laying Radius (ELR) is given by
( )
'
hi low
Number of current cuckoo s eggs
ELR a Var Var
Total number of eggs
= × × −
Then each cuckoo begins to egg laying in the nests that are in her ELR. So after each egg laying,
p% of eggs (usually 10%) that is less profitable destroys. Other chicks grow up in the host nests.](https://image.slidesharecdn.com/26-150708041025-lva1-app6892/85/PORTFOLIO-SELECTION-BY-THE-MEANS-OF-CUCKOO-OPTIMIZATION-ALGORITHM-3-320.jpg)
![International Journal on Computational Sciences & Applications (IJCSA) Vol.5, No.3, June 2015
40
2.1.THE CUCKOO’S MIGRATION
When the little cuckoos grow up and get mature, they live in their zone and groups for a while,
but when the laying time comes they migrate to better zone that have a better possibility of
survival.
After the cuckoos groups in general different living zones composed (justified region or search
space of the problem), the group with the best location will be the migration target for other
cuckoos
This is hard to find out each cuckoo belongs to which group when the grown cuckoos live all
around the environment. For solving this problem, the cuckoos will cluster by the “K-means”
method, which is a classic way to group (finding a K between 3 and 5 is usually acceptable).
As it is shown in Figure 2, when the cuckoos migrate to the target, they don’t travel the direct
way. They just travel a part of the way (λ %) also in that part there is deflection (φ).
<Figure 2> The cuckoos’ migration to the target [15]
These two parameters (λ, φ) helps cuckoos to explore a larger area. λ is a random number
between 0 and 1 and φ is a number between
6
π
− and
6
π
.
The migration formula is:
Next Habitat current Habitat Goal Point current HabitatX X F(X X )= + −
2.2.THE CONVERGENCE OF ALGORITHM
After some iteration, all of the cuckoos migrate to an optimized point with the most similarity of
eggs to the host ones and access to the richest food sources.
This location has the top profit and in this location we have the least number of the killed eggs.
The convergence of more than 95% of all cuckoos to a single point put the COA at its end.](https://image.slidesharecdn.com/26-150708041025-lva1-app6892/85/PORTFOLIO-SELECTION-BY-THE-MEANS-OF-CUCKOO-OPTIMIZATION-ALGORITHM-4-320.jpg)
![International Journal on Computational Sciences & Applications (IJCSA) Vol.5, No.3, June 2015
43
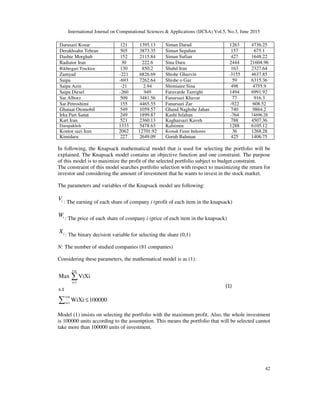
4.IMPLEMENTING THE COA MODEL TO PROPOSED MODEL
In this part, we want to implement the COA (version of [15]) to Knapsack model of portfolio
selection problem. The proposed mathematical model coded in MATLAB. The constraint of the
model related to the amount of investment, applied by using the multiplicative violation function
and the violation factor a=10 in the objective function.
According to the Violation function, the constraint will add to objective function as (2).
1
1,0
100000
i n
i
WiXi
Violation Max
=
=
= −
∑
As can be seen the value of violation function is zero or a positive magnitude. If the constraint of
model is satisfied, the violation magnitude becomes zero and the violation function doesn’t affect
the objective function. The objective function with the violation is as (3).
i=n
i=1
Max ViXi (1+ (Violation))α∑
One of the most important issues in meta-heuristic algorithms is parameter setting. The COA
parameters are as following:
Number of initial population=10, Minimum number of eggs for each cuckoo=2, Maximum
number of eggs for each cuckoo=4, Maximum iterations of the COA=200, Maximum number of
cuckoos that can live at the same time=10.
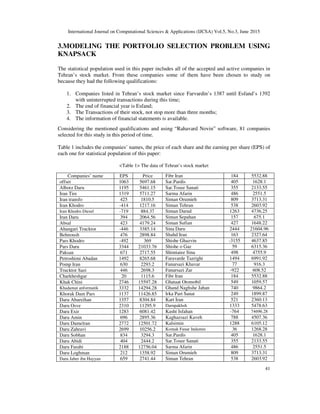
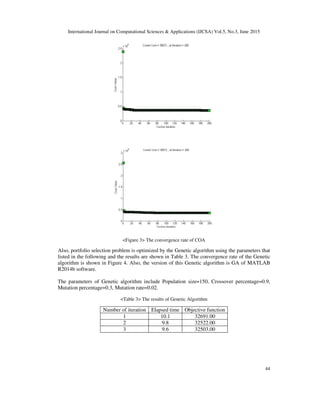
Portfolio selection problem was solved by the COA in several times. Some of obtained solutions
are shown in Table 2. Also, the convergence rate of COA is shown in Figure 3.
<Table2> The results of COA
Objective functionElapsed timeIteration number
35672.008.921
36041.008.82
35812.009.13
(2)
(3)](https://image.slidesharecdn.com/26-150708041025-lva1-app6892/85/PORTFOLIO-SELECTION-BY-THE-MEANS-OF-CUCKOO-OPTIMIZATION-ALGORITHM-7-320.jpg)
![International Journal on Computational Sciences & Applications (IJCSA) Vol.5, No.3, June 2015
46
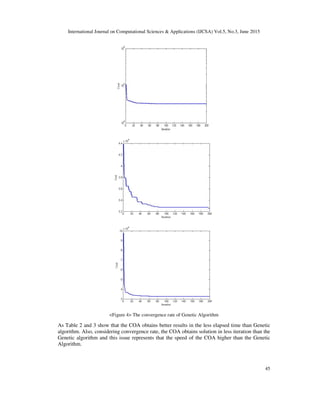
5.CONCLUSION
In this paper, we tried to select the best portfolio with respect to maximizing the profit using the
data of Tehran’s stock market.
For achieving this purpose, first the mathematical model (the Knapsack model) of portfolio
selection problem that obtains the most possible profit was modelled.
Assuming the data of Tehran’s stock market and the Knapsack model, the COA applied to select
the optimized portfolio of stocks. Then, this problem implemented in the Genetic Algorithm too
and the portfolio selected this way. At last, two portfolios obtained (from the COA and the
Genetic Algorithm). Comparing the final results showed more convergence rate and accuracy of
the COA rather than the Genetic Algorithm in low iteration.
For continuing the research, it is possible to expand the model and development an integer model
considering the risk factor.
REFERENCES
[1] Sefiane, S., & Benbouziane, M. (2012). Portfolio Selection Using Genetic Algorithm. Journal of
Applied Finance &BANKING, 2(4), 143-154.
[2] Ghodrati, H., & Zahiri, Z. (2014). A Monte Carlo simulation technique to determine the optimal
portfolio. Management SCIENCE LETTERS, 4(3), 465-474.
[3] Shadkam, E., (2014). FC Approach in Portfolio Selection of Tehran’s Stock Market, Journal of Asian
Finance, Economics and Business, 1(2), 31-37.
[4] Yao, H., Li, Z., & Chenc, S. (2014). Continuous-time mean-variance portfolio selection with only
risky assets. Economic MODELLING. 36, 244–251.
[5] Chiu, M. C., & Wong, H. Y. (2014). Mean-variance portfolio selection with correlation risk. Journal of
Computational and Applied Mathematics, 263, 432–444.
[6] Rupak Bhattacharyya, R., Ahmed Hossain, Sh., Kar, S. (2014). Fuzzy cross-entropy, mean, variance,
skewness models for portfolio selection. Journal of King Saud University - Computer and Information
Sciences, 26(1), 79–87.
[7] Chien-Feng Huang, C.F. (2012). A hybrid stock selection model using genetic algorithms and support
vector regression, Applied Soft Computing, 12(2), 807–818
[8] Bermúdez, J.D., Segura, J.V., Vercher, E., (2012). A multi-objective genetic algorithm for cardinality
constrained fuzzy portfolio selection, Fuzzy Sets and Systems, 188(1), 16-26.
[9] Yong-Jun Liu, Y.J., Wei-Guo Zhang, W.G. (2015). A multi-period fuzzy portfolio optimization model
with minimum transaction lots, European Journal of Operational Research, 242(3), 933–941.
[10] Guang He, G., Nan-jing Huang, N.J. (2014). A new particle swarm optimization algorithm with an
application, Applied Mathematics and Computation, 232, 521-528.
[11] Salah Bouktif, S., Adel, M. (2013). Ant colony based approach to predict stock market movement
from mood collected on Twitter. Proceedings of the 2013 IEEE/ACM International Conference on
Advances in Social Networks Analysis and Mining, 837-845.
[12] Najafi Moghadam, A., Rahnama roodposhti, F., Farrokhi, M. (2014). Optimization of stock portfolio
based on ant Colony & grey theory. International Research Journal of Applied and Basic Sciences, 8
(7): 780-788. [13] Crama, Y., Schyns, M. (2003). Simulated annealing for complex portfolio
selection problems, European Journal of Operational Research, 150, 546–571
[14] Yang, X.S., Deb, S. (2009). Cuckoo search via Lévy Flights, World Congress on Nature &
Biologically Inspired Computing (NaBIC2009). IEEE Publications, 210-214.
[15] R., Rajabioun, (2011). Cuckoo Optimization Algorithm. Applied Soft Computing journal, 11, 5508-
5518.
[16] Shadkam, E., Bijari, M. (2015). The Optimization of Bank Branches Efficiency by Means of
Response Surface Method and Data Envelopment Analysis: A Case of Iran, Journal of Asian Finance,
Economics and Business, 2(2), 13-18.
[17] Shadkam, E., Bijari, M. (2014). Evaluation the efficiency of cuckoo optimization algorithm,
International Journal on Computational Science & Applications, 4(2), 39-47.](https://image.slidesharecdn.com/26-150708041025-lva1-app6892/85/PORTFOLIO-SELECTION-BY-THE-MEANS-OF-CUCKOO-OPTIMIZATION-ALGORITHM-10-320.jpg)

This paper presents a method for optimal portfolio selection in Tehran's stock market using the Cuckoo Optimization Algorithm (COA). By analyzing annual stock return data from 81 active companies, the study compares the effectiveness of COA with genetic algorithms in maximizing investment returns. The findings demonstrate the advantages of COA in achieving optimal portfolio allocations while considering financial constraints.