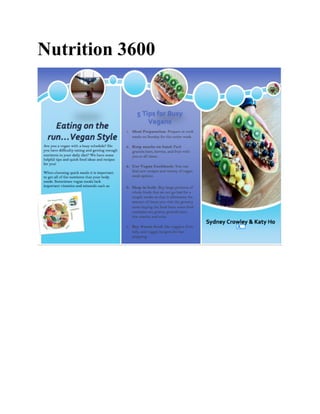
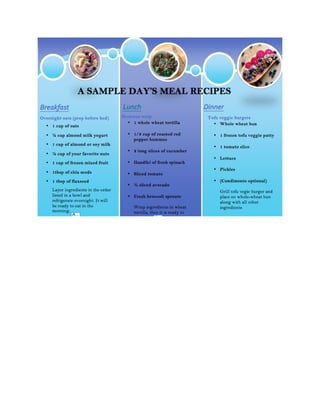
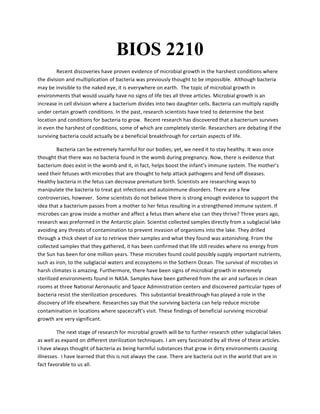
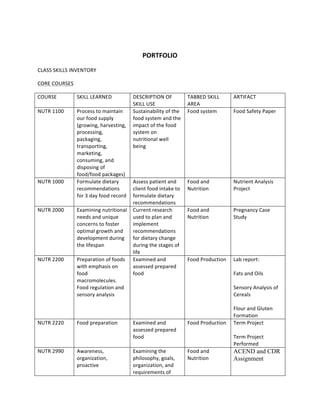
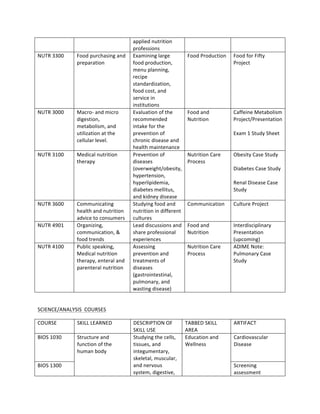
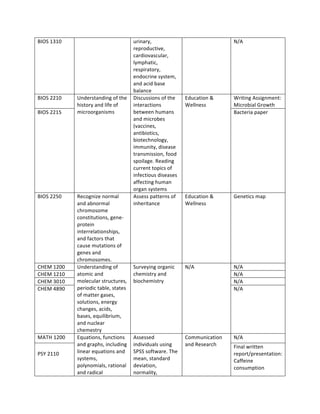
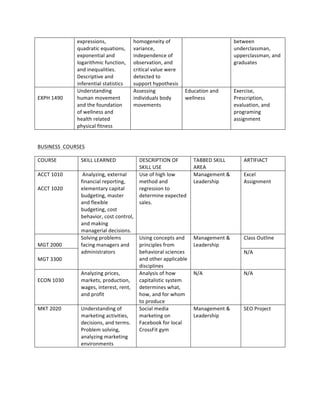
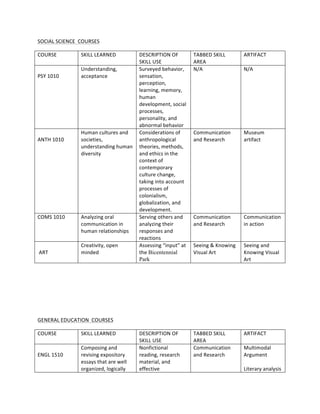
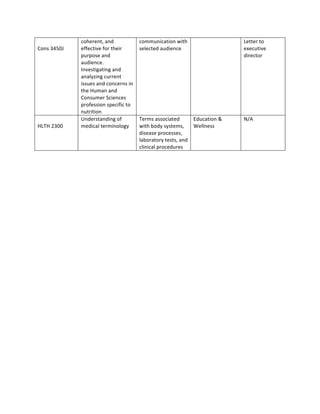
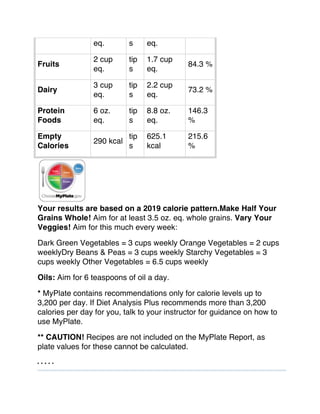
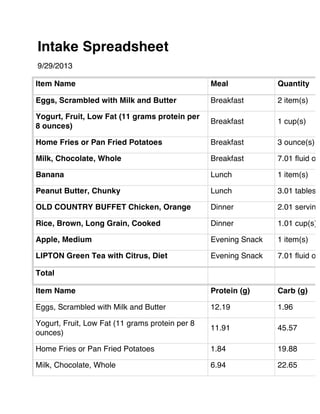
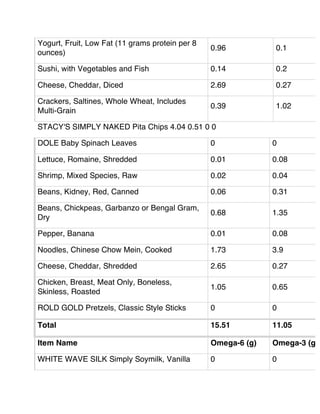
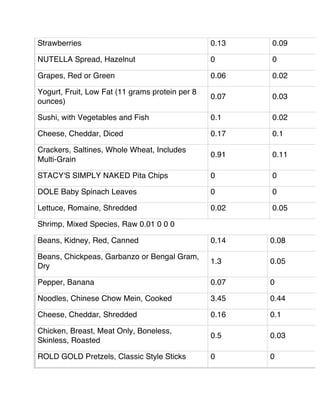
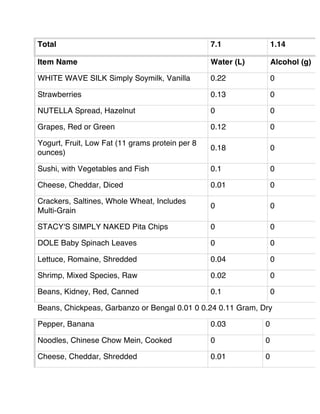
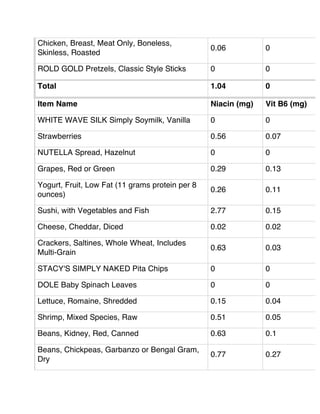
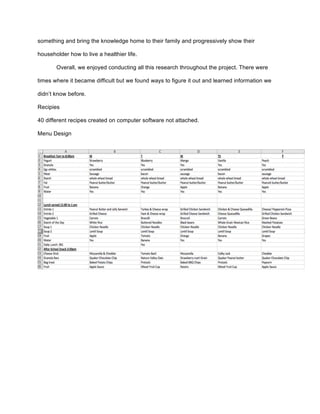
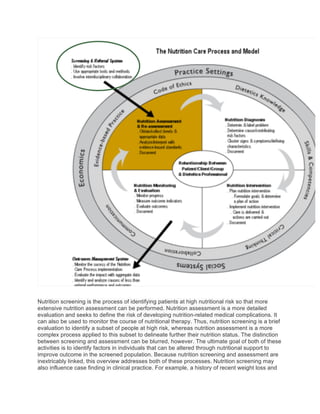
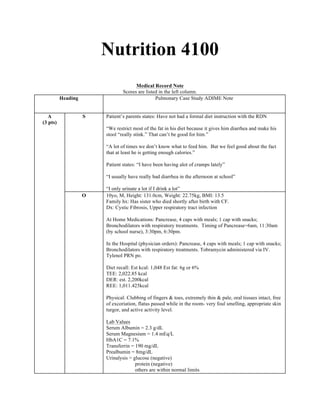
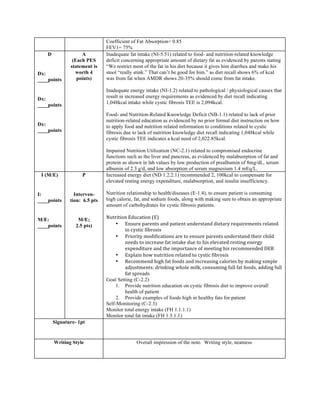
This document provides a skills inventory for a nutrition student's portfolio. It lists the core nutrition and science courses taken, along with the key skills learned and how they were applied. Examples of artifacts demonstrating skills are also included. The courses covered topics like food systems, nutrition through the lifespan, medical nutrition therapy, food production, microbiology, genetics, chemistry, statistics, and business concepts. Skills ranged from assessing nutrition intake and formulating recommendations to examining food preparation and large-scale food service operations.


![!
!
Lorem&Ipsum&
!
Lorem$Ipsum$Dolor$
[Street$Address]$
[City],$[State][Postal$Code]$
[Web$Address]$
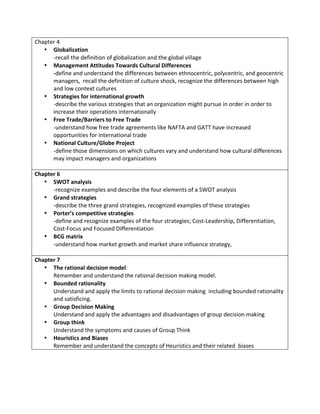
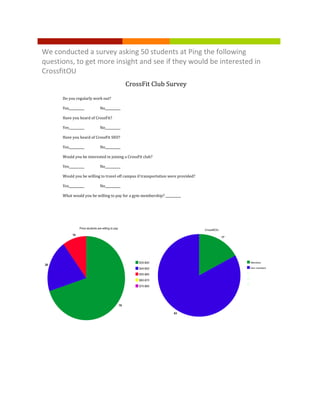
CONCLUSION
Feasibility
• Out of 50 people surveyed at Ping 17% showed interest in a
Crossfit club, this shows promising opportunity for growth in
regards to CrossfitSEO
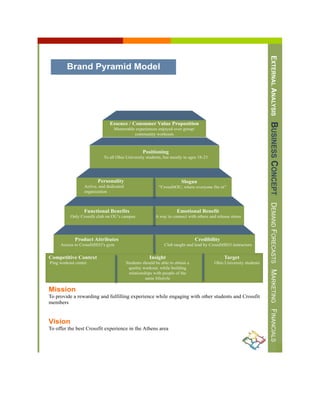
• Although it may be difficult to gain support from the Senate
Appropriations Commission, we believe it to be possible as a
substantial amount of students have shown interest
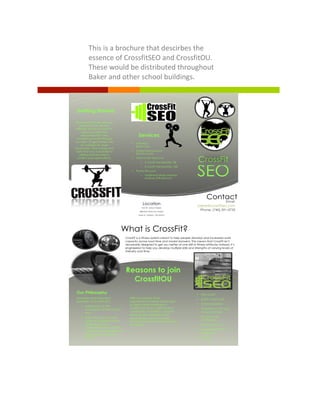
• The brochure lays out the essence of Crossfit and this we believe
will generate more interest
• A major weakness of CrossfitSEO is the lack of transportation,
with CrossfitOU the car pooling would will solve this issue](https://image.slidesharecdn.com/7ca66d48-d95d-4e49-8dc2-b91c3026896b-161116190851/85/PORTFOLIO-145-320.jpg)