Port Allen Brusly Addis Home Sales April 2014 West Baton Rouge

http://www.westbatonrougeappraiser.com/ - Port Allen Brusly Addis Home Sales April 2013 versus April 2014 in West Baton Rouge Parish These are ALL home types, both new construction and existing homes, located within West Baton Rouge Parish, Louisiana. Report by Greater Baton Rouge's Home Appraiser, Bill Cobb. Port Allen Brusly Addis Home Sales Sold Properties by Month Apr-2013 vs Apr-2014: The number of Sold properties is up 35% Port Allen Brusly Addis Home Sales Median Sold Price by Month Apr-2013 vs Apr-2014: The median sold price is down -1% Port Allen Brusly Addis Home Sales Under Contract Properties by Month Apr-2013 vs Apr-2014: The number of Under Contract properties is down -12% Port Allen Brusly Addis Home Sales Months Supply of Inventory Apr-2013 vs Apr-2014: The average months supply of inventory is up 5% Port Allen Brusly Addis Home Sales Average Days on Market by Month Apr-2013 vs Apr-2014: The average days on market is up 57% Port Allen Brusly Addis Home Sales Expired Properties by Month Apr-2013 vs Apr-2014: The number of Expired properties is down -20% Port Allen Brusly Addis Home Sales New Properties by Month Apr-2013 vs Apr-2014: The number of New properties is down -34% Port Allen Brusly Addis Home Sales For Sale Properties by Month Apr-2013 vs Apr-2014: The number of For Sale properties is down -9% Port Allen Brusly Addis Home Sales Median For Sale vs Median Sold Apr-2013 vs Apr-2014: The median price of for sale properties is up 9% and the median price of sold properties is down -1% Port Allen Brusly Addis Home Sales Supply & Demand by Month Apr-2013 vs Apr-2014: The number of for sale properties is down -9% and the number of sold properties is up 35% Port Allen Brusly Addis Home Sales April 2013 versus April 2014 in West Baton Rouge Parish Based on information from Greater Baton Rouge Association of REALTORS® \MLS for period 04/01/2013 to 04/30/2013 to 04/01/2014 to 04/30/2014, extracted on 05/18/2014.

Recommended
More Related Content
More from Bill Cobb, Appraiser
More from Bill Cobb, Appraiser (20)
Recently uploaded
Recently uploaded (11)
Port Allen Brusly Addis Home Sales April 2014 West Baton Rouge
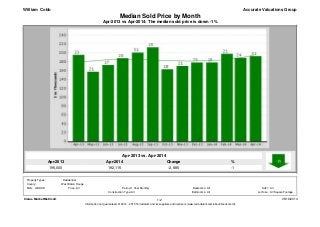
- 1. Apr-2014 192,115 Apr-2013 195,000 % -1 Change -2,885 Apr-2013 vs Apr-2014: The median sold price is down -1% Median Sold Price by Month Accurate Valuations Group Apr-2013 vs. Apr-2014 William Cobb Clarus MarketMetrics® 05/19/2014 Information not guaranteed. © 2014 - 2015 Terradatum and its suppliers and licensors (www.terradatum.com/about/licensors.td). 1/2 MLS: GBRAR Bedrooms: All All Construction Type: All1 Year Monthly SqFt: Bathrooms: Lot Size:All All Square Footage Period:All County: Property Types: : Residential West Baton Rouge Price:
- 2. Median Sold Price by Month Apr-2013 vs Apr-2014: The median sold price is down -1% Accurate Valuations GroupWilliam Cobb Sold Median Price Units Avg DOMTime Period Apr-14 192,115 31 96 Mar-14 188,290 24 111 Feb-14 197,500 21 66 Jan-14 177,900 15 58 Dec-13 177,785 23 71 Nov-13 170,040 21 79 Oct-13 162,497 18 105 Sep-13 212,047 25 80 Aug-13 200,195 31 68 Jul-13 187,500 20 83 Jun-13 172,245 17 90 May-13 157,000 21 124 Apr-13 195,000 23 80 Clarus MarketMetrics® 05/19/2014 Information not guaranteed. © 2014 - 2015 Terradatum and its suppliers and licensors (www.terradatum.com/about/licensors.td). 22/
- 3. Apr-2013 vs Apr-2014: The median price of for sale properties is up 9% and the median price of sold properties is down -1% Accurate Valuations Group Apr-2013 vs. Apr-2014 183,400 9 William Cobb 199,700 Apr-2014 Median For Sale vs Median Sold ChangeApr-2013 % 16,300 Apr-2013 Apr-2014 % 195,000 -1 Apr-2013 vs. Apr-2014 192,115 Change -2,885 Clarus MarketMetrics® 05/19/2014 Information not guaranteed. © 2014 - 2015 Terradatum and its suppliers and licensors (www.terradatum.com/about/licensors.td). 1/2 MLS: GBRAR Bedrooms: All All Construction Type: All1 Year Monthly SqFt: Bathrooms: Lot Size:All All Square Footage Period:All County: Property Types: : Residential West Baton Rouge Price:
- 4. Median For Sale vs Median Sold Apr-2013 vs Apr-2014: The median price of for sale properties is up 9% and the median price of sold properties is down -1% Accurate Valuations GroupWilliam Cobb For SaleMedian SoldMedian For Sale # Properties # PropertiesSold Price Difference Time Period Apr-14 126 31199,700 192,115 -7,585 Mar-14 153 24199,000 188,290 -10,710 Feb-14 153 21200,900 197,500 -3,400 Jan-14 150 15199,550 177,900 -21,650 Dec-13 136 23193,900 177,785 -16,115 Nov-13 151 21193,900 170,040 -23,860 Oct-13 157 18193,900 162,497 -31,403 Sep-13 167 25189,000 212,047 23,047 Aug-13 160 31188,750 200,195 11,445 Jul-13 153 20187,900 187,500 -400 Jun-13 150 17187,900 172,245 -15,655 May-13 149 21187,900 157,000 -30,900 Apr-13 138 23183,400 195,000 11,600 Clarus MarketMetrics® Information not guaranteed. © 2014 - 2015 Terradatum and its suppliers and licensors (www.terradatum.com/about/licensors.td). 05/19/201422/
- 5. Apr-2014 31 Apr-2013 23 % 35 Change 8 Apr-2013 vs Apr-2014: The number of Sold properties is up 35% Sold Properties by Month Accurate Valuations Group Apr-2013 vs. Apr-2014 William Cobb Clarus MarketMetrics® 05/19/2014 Information not guaranteed. © 2014 - 2015 Terradatum and its suppliers and licensors (www.terradatum.com/about/licensors.td). 1/2 MLS: GBRAR Bedrooms: All All Construction Type: All1 Year Monthly SqFt: Bathrooms: Lot Size:All All Square Footage Period:All County: Property Types: : Residential West Baton Rouge Price:
- 6. Sold Properties by Month Apr-2013 vs Apr-2014: The number of Sold properties is up 35% Accurate Valuations GroupWilliam Cobb Time Period Units Median Price Avg DOM Apr-14 192,11531 96 Mar-14 188,29024 111 Feb-14 197,50021 66 Jan-14 177,90015 58 Dec-13 177,78523 71 Nov-13 170,04021 79 Oct-13 162,49718 105 Sep-13 212,04725 80 Aug-13 200,19531 68 Jul-13 187,50020 83 Jun-13 172,24517 90 May-13 157,00021 124 Apr-13 195,00023 80 Clarus MarketMetrics® 05/19/2014 Information not guaranteed. © 2014 - 2015 Terradatum and its suppliers and licensors (www.terradatum.com/about/licensors.td). 22/
- 7. Apr-2014 23 Apr-2013 26 % -12 Change -3 Apr-2013 vs Apr-2014: The number of Under Contract properties is down -12% Under Contract Properties by Month Accurate Valuations Group Apr-2013 vs. Apr-2014 William Cobb Clarus MarketMetrics® 05/19/2014 Information not guaranteed. © 2014 - 2015 Terradatum and its suppliers and licensors (www.terradatum.com/about/licensors.td). 1/2 AllBathrooms: SqFt: All : Residential All Square FootageConstruction Type: Lot Size:GBRAR West Baton Rouge Period: 1 Year Monthly Price: MLS: All AllAll Property Types: Bedrooms: County:
- 8. Under Contract Properties by Month Apr-2013 vs Apr-2014: The number of Under Contract properties is down -12% Accurate Valuations GroupWilliam Cobb Units Avg DOMMedian PriceTime Period Apr-14 196,90023 132 Mar-14 185,89736 66 Feb-14 197,45020 133 Jan-14 182,25020 86 Dec-13 182,90013 102 Nov-13 177,90018 62 Oct-13 187,90019 77 Sep-13 188,40024 94 Aug-13 211,41529 82 Jul-13 197,00013 51 Jun-13 187,90018 72 May-13 168,40018 120 Apr-13 168,40026 84 Clarus MarketMetrics® 05/19/2014 Information not guaranteed. © 2014 - 2015 Terradatum and its suppliers and licensors (www.terradatum.com/about/licensors.td). 22/
- 9. Apr-2014 19 Apr-2013 29 % -34 Change -10 Apr-2013 vs Apr-2014: The number of New properties is down -34% New Properties by Month Accurate Valuations Group Apr-2013 vs. Apr-2014 William Cobb Clarus MarketMetrics® 05/19/2014 Information not guaranteed. © 2014 - 2015 Terradatum and its suppliers and licensors (www.terradatum.com/about/licensors.td). 1/2 MLS: GBRAR Bedrooms: All All Construction Type: All1 Year Monthly SqFt: Bathrooms: Lot Size:All All Square Footage Period:All County: Property Types: : Residential West Baton Rouge Price:
- 10. New Properties by Month Apr-2013 vs Apr-2014: The number of New properties is down -34% Accurate Valuations GroupWilliam Cobb Units Median PriceTime Period Apr-14 207,00019 Mar-14 185,00029 Feb-14 218,44031 Jan-14 209,50032 Dec-13 188,94214 Nov-13 189,54021 Oct-13 193,90025 Sep-13 194,40042 Aug-13 209,00029 Jul-13 206,45030 Jun-13 201,00030 May-13 179,00542 Apr-13 188,20029 Clarus MarketMetrics® 05/19/2014 Information not guaranteed. © 2014 - 2015 Terradatum and its suppliers and licensors (www.terradatum.com/about/licensors.td). 22/
- 11. Apr-2014 126 Apr-2013 138 % -9 Change -12 Apr-2013 vs Apr-2014: The number of For Sale properties is down -9% For Sale Properties by Month Accurate Valuations Group Apr-2013 vs. Apr-2014 William Cobb Clarus MarketMetrics® 05/19/2014 Information not guaranteed. © 2014 - 2015 Terradatum and its suppliers and licensors (www.terradatum.com/about/licensors.td). 1/2 MLS: GBRAR Bedrooms: All All Construction Type: All1 Year Monthly SqFt: Bathrooms: Lot Size:All All Square Footage Period:All County: Property Types: : Residential West Baton Rouge Price:
- 12. For Sale Properties by Month Apr-2013 vs Apr-2014: The number of For Sale properties is down -9% Accurate Valuations GroupWilliam Cobb Units Avg DOMMedian PriceTime Period Apr-14 199,700126 169 Mar-14 199,000153 147 Feb-14 200,900153 150 Jan-14 199,550150 150 Dec-13 193,900136 159 Nov-13 193,900151 139 Oct-13 193,900157 127 Sep-13 189,000167 120 Aug-13 188,750160 132 Jul-13 187,900153 123 Jun-13 187,900150 124 May-13 187,900149 123 Apr-13 183,400138 127 Clarus MarketMetrics® 05/19/2014 Information not guaranteed. © 2014 - 2015 Terradatum and its suppliers and licensors (www.terradatum.com/about/licensors.td). 22/
- 13. Apr-2014 4 Apr-2013 5 % -20 Change -1 Apr-2013 vs Apr-2014: The number of Expired properties is down -20% Expired Properties by Month Accurate Valuations Group Apr-2013 vs. Apr-2014 William Cobb 05/19/2014Clarus MarketMetrics® 1/2 MLS: GBRAR Bedrooms: All All Construction Type: All1 Year Monthly SqFt: Bathrooms: Lot Size:All All Square Footage Period:All County: Property Types: : Residential West Baton Rouge Price:
- 14. Expired Properties by Month Apr-2013 vs Apr-2014: The number of Expired properties is down -20% Accurate Valuations GroupWilliam Cobb Avg DOMUnits Median Price Apr-14 199,5004 321 Mar-14 211,40010 180 Feb-14 236,0009 151 Jan-14 189,4508 165 Dec-13 130,0005 275 Nov-13 213,00011 187 Oct-13 194,2008 160 Sep-13 137,00011 201 Aug-13 179,9506 406 Jul-13 205,0009 115 Jun-13 282,6009 259 May-13 219,00011 147 Apr-13 128,0005 171 Clarus MarketMetrics® 05/19/2014 Information not guaranteed. © 2014 - 2015 Terradatum and its suppliers and licensors (www.terradatum.com/about/licensors.td). 22/
- 15. Apr-2013 vs Apr-2014: The number of for sale properties is down -9% and the number of sold properties is up 35% Accurate Valuations Group Apr-2013 vs. Apr-2014 138 -9 William Cobb 126 Apr-2014 Supply & Demand by Month ChangeApr-2013 % -12 Apr-2013 Apr-2014 % 23 35 Apr-2013 vs. Apr-2014 31 Change 8 Clarus MarketMetrics® 05/19/2014 Information not guaranteed. © 2014 - 2015 Terradatum and its suppliers and licensors (www.terradatum.com/about/licensors.td). 1/2 MLS: GBRAR Bedrooms: All All Construction Type: All1 Year Monthly SqFt: Bathrooms: Lot Size:All All Square Footage Period:All County: Property Types: : Residential West Baton Rouge Price:
- 16. Supply & Demand by Month Apr-2013 vs Apr-2014: The number of for sale properties is down -9% and the number of sold properties is up 35% William Cobb Accurate Valuations Group For Sale Sold # Properties Avg DOM Avg DOM # Properties Time Period Apr-14 169 96126 31 Mar-14 147 111153 24 Feb-14 150 66153 21 Jan-14 150 58150 15 Dec-13 159 71136 23 Nov-13 139 79151 21 Oct-13 127 105157 18 Sep-13 120 80167 25 Aug-13 132 68160 31 Jul-13 123 83153 20 Jun-13 124 90150 17 May-13 123 124149 21 Apr-13 127 80138 23 Clarus MarketMetrics® 05/19/2014 Information not guaranteed. © 2014 - 2015 Terradatum and its suppliers and licensors (www.terradatum.com/about/licensors.td). 22/
- 17. Apr-2014 132 Apr-2013 84 % 57 Change 48 Apr-2013 vs Apr-2014: The average days on market is up 57% The Average Days on Market by Month Accurate Valuations Group Apr-2013 vs. Apr-2014 William Cobb West Baton Rouge All 1 Year Monthly County: Period:Price: Property Types: : Residential 05/19/20141/2Clarus MarketMetrics® All Square Footage Bedrooms: All AllSqFt: All Lot Size:Bathrooms:AllConstruction Type: MLS: GBRAR
- 18. The Average Days on Market by Month Apr-2013 vs Apr-2014: The average days on market is up 57% Accurate Valuations GroupWilliam Cobb # UC UnitsAvg DOMTime Period Apr-14 23132 Mar-14 3666 Feb-14 20133 Jan-14 2086 Dec-13 13102 Nov-13 1862 Oct-13 1977 Sep-13 2494 Aug-13 2982 Jul-13 1351 Jun-13 1872 May-13 18120 Apr-13 2684 Clarus MarketMetrics® 2/2 05/19/2014 Information not guaranteed. © 2014 - 2015 Terradatum and its suppliers and licensors (www.terradatum.com/about/licensors.td).
- 19. Apr-2013 vs Apr-2014: The average months supply of inventory is up 5% Accurate Valuations Group Apr-2013 vs. Apr-2014 4.1 5 William Cobb 4.3 Apr-2014 Months Supply of Inventory ChangeApr-2013 % 0.2 Clarus MarketMetrics® 05/19/2014 Information not guaranteed. © 2014 - 2015 Terradatum and its suppliers and licensors (www.terradatum.com/about/licensors.td). 1/2 MLS: GBRAR Bedrooms: All All Construction Type: All1 Year Monthly SqFt: Bathrooms: Lot Size:All All Square Footage Period:All County: Property Types: : Residential West Baton Rouge Price:
- 20. Months Supply of Inventory Apr-2013 vs Apr-2014: The average months supply of inventory is up 5% William Cobb Accurate Valuations Group During MonthLast Day of Month MSI # Units For Sale # UC Units UC Avg DOMTime Period Apr-14 23 13299 4.3 Mar-14 36 66107 3.0 Feb-14 20 133124 6.2 Jan-14 20 86122 6.1 Dec-13 13 102118 9.1 Nov-13 18 62122 6.8 Oct-13 19 77130 6.8 Sep-13 24 94132 5.5 Aug-13 29 82125 4.3 Jul-13 13 51131 10.1 Jun-13 18 72123 6.8 May-13 18 120120 6.7 Apr-13 26 84107 4.1 Clarus MarketMetrics® 05/19/2014 Information not guaranteed. © 2014 - 2015 Terradatum and its suppliers and licensors (www.terradatum.com/about/licensors.td). 22/