Download to read offline
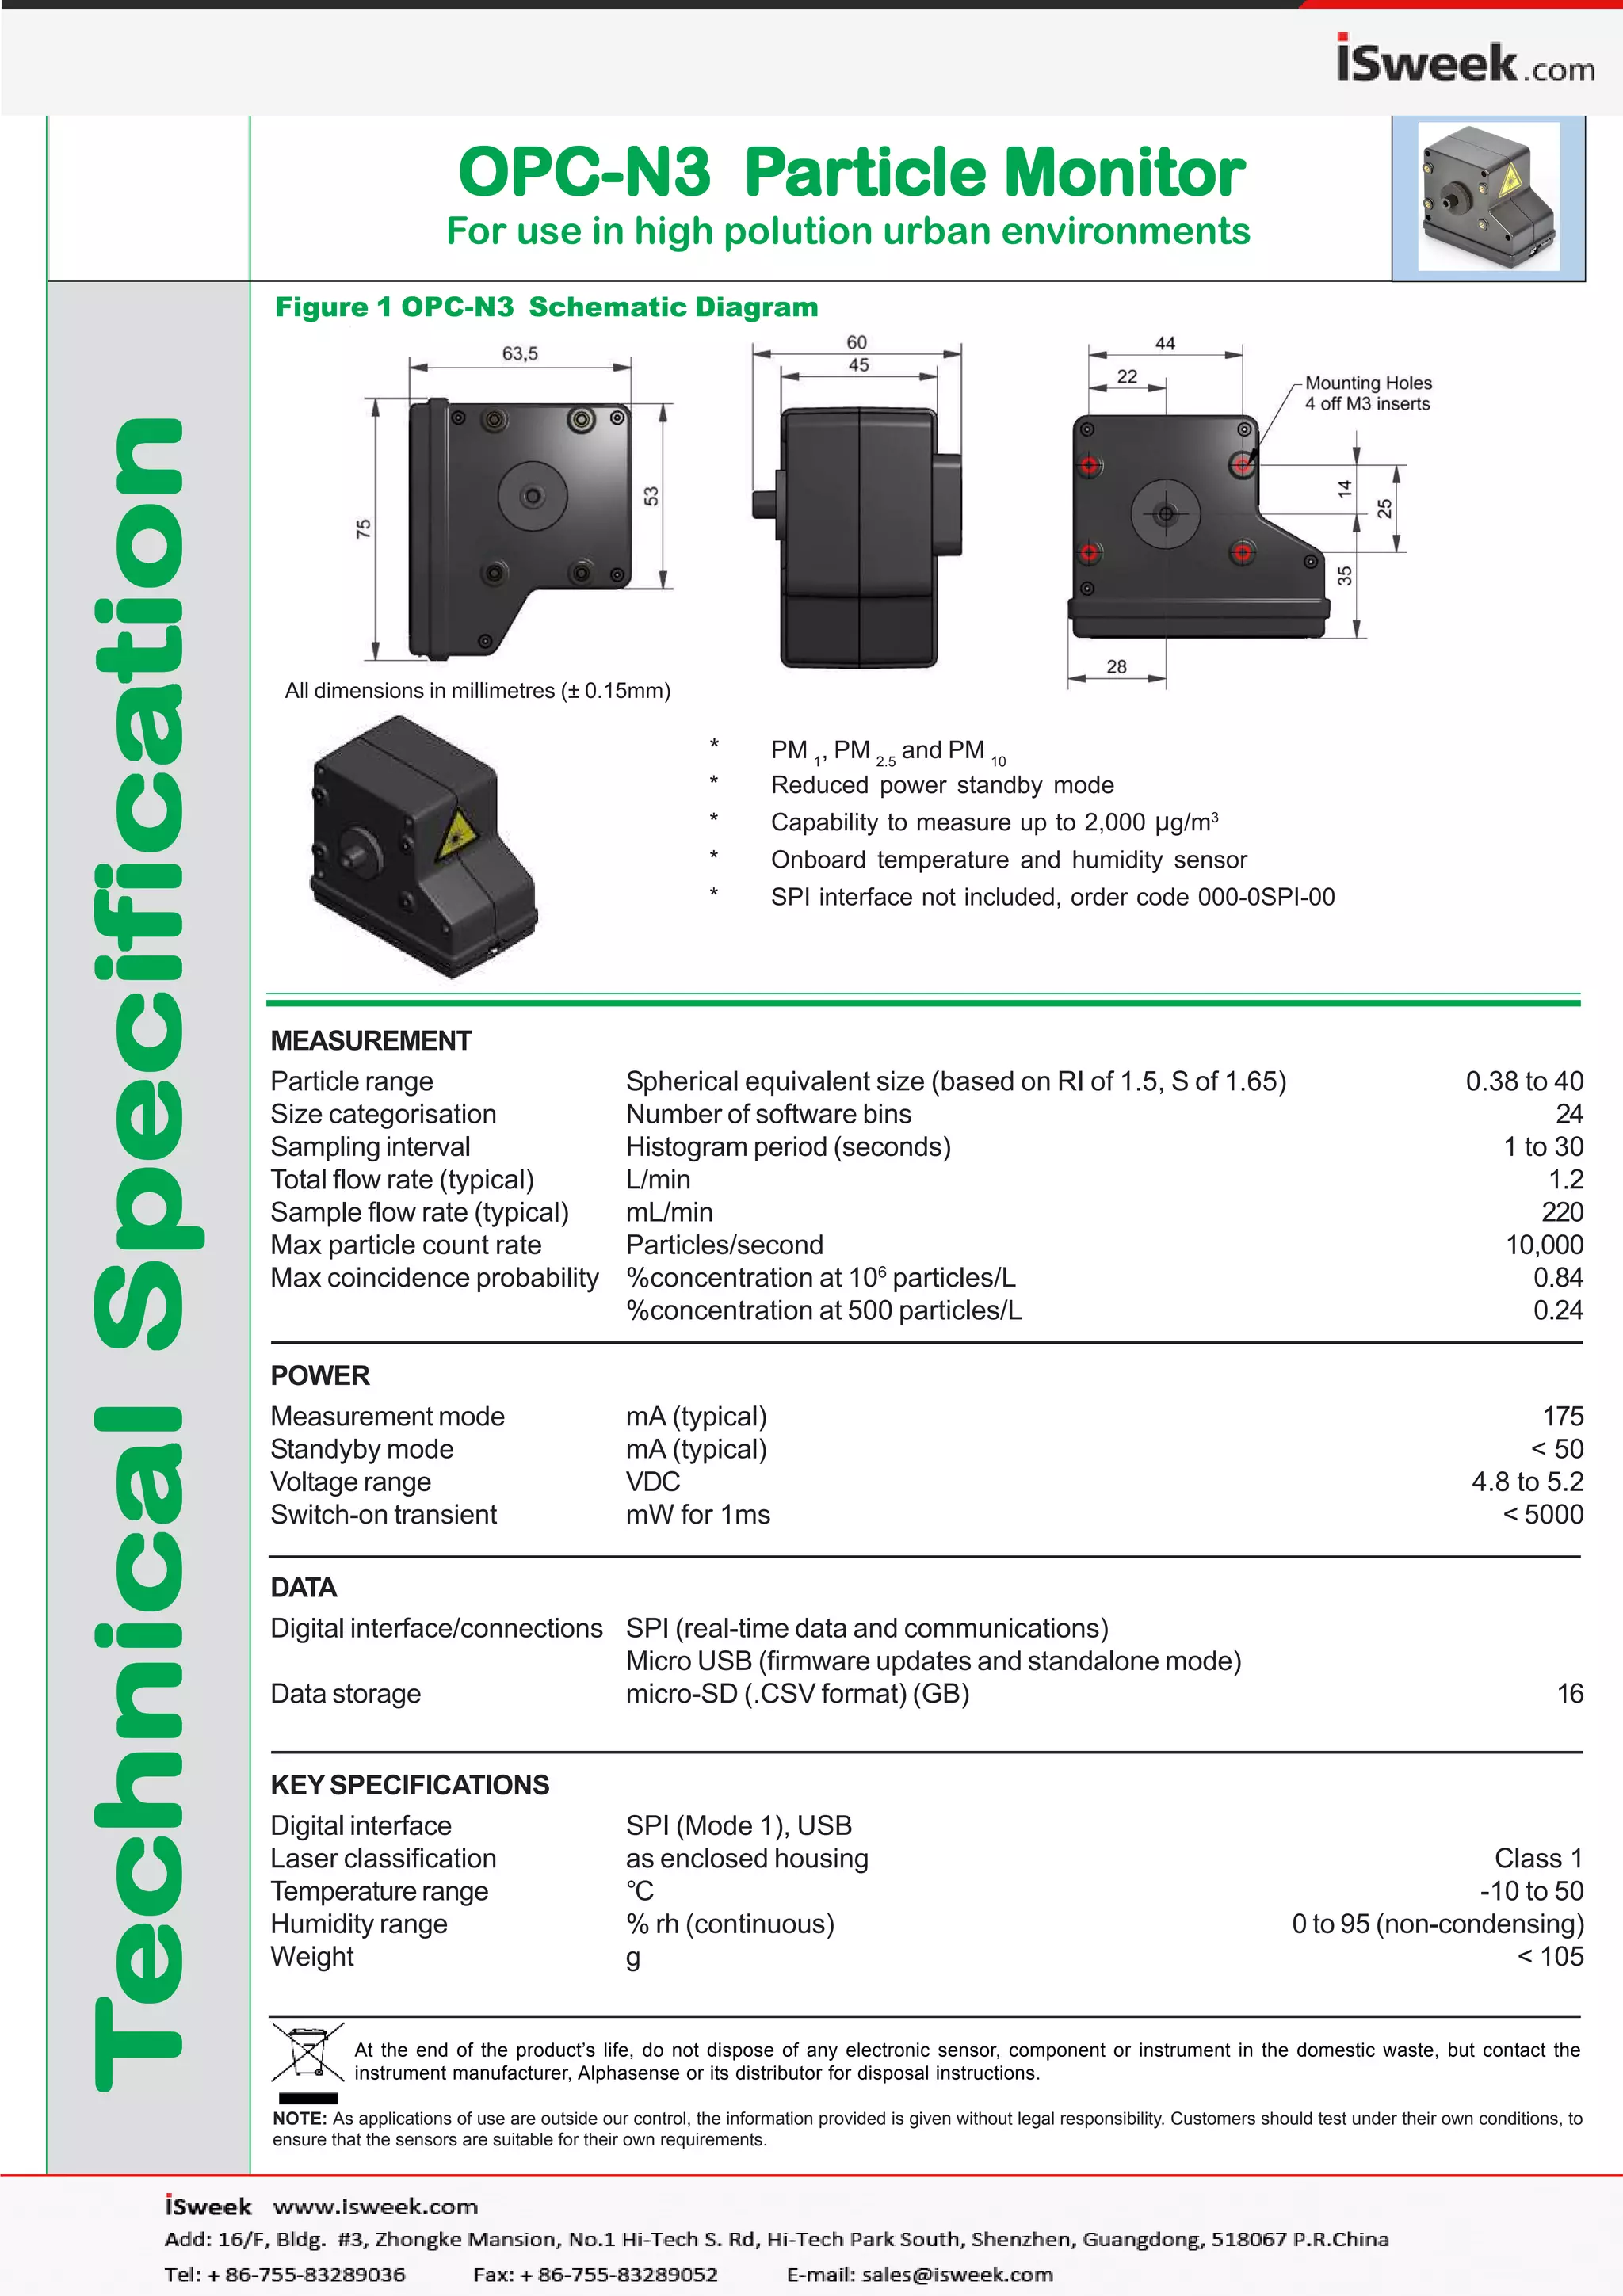

The document provides specifications for the OPC-N3 particle monitor. It measures particle size from 0.38 to 40 micrometers and uses 24 software bins to categorize sizes. The sampling interval can be set from 1 to 30 seconds. It has a maximum particle count rate of 10,000 particles per second and low power standby and measurement modes. Data is stored on a microSD card and transmitted via SPI or USB interfaces. Key features include low power operation, measurement of PM1, PM2.5 and PM10, and an onboard temperature and humidity sensor.


