This document summarizes research investigating the effects of KLOTHO gene variants on brain structure and cognition in children and adolescents. It discusses:
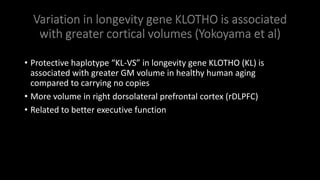
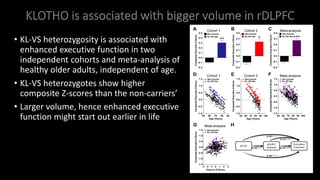
- Prior research finding KLOTHO gene variants are associated with greater brain volume and better executive function in older adults
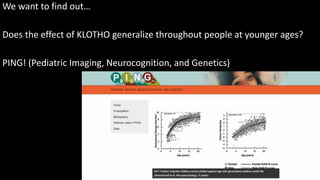
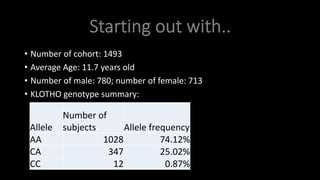
- The current study examines these effects in the PING cohort of 1493 youths aged 11-13 using structural MRI
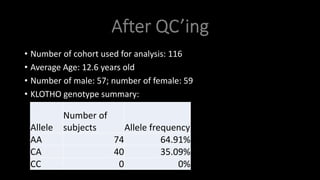
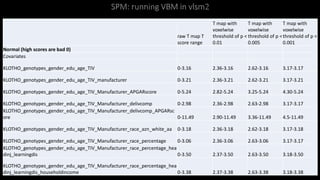
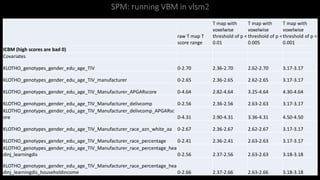
- Preliminary analyses of 116 subjects found no significant differences in brain structure between KLOTHO genotype groups
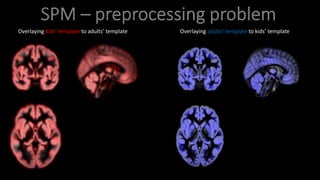
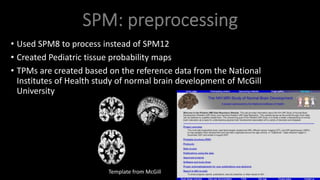
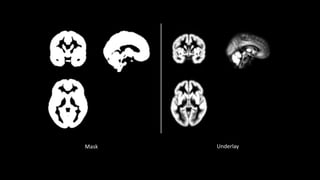
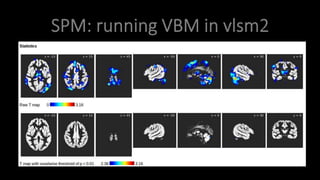
- Technical challenges were encountered due to differences between adult and pediatric brains, which required developing new tissue probability maps and templates for segmentation and normalization
- Future work proposed includes using other modalities beyond MRI and examining additional cognitive and health measures from