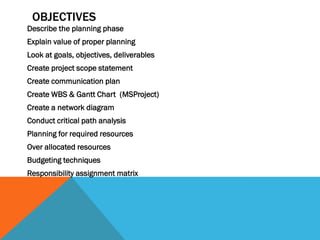
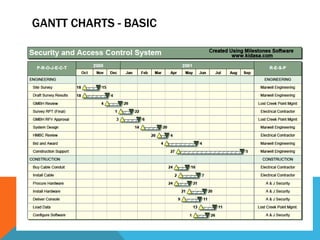
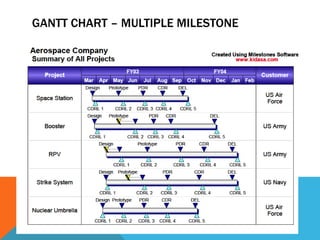
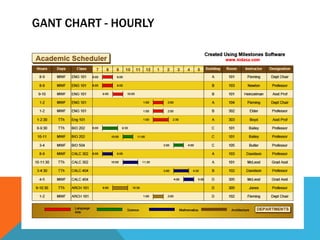
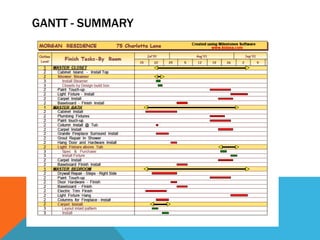
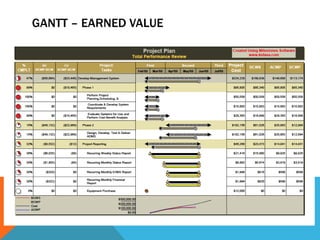
OBJECTIVES
Describe the planning phase
Explain value of proper planning
Look at goals, objectives, deliverables
Create project scope statement
Create communication plan
Create WBS & Gantt Chart (MSProject)
Create a network diagram
Conduct critical path analysis
Planning for required resources
Over allocated resources
Budgeting techniques
Responsibility assignment matrix
INTRODUCTION

This section dedicated to planning of the
project:-

 All about detail
 More effort more likelihood of success
ADDING VALUE VS COST OF CHANGE
Burke (2007):-


PROJECT MANAGERS HAVE GREATEST CHANCE OF ADDING
VALUE AT THE BEGINNING OF A PROJECT


- Cost of change minimised at planning phase because it is a
  “paper” exercise
- Changes later in project involve additional work, wasted
  time and resources


CLASS EXERCISE
Read case study page 83 of manual
GOALS VS OBJECTIVES
OBJECTIVES
Broadly defined objective intentions


GOALS
More detailed, focused aim
USE “SMART” TO DEFINE GOALS
Specific – goals should be clearly defined, when, where


Measurable – quantifiable


Achievable – All parties must agree it is achievable


Realistic – must be physically possible to attain


Time Bound – must be driven by deadlines
“SMART” EXAMPLE
Build a road to Pretoria

Page 85
INDIVIDUAL EXERCISE
 Think of a goal you wish to achieve personally


 Write it down


 Take the goal and write it the smart way


10 minutes
Do individually please!
DELIVERABLES
• Specific, measurable outcomes
• Must be completed for goals to be
  achieved
• SMART criterion can be used to write
  deliverable
• Tangible results are outcome of
  deliverables
• When all deliverables complete project is
  complete
EXAMPLES OF DELIVERABLES
• Obtain result of feasibility study by
  01/08/2011

• Create charter by 02/12/2011

• Finalise construction drawings by
  01/01/2012
ASSUMPTIONS
“……..the act or an instance of accepting without
proof. Arrogance”


• Negative connotations


• Avoidance of responsibilities
PROJECT SCOPE
P87 of manual

• Detailed document
• Contains list of all goals and deliverables
• Used to generate resource and cost
  estimates
• Essential tool for guiding and controlling
  project
• List of exclusions is KEY
COMMUNICATION PLAN
• Usually constructed in table form
• Type of communication and person
  responsible listed
• Type of communication includes: status
  reports, progress reports, forecasts etc.
• Recipients , method and frequency of
  delivery listed

See p88 in manual
WORK BREAKDOWN STRUCTURE
“ …. a      tool used to graphically
  display the deliverables of the
  project in a hierarchical fashion. It
  organises the work of the project in
  logical groupings and displays the
  information in a tree form or an
  outline form”
GANTT CHARTS - BASIC
GANTT CHART – MULTIPLE MILESTONE
GANT CHART - HOURLY
GANTT - SUMMARY
GANTT – EARNED VALUE
NETWORK DIAGRAMS AND CPA
  Network diagrams illustrate graphically the
  relationships between tasks


Number of different methods:-
 • Precedence Diagramming Method
 • Activity on Arrow Method
 • Activity on Node Method
NETWORK DIAGRAM METHOD
• Identify all tasks in a project
• Sequence them
• Present tasks, predecessors and durations in a
  table
• Draw a network
TASKS, PREDECESSORS AND DURATIONS
 Identify tasks with      TASK     PREDECESSOR   DURATION
 no predecessor
                           A            -           2
                           B            A           3

Identify bursts –          C            A           2
tasks sharing a            D            B           1
common
predecessor                E            C           5
                           F            C           4
                           G           E,F          7
Identify merges –
tasks with more            H           D,G          2
than one
                            I           H           4
predecessor


               NO PREDECESSOR THEN MUST BE FIRST TASK
BURSTS
Activity on Node


Precedence Diagramming Method
MERGE
Activity on Node


Precedence Diagramming Method
INDIVIDUAL EXERCISE
1. Identify the Bursts and Merges in the example below
2. Draw a network for the situation using the Precedence Diagramming Method

                     TASK                          PREDECESSOR
                        A                                 -
                       B                                 A
                        C                                A
                       D                                 B,C
                        E                                D
                        F                                E
NETWORK DIAGRAM

 BURST


         B

  A           D           E   F

         C

                  MERGE
NETWORK EXAMPLES

1. Complete the network examples
   worksheet
2. Work individually!
TASK BOX
Precedence Diagramming Method uses task boxes to represent tasks and connectors


                 ES                          EF

                 Early Start                 Early Finish


                FLOAT           TASK       DURATION


                LS                           LF
                Late Start                   Late Finish


   YOU NEED TO MEMORISE THIS – IT WILL NOT BE GIVEN YOU IN EXAM
TASKS, PREDECESSORS AND DURATIONS
          TASK      PREDECESSOR      DURATION
           A               -             2
           B              A              3
           C              A              2
           D              B              1
           E              C              5
           F              C              4
           G              E,F            7
           H              D,G            2
            I             H              4


   Draw a network diagram for this example
   Double-check the tasks against their predecessors
   to make sure it is correct
TASKS
Put task name into diagram


                 ES                    EF

                 Early Start           Early Finish


                FLOAT          TASK   DURATION


                 LS                    LF
                 Late Start            Late Finish
DURATION
 An activities duration will run from the start to
 the finish of the activity.. Time units can be
 expressed in hours, days, weeks, months, shifts
 – whatever is appropriate for the project.

 For simplicity we will always use days as our
 time unit.

   PUT DURATIONS ONTO YOUR DIAGRAM
DURATIONS
Add durations to your network as per the task box convention


                  ES                            EF

                  Early Start                   Early Finish


                 FLOAT            TASK        DURATION


                 LS                             LF
                 Late Start                     Late Finish
CRITICAL PATH
Calculate the critical path by adding up the durations on each path


The longest time is the critical path


Mark the critical path in a different colour on your diagram
FLOAT
   Float is a measure of flexibility or surplus time in an
   activity’s schedule. It indicates how many days an activity
   can be delayed before if affects the project completion
   date


All activities on the critical path have a float of 0


Put this onto your diagram
FLOAT
Add floats to your network as per the task box convention


                  ES                            EF

                  Early Start                   Early Finish


                 FLOAT            TASK         DURATION


                  LS                            LF
                  Late Start                    Late Finish
FLOAT – NON CRITICAL PATH
SECOND LONGEST PATH
Total critical path duration – 2nd longest path duration = 2nd longest path float


PUT THIS ONTO YOUR DIAGRAM


THIRD LONGEST PATH
Total critical path duration – 3rdlongest path duration = 3rd longest path float


PUT THIS ONTO YOUR DIAGRAM
When a task is part of more than 1 path the smallest number is always selected for
   the float
EARLY START
  Early start is the earliest date by which an
  activity can start assuming all of the preceding
  activities are completed as planned


ES = ES preceding task + duration preceding task

PUT THIS ONTO YOUR DIAGRAM
EARLY START
Add EARLY STARTS to your network as per the task box convention


                 ES                           EF

                 Early Start                  Early Finish


                FLOAT           TASK        DURATION


                 LS                           LF
                 Late Start                   Late Finish
EARLY FINISH
 Early finish is the earliest date by which an
 activity can be completed assuming all of the
 preceding activities are completed as planned


               EF = ES + Duration -1


       PUT THIS ONTO YOUR DIAGRAM
EARLY FINISH
 Add EARLY STARTS to your network as per the task box convention


                  ES                           EF

                  Early Start                  Early Finish


                 FLOAT           TASK        DURATION


                  LS                           LF
                  Late Start                   Late Finish


Make sure that the last tasks EF = critical path duration. If not you have made an
error
LATE START
 Late start is the latest date an activity can finish
 to meet the planned completion date


                LS = ES + FLOAT


         PUT THIS ON YOUR DIAGRAM
LATE START
Add LATE STARTS to your network as per the task box convention


                 ES                           EF

                 Early Start                  Early Finish


                FLOAT            TASK        DURATION


                  LS                          LF

                  Late Start                  Late Finish
LATE FINISH
  Late finish is the latest date an activity can finish to
  meet the planned completion date


                     LF = EF + FLOAT


              PUT THIS ON YOUR DIAGRAM
LATE FINISH
Add LATE FINISHES to your network as per the task box convention


                 ES                           EF

                 Early Start                  Early Finish


                FLOAT            TASK        DURATION


                  LS                          LF

                  Late Start                  Late Finish


   Check the late finishes at merges. The merging tasks should have same
   LF otherwise there is an error
SUMMARY CPA

 ES       EF

 F    T   D    EF = ES + D – 1
 LS       LF   LS = ES + F
               ES = ES PRECEDING TASK + D PRECEDING TASK
               LF = EF + F
               F = LS –ES OR         LF-EF
               ES 1ST TASK =1
               F CRITICAL PATH = 0
               F ON MORE THAN 1 PATH SMALLEST SELECTED
               ES FROM MERGED TASKS SELECT HIGHEST ONE
CPA EXERCISES
 PREPARE CPA FOR EACH OF THE EXAMPLES ON THE
 NETWORK EXAMPLE SHEET
 WORK INDIVIDUALLY
IMPLICATION TO THE CRITICAL PATH
• When float is used up critical path may change
• Tasks on critical path have zero float, therefore a
  task with no float left will fall on critical path
• This tells us that there may be more than one
  critical path AND the critical path is subject to
  change
• Float in a task box represents float for entire path. If
  a task is delayed, all the succeeding tasks will also
  be delayed and their float days will be reduced
PLANNING FOR REQUIRED RESOURCES

MsProject

Page 107 manual
BUDGETING TECHNIQUES

• Carefully controlled budget good
  indication of projects financial state
• Senior management VERY unhappy with
  poor budget control
RESPONSIBILITY ASSIGNMENT MATRIX

- ENSURES EVERYONE KNOWS WHO IS
  RESPONSIBLE
- ENABLES PROJECT MANAGER TO
  KEEP TRACK OF DUTIES AND
  LIABILITIES EVERYONE KNOWS WHO IS
  RESPONSIBLE
- Page 114 of manual
RISK MANAGEMENT
DEFINITION:risk:-

A CHANCE OR POSSIBILITY OF
 DANGER, LOSS, INJURY ETC
SOURCES OF RISK
Can come from internal or external sources
External – risks originate from macro –
  environment, includes political and legal issues
Internal - risks come from the project or from
   within the organisation, workforce problems,
   inadequate resources and outdated
   technologies
RISK ELEMENTS
Risks are analysed according to two variables:


PROBABILITY – measured by a %
100% - sure thing
0% - impossible to happen
70% - likely to happen
30% - unlikely to happen
After assessing probability need to asses the impact it will have if it happens
IMPACT
CONSTRUCT A RISK MATRIX
See page 116 in manual
RESPONSE TO RISK
See table 3AJ page 117


Avoidance
Mitigation
Transference
Acceptance
RISK MANAGEMENT
Show risk management video
ACCIDENTS AT WORK
Show H&S video
HEALTH & SAFETY AT WORK
Show top 10 photos H&S

Lu3 – the planning phase lectures

  • 2.
    OBJECTIVES Describe the planningphase Explain value of proper planning Look at goals, objectives, deliverables Create project scope statement Create communication plan Create WBS & Gantt Chart (MSProject) Create a network diagram Conduct critical path analysis Planning for required resources Over allocated resources Budgeting techniques Responsibility assignment matrix
  • 3.
    INTRODUCTION This section dedicatedto planning of the project:-  All about detail  More effort more likelihood of success
  • 4.
    ADDING VALUE VSCOST OF CHANGE Burke (2007):- PROJECT MANAGERS HAVE GREATEST CHANCE OF ADDING VALUE AT THE BEGINNING OF A PROJECT - Cost of change minimised at planning phase because it is a “paper” exercise - Changes later in project involve additional work, wasted time and resources CLASS EXERCISE Read case study page 83 of manual
  • 5.
    GOALS VS OBJECTIVES OBJECTIVES Broadlydefined objective intentions GOALS More detailed, focused aim
  • 6.
    USE “SMART” TODEFINE GOALS Specific – goals should be clearly defined, when, where Measurable – quantifiable Achievable – All parties must agree it is achievable Realistic – must be physically possible to attain Time Bound – must be driven by deadlines
  • 7.
    “SMART” EXAMPLE Build aroad to Pretoria Page 85
  • 8.
    INDIVIDUAL EXERCISE  Thinkof a goal you wish to achieve personally  Write it down  Take the goal and write it the smart way 10 minutes Do individually please!
  • 9.
    DELIVERABLES • Specific, measurableoutcomes • Must be completed for goals to be achieved • SMART criterion can be used to write deliverable • Tangible results are outcome of deliverables • When all deliverables complete project is complete
  • 10.
    EXAMPLES OF DELIVERABLES •Obtain result of feasibility study by 01/08/2011 • Create charter by 02/12/2011 • Finalise construction drawings by 01/01/2012
  • 11.
    ASSUMPTIONS “……..the act oran instance of accepting without proof. Arrogance” • Negative connotations • Avoidance of responsibilities
  • 12.
    PROJECT SCOPE P87 ofmanual • Detailed document • Contains list of all goals and deliverables • Used to generate resource and cost estimates • Essential tool for guiding and controlling project • List of exclusions is KEY
  • 13.
    COMMUNICATION PLAN • Usuallyconstructed in table form • Type of communication and person responsible listed • Type of communication includes: status reports, progress reports, forecasts etc. • Recipients , method and frequency of delivery listed See p88 in manual
  • 14.
    WORK BREAKDOWN STRUCTURE “…. a tool used to graphically display the deliverables of the project in a hierarchical fashion. It organises the work of the project in logical groupings and displays the information in a tree form or an outline form”
  • 15.
  • 16.
    GANTT CHART –MULTIPLE MILESTONE
  • 17.
  • 18.
  • 19.
  • 20.
    NETWORK DIAGRAMS ANDCPA Network diagrams illustrate graphically the relationships between tasks Number of different methods:- • Precedence Diagramming Method • Activity on Arrow Method • Activity on Node Method
  • 21.
    NETWORK DIAGRAM METHOD •Identify all tasks in a project • Sequence them • Present tasks, predecessors and durations in a table • Draw a network
  • 22.
    TASKS, PREDECESSORS ANDDURATIONS Identify tasks with TASK PREDECESSOR DURATION no predecessor A - 2 B A 3 Identify bursts – C A 2 tasks sharing a D B 1 common predecessor E C 5 F C 4 G E,F 7 Identify merges – tasks with more H D,G 2 than one I H 4 predecessor NO PREDECESSOR THEN MUST BE FIRST TASK
  • 23.
  • 24.
  • 25.
    INDIVIDUAL EXERCISE 1. Identifythe Bursts and Merges in the example below 2. Draw a network for the situation using the Precedence Diagramming Method TASK PREDECESSOR A - B A C A D B,C E D F E
  • 26.
    NETWORK DIAGRAM BURST B A D E F C MERGE
  • 27.
    NETWORK EXAMPLES 1. Completethe network examples worksheet 2. Work individually!
  • 28.
    TASK BOX Precedence DiagrammingMethod uses task boxes to represent tasks and connectors ES EF Early Start Early Finish FLOAT TASK DURATION LS LF Late Start Late Finish YOU NEED TO MEMORISE THIS – IT WILL NOT BE GIVEN YOU IN EXAM
  • 29.
    TASKS, PREDECESSORS ANDDURATIONS TASK PREDECESSOR DURATION A - 2 B A 3 C A 2 D B 1 E C 5 F C 4 G E,F 7 H D,G 2 I H 4 Draw a network diagram for this example Double-check the tasks against their predecessors to make sure it is correct
  • 30.
    TASKS Put task nameinto diagram ES EF Early Start Early Finish FLOAT TASK DURATION LS LF Late Start Late Finish
  • 31.
    DURATION An activitiesduration will run from the start to the finish of the activity.. Time units can be expressed in hours, days, weeks, months, shifts – whatever is appropriate for the project. For simplicity we will always use days as our time unit. PUT DURATIONS ONTO YOUR DIAGRAM
  • 32.
    DURATIONS Add durations toyour network as per the task box convention ES EF Early Start Early Finish FLOAT TASK DURATION LS LF Late Start Late Finish
  • 33.
    CRITICAL PATH Calculate thecritical path by adding up the durations on each path The longest time is the critical path Mark the critical path in a different colour on your diagram
  • 34.
    FLOAT Float is a measure of flexibility or surplus time in an activity’s schedule. It indicates how many days an activity can be delayed before if affects the project completion date All activities on the critical path have a float of 0 Put this onto your diagram
  • 35.
    FLOAT Add floats toyour network as per the task box convention ES EF Early Start Early Finish FLOAT TASK DURATION LS LF Late Start Late Finish
  • 36.
    FLOAT – NONCRITICAL PATH SECOND LONGEST PATH Total critical path duration – 2nd longest path duration = 2nd longest path float PUT THIS ONTO YOUR DIAGRAM THIRD LONGEST PATH Total critical path duration – 3rdlongest path duration = 3rd longest path float PUT THIS ONTO YOUR DIAGRAM When a task is part of more than 1 path the smallest number is always selected for the float
  • 37.
    EARLY START Early start is the earliest date by which an activity can start assuming all of the preceding activities are completed as planned ES = ES preceding task + duration preceding task PUT THIS ONTO YOUR DIAGRAM
  • 38.
    EARLY START Add EARLYSTARTS to your network as per the task box convention ES EF Early Start Early Finish FLOAT TASK DURATION LS LF Late Start Late Finish
  • 39.
    EARLY FINISH Earlyfinish is the earliest date by which an activity can be completed assuming all of the preceding activities are completed as planned EF = ES + Duration -1 PUT THIS ONTO YOUR DIAGRAM
  • 40.
    EARLY FINISH AddEARLY STARTS to your network as per the task box convention ES EF Early Start Early Finish FLOAT TASK DURATION LS LF Late Start Late Finish Make sure that the last tasks EF = critical path duration. If not you have made an error
  • 41.
    LATE START Latestart is the latest date an activity can finish to meet the planned completion date LS = ES + FLOAT PUT THIS ON YOUR DIAGRAM
  • 42.
    LATE START Add LATESTARTS to your network as per the task box convention ES EF Early Start Early Finish FLOAT TASK DURATION LS LF Late Start Late Finish
  • 43.
    LATE FINISH Late finish is the latest date an activity can finish to meet the planned completion date LF = EF + FLOAT PUT THIS ON YOUR DIAGRAM
  • 44.
    LATE FINISH Add LATEFINISHES to your network as per the task box convention ES EF Early Start Early Finish FLOAT TASK DURATION LS LF Late Start Late Finish Check the late finishes at merges. The merging tasks should have same LF otherwise there is an error
  • 45.
    SUMMARY CPA ES EF F T D EF = ES + D – 1 LS LF LS = ES + F ES = ES PRECEDING TASK + D PRECEDING TASK LF = EF + F F = LS –ES OR LF-EF ES 1ST TASK =1 F CRITICAL PATH = 0 F ON MORE THAN 1 PATH SMALLEST SELECTED ES FROM MERGED TASKS SELECT HIGHEST ONE
  • 46.
    CPA EXERCISES PREPARECPA FOR EACH OF THE EXAMPLES ON THE NETWORK EXAMPLE SHEET WORK INDIVIDUALLY
  • 47.
    IMPLICATION TO THECRITICAL PATH • When float is used up critical path may change • Tasks on critical path have zero float, therefore a task with no float left will fall on critical path • This tells us that there may be more than one critical path AND the critical path is subject to change • Float in a task box represents float for entire path. If a task is delayed, all the succeeding tasks will also be delayed and their float days will be reduced
  • 48.
    PLANNING FOR REQUIREDRESOURCES MsProject Page 107 manual
  • 49.
    BUDGETING TECHNIQUES • Carefullycontrolled budget good indication of projects financial state • Senior management VERY unhappy with poor budget control
  • 50.
    RESPONSIBILITY ASSIGNMENT MATRIX -ENSURES EVERYONE KNOWS WHO IS RESPONSIBLE - ENABLES PROJECT MANAGER TO KEEP TRACK OF DUTIES AND LIABILITIES EVERYONE KNOWS WHO IS RESPONSIBLE - Page 114 of manual
  • 51.
    RISK MANAGEMENT DEFINITION:risk:- A CHANCEOR POSSIBILITY OF DANGER, LOSS, INJURY ETC
  • 52.
    SOURCES OF RISK Cancome from internal or external sources External – risks originate from macro – environment, includes political and legal issues Internal - risks come from the project or from within the organisation, workforce problems, inadequate resources and outdated technologies
  • 53.
    RISK ELEMENTS Risks areanalysed according to two variables: PROBABILITY – measured by a % 100% - sure thing 0% - impossible to happen 70% - likely to happen 30% - unlikely to happen After assessing probability need to asses the impact it will have if it happens IMPACT
  • 54.
    CONSTRUCT A RISKMATRIX See page 116 in manual
  • 55.
    RESPONSE TO RISK Seetable 3AJ page 117 Avoidance Mitigation Transference Acceptance
  • 56.
    RISK MANAGEMENT Show riskmanagement video
  • 57.
  • 58.
    HEALTH & SAFETYAT WORK Show top 10 photos H&S