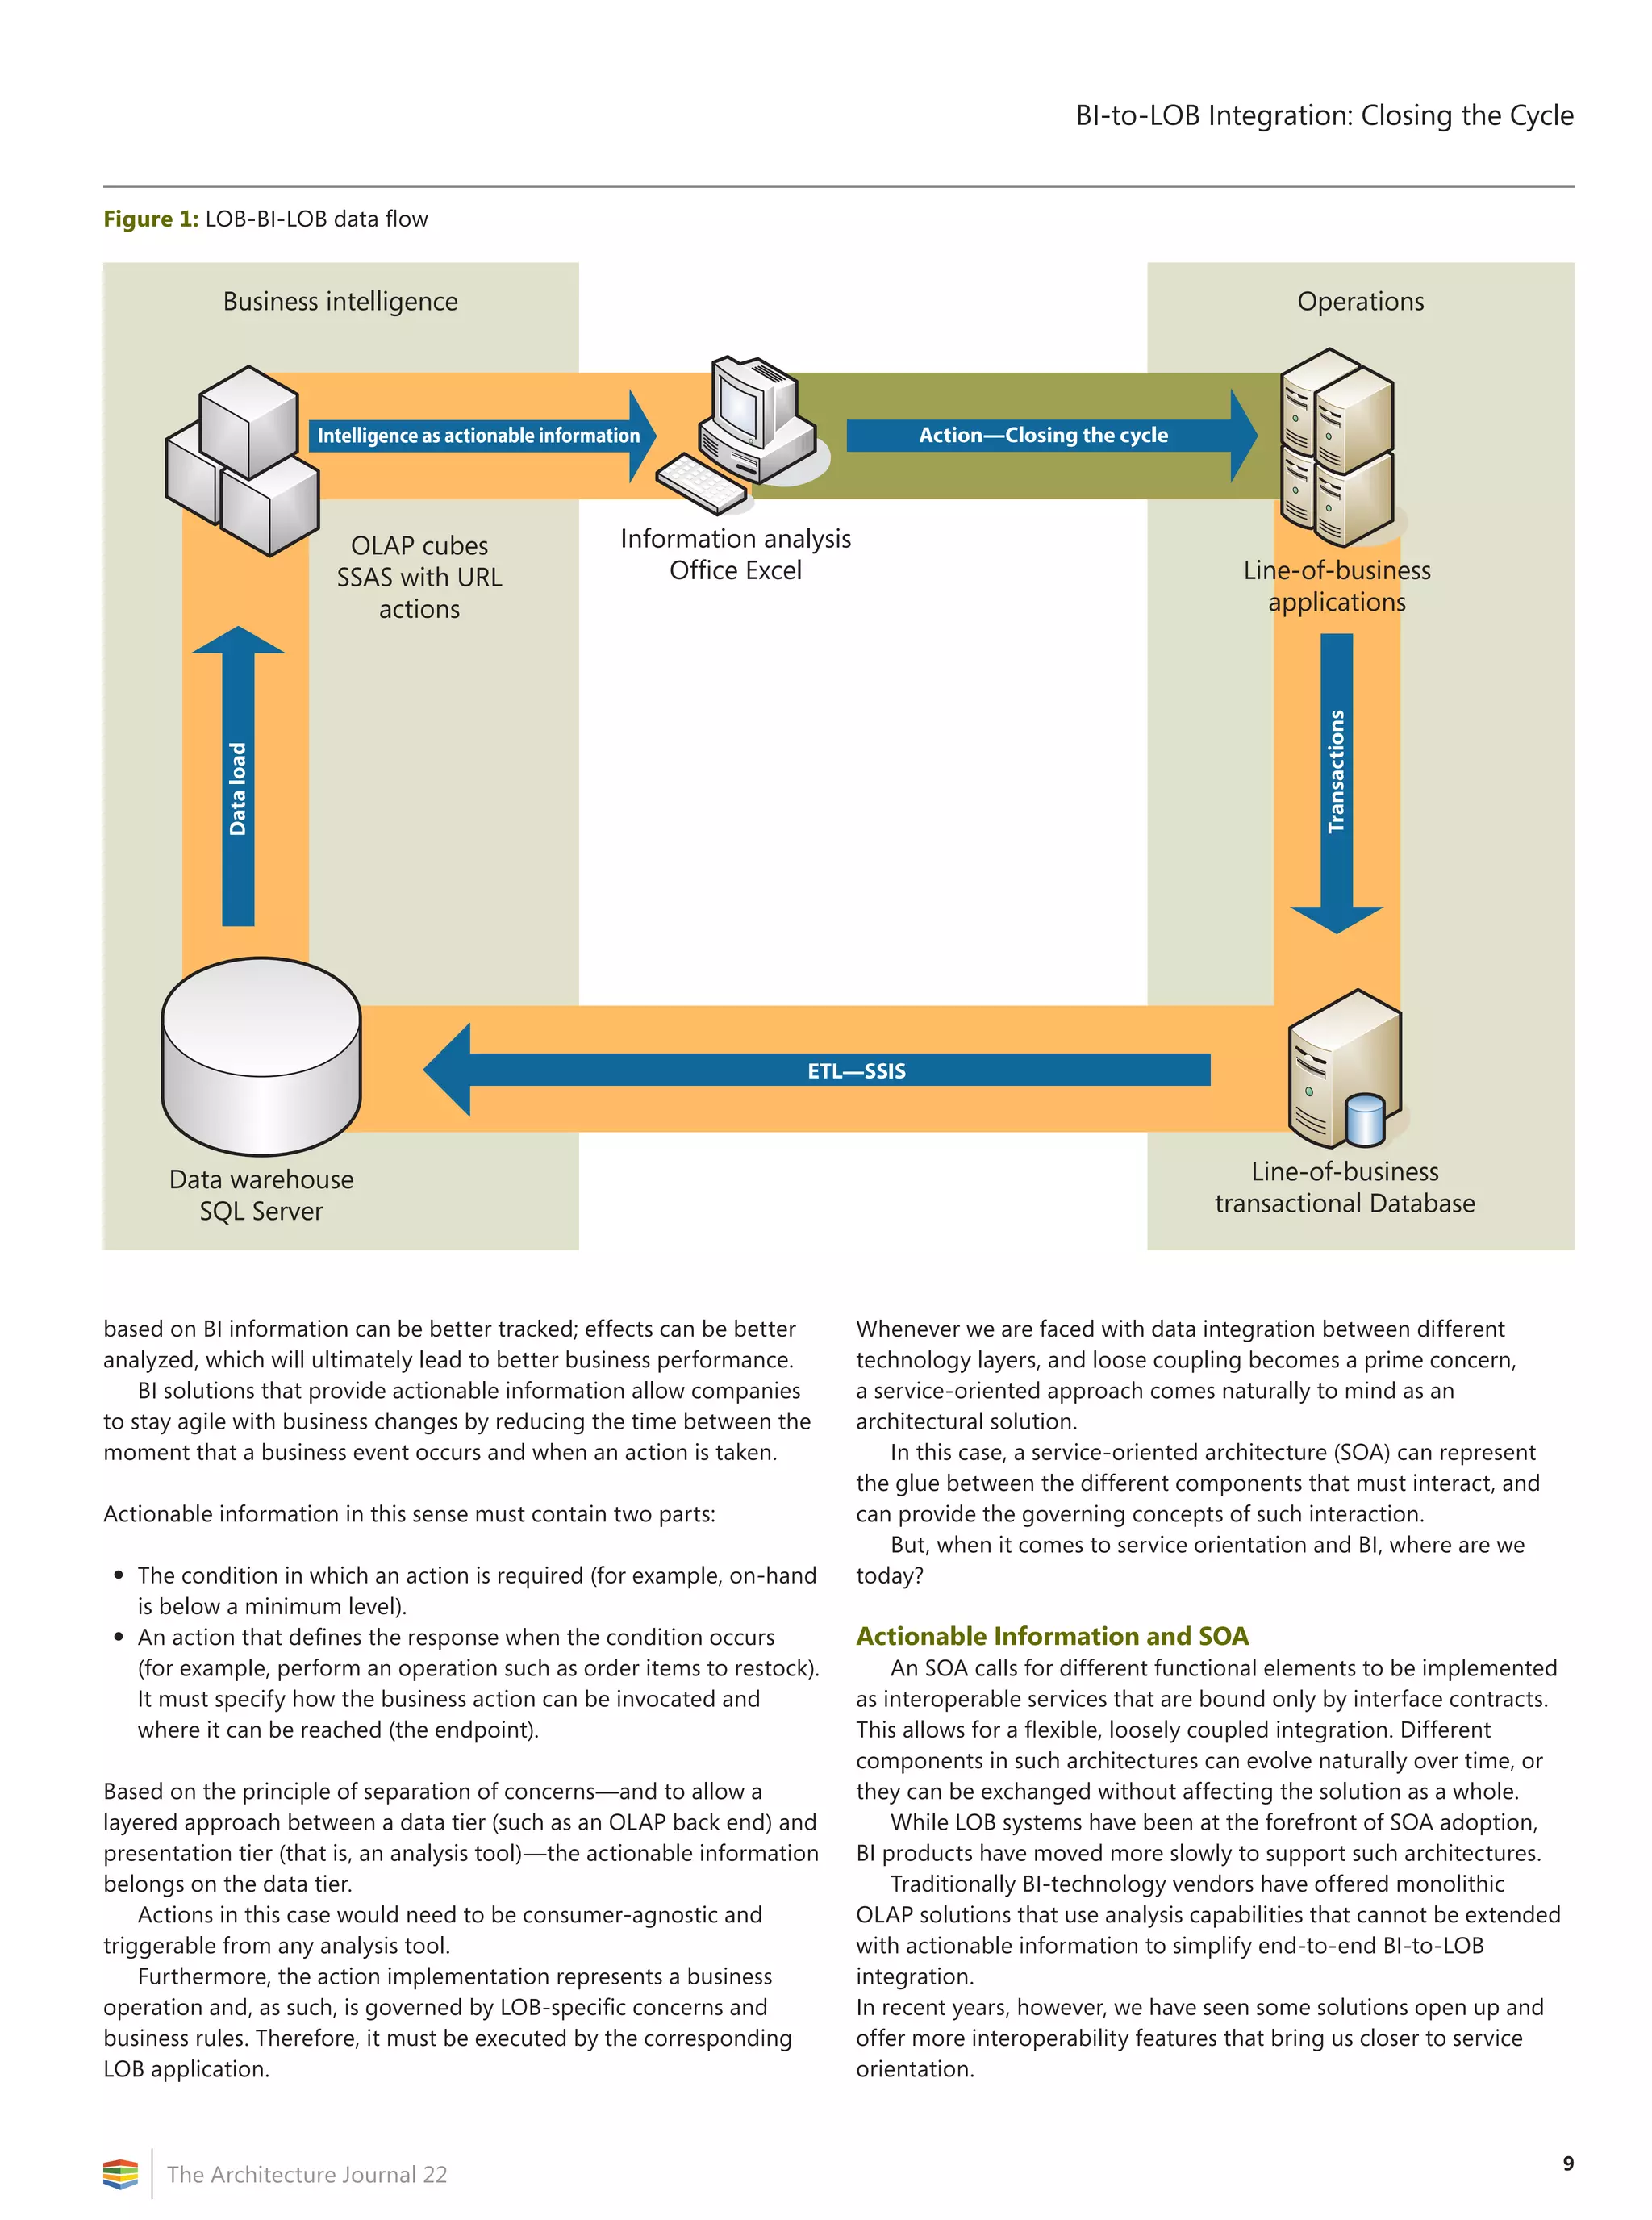
![2
The Architecture Journal 22
Thinking Global BI:
Data‑Warehouse Principles for
Supporting Enterprise-Enabled
Business-Intelligence Applications
by Charles Fichter
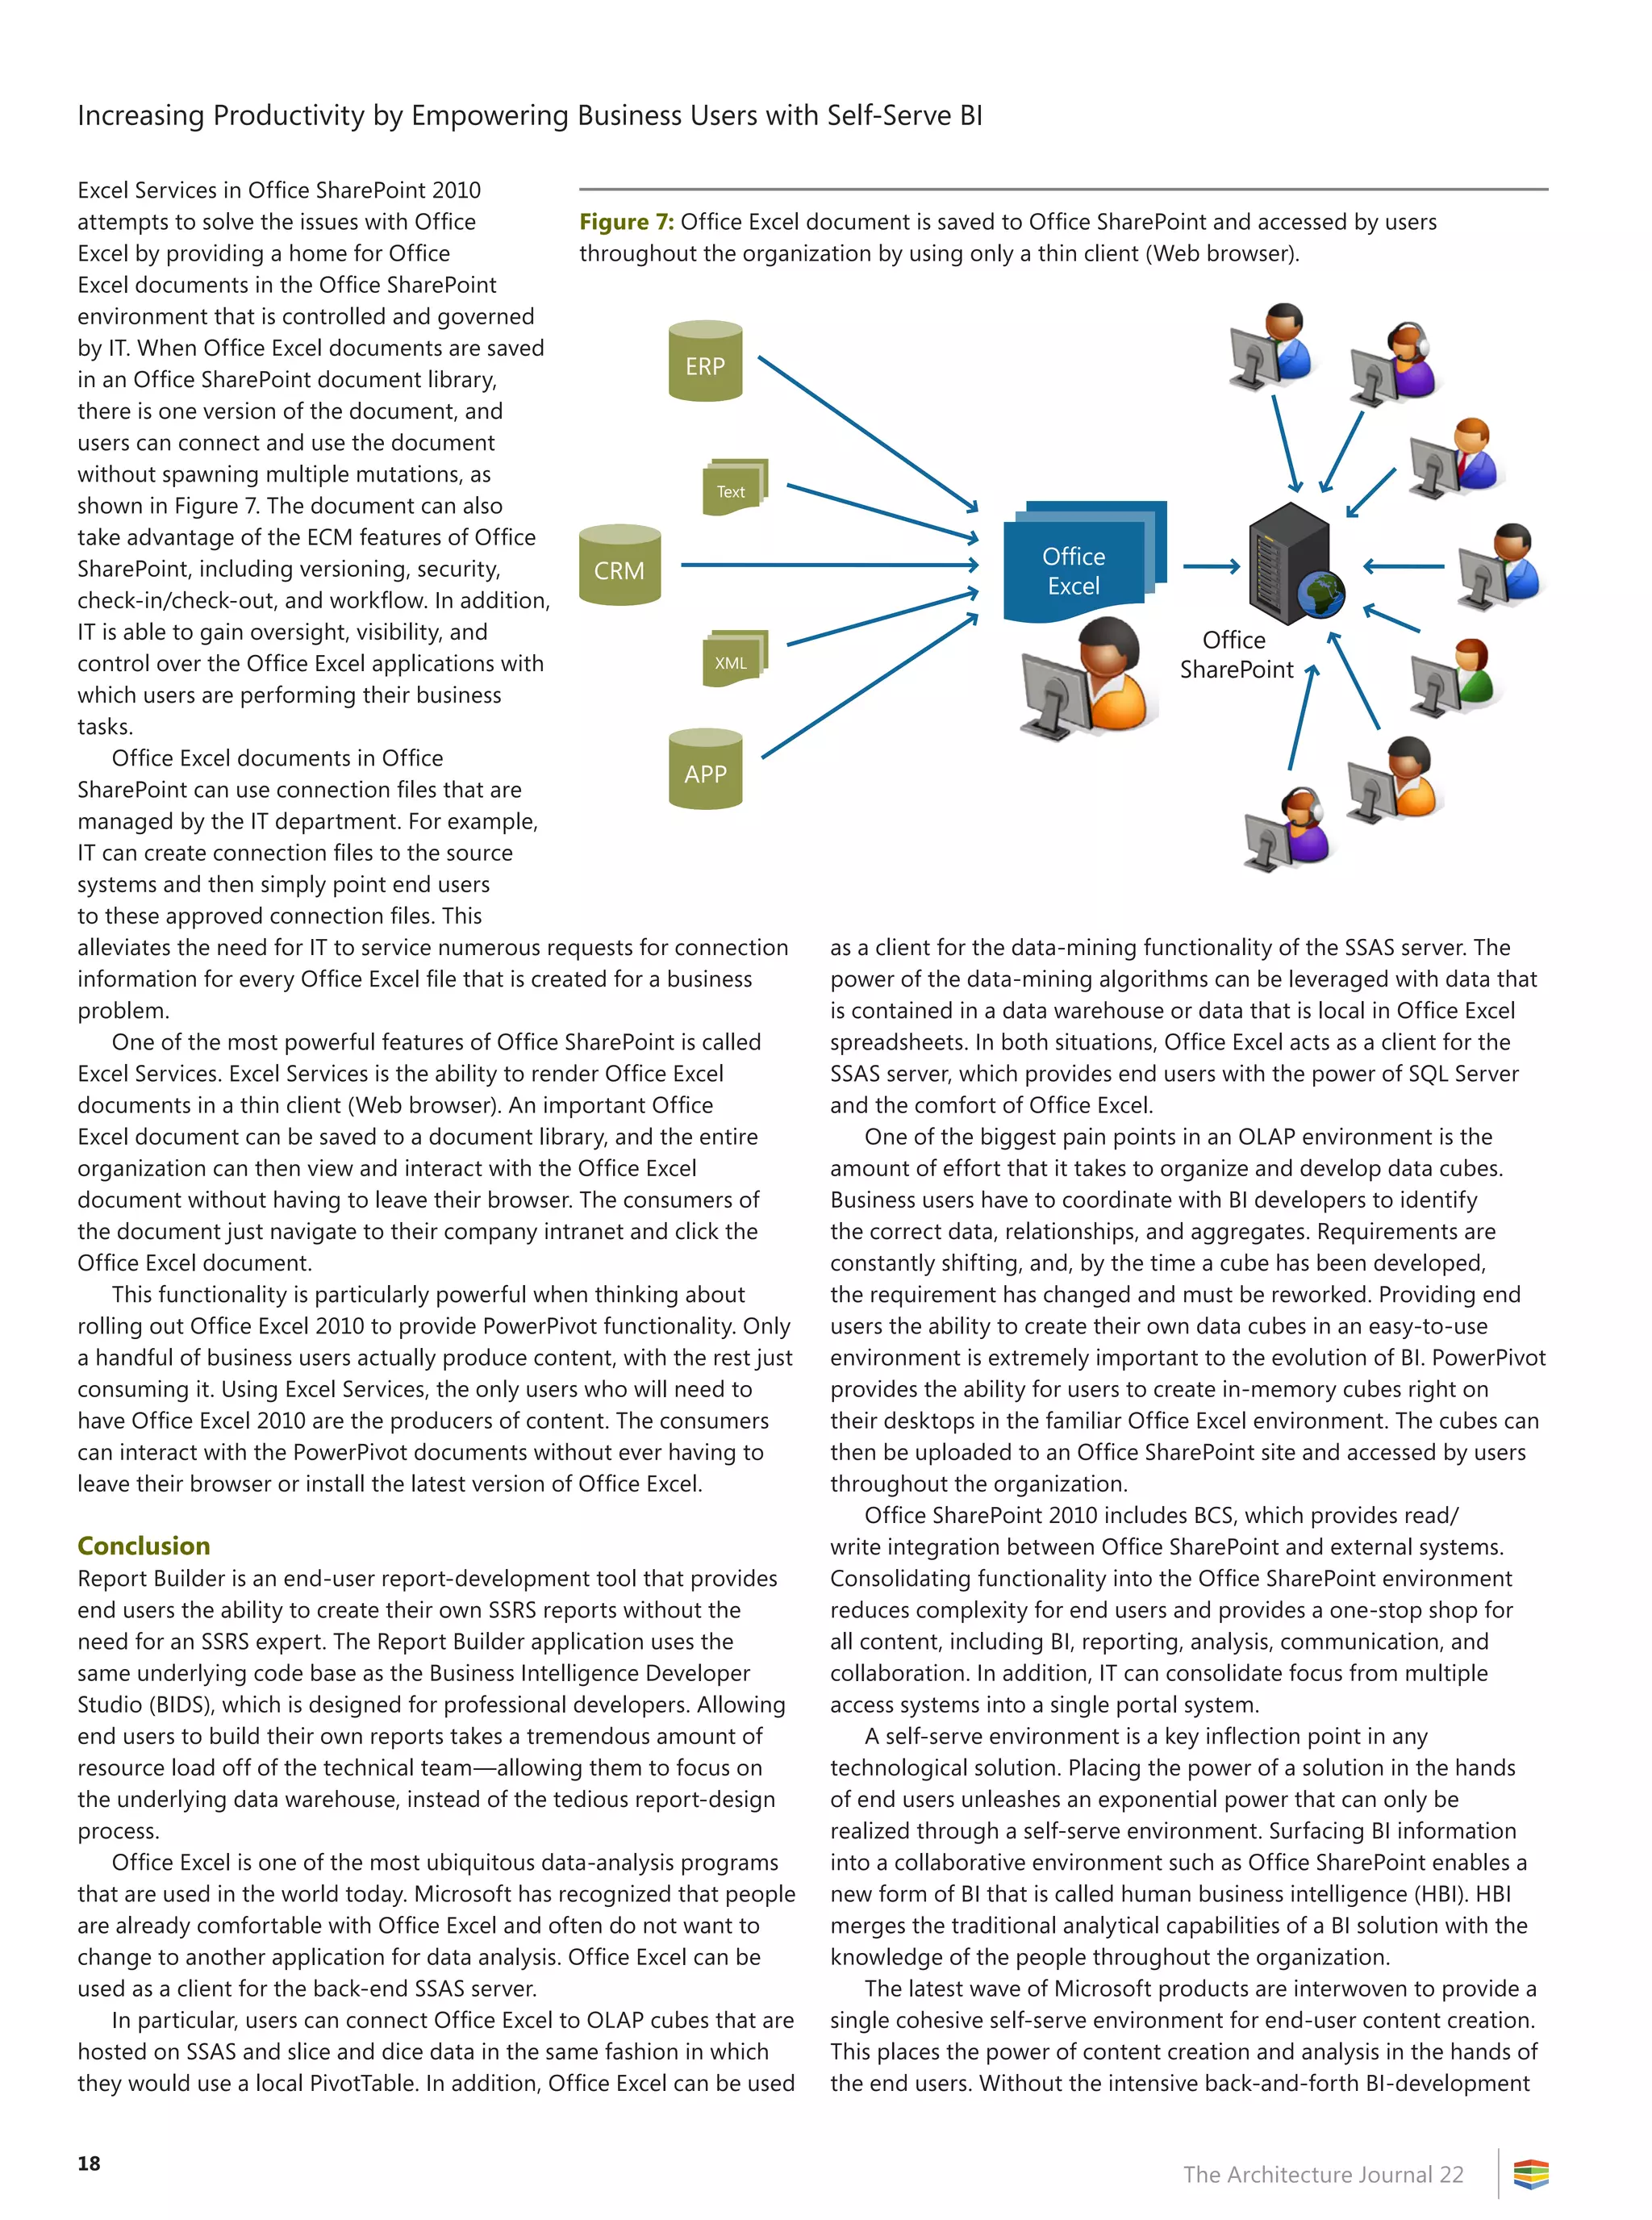
Understanding Isolated Enterprise Data, and Accessing It
Enterprise architects who are looking to aggregate application
data stores into meaningful Multidimensional Online Analytical
Processing (MOLAP) dimensional models are often faced with many
internal obstacles to accessing source data. These obstacles are
often less technical and more business-, legal-, audit-, or security-
sensitive; or overhead is too restrictive, project process, or even
political, as business data can represent “turf” among executives
and divisions. Some of the obstacles are technology constraints such
as noncompatible or proprietary solutions, legacy file formats, and
nonrelational or unstructured data. But as vendor tools (especially
enhancements in Microsoft SQL Server 2008, particularly with
Microsoft SQL Server Integration Services [SSIS] capabilities) and
service oriented–architecture (SOA) technologies advance (for
example, adoption of WS* and other open connectivity standards),
this is becoming far less of an issue.
However, many BI projects are stalled and/or eventually killed
because of a failure by the team to understand accurately what data
was required, and how to access it successfully and make it usable.
Usability is a key concept. How do you take a dozen columns (with
names such as “xtssalescongproc”) and consolidate them in a central
fact table that has readable column names, so that end users can
leverage self-service BI technologies in the future?
The following are a few general tips to help avoid the pitfalls of
navigating access to isolated data:
1. Establish strong executive sponsorship early. The success of
your project will be determined by how deeply and broadly across
enterprise stores you have executive mandate. Asking for access is
merely 1 percent of the effort. You might be incurring significant
time and costs across divisions—often, potentially affecting
their service to customers to grant the analysis, access, and/or
aggregation that you might be asking of them. In addition, does
that division truly understand their own data? How much time
are you asking them to analyze and assess even what data and
capacity they have to provide for you? Do not underestimate the
importance of executive sponsorship or the potential cost of time
and resources that you might be asking across other high-value
data stores and the people who manage them.
2. Does anyone truly know the data? This might seem like an
obvious question; but, as we have done more of these efforts,
it never ceases to surprise how little enterprise customers often
know about their own data. Many ambitious BI projects are halted
quickly, with a realization that first a project team must perform
a full analysis of all enterprise data stores, which can often take
Summary
This article focuses on the design principles to support
a global data-warehouse (DW) architecture, the golden
triumph of any successful business-intelligence (BI)
application story. It draws from the Microsoft Global
independent software-vendor (ISV) partner experience
in designing enterprise BI applications by using
Microsoft platform technologies and contains external
links and references to public content that delves
deeper into the design topics that are covered.
This article assumes that the reader has some basic DW
understanding of a dimensional store, the underlying
fact tables in which columns are known as measures,
dimension tables in which columns are known as
attributes, and how schemas take on star and snowflake
patterns. There are many available resources to provide
this overview; however, if needed, a concise overview
can be found here: http://www.simple-talk.com/sql
/learn-sql-server/sql-server-data-warehouse-cribsheet.
This article focuses also on successful DW project
strategies and advanced topics of effective design for
performance.
Introduction
Architects who are looking to solve enterprise BI solutions are often
enticed by packaged software applications that are able to fulfill
executive requests for effective reports that reveal deep analysis of
business performance. Microsoft and its vast array of ISV partners
have made significant inroads into fulfilling a vision for easing the
burden of generating the BI dashboards that all executives dream
of—providing them with up-to-the-minute results of their business
strategies and the ability to drill down into specific areas. Too often
left unsaid, however, is the larger 90 percent effort that is left to
the supporting architect and IT force behind the glamorous UI:
how to get the data; scrub and aggregate it effectively; and design
appropriate, manageable, and performant dimensional stores,
including ad-hoc query support, remote geography replication,
and even data marts for mobile decision-maker support with ever-
increasing volumes of dimensional data.](https://image.slidesharecdn.com/biarchjournal22-190626013418/75/Performance-Management-How-Technology-is-Changing-the-Game-4-2048.jpg)
![5
Thinking Global BI: Data‑Warehouse Principles for Supporting Enterprise-Enabled Business-Intelligence Applications
The Architecture Journal 22
Phase 3
Build and populate a traditional, independent, centralized DW of
your dreams to reach all of the more ambitious BI needs of your
company. This approach will address the harder BI concerns such as
the ever-elusive BI goldmine, “Predict future results,” which can be
accomplished only by analysis of trends across often voluminous,
company-wide historical data.
While historical trending and data mining can be performed
across geographies (read, utilizing or aggregating further from
Phase 2 [or even Phase 1] repositories), to get the raw reporting
and drilldown-supported dashboard experience against very large,
corporate-wide historical data, a centralized DW implementation
most likely will be the most effective choice. However, many successful
BI projects will likely find a blend between the Phase 2 and Phase 3
approaches.
Designing Effective, Performant,
Maintainable Dimensional Storage
As data warehousing has evolved, what once was a static strategy
of replicating large, read-only stores for reporting has become a far
more dynamic environment in which users are given expansive powers
such as building their own ad-hoc queries, self-service reporting
(using tools such as PowerPivot, previously codenamed “Gemini” and
an extension of Office Excel 2010 that will be available in the first half
of 2010 and enables users to pull down massive dimensional data to
the tune of 100 plus–million rows for real-time, cached pivoting), and
even write-back capabilities directly into the dimensional stores.
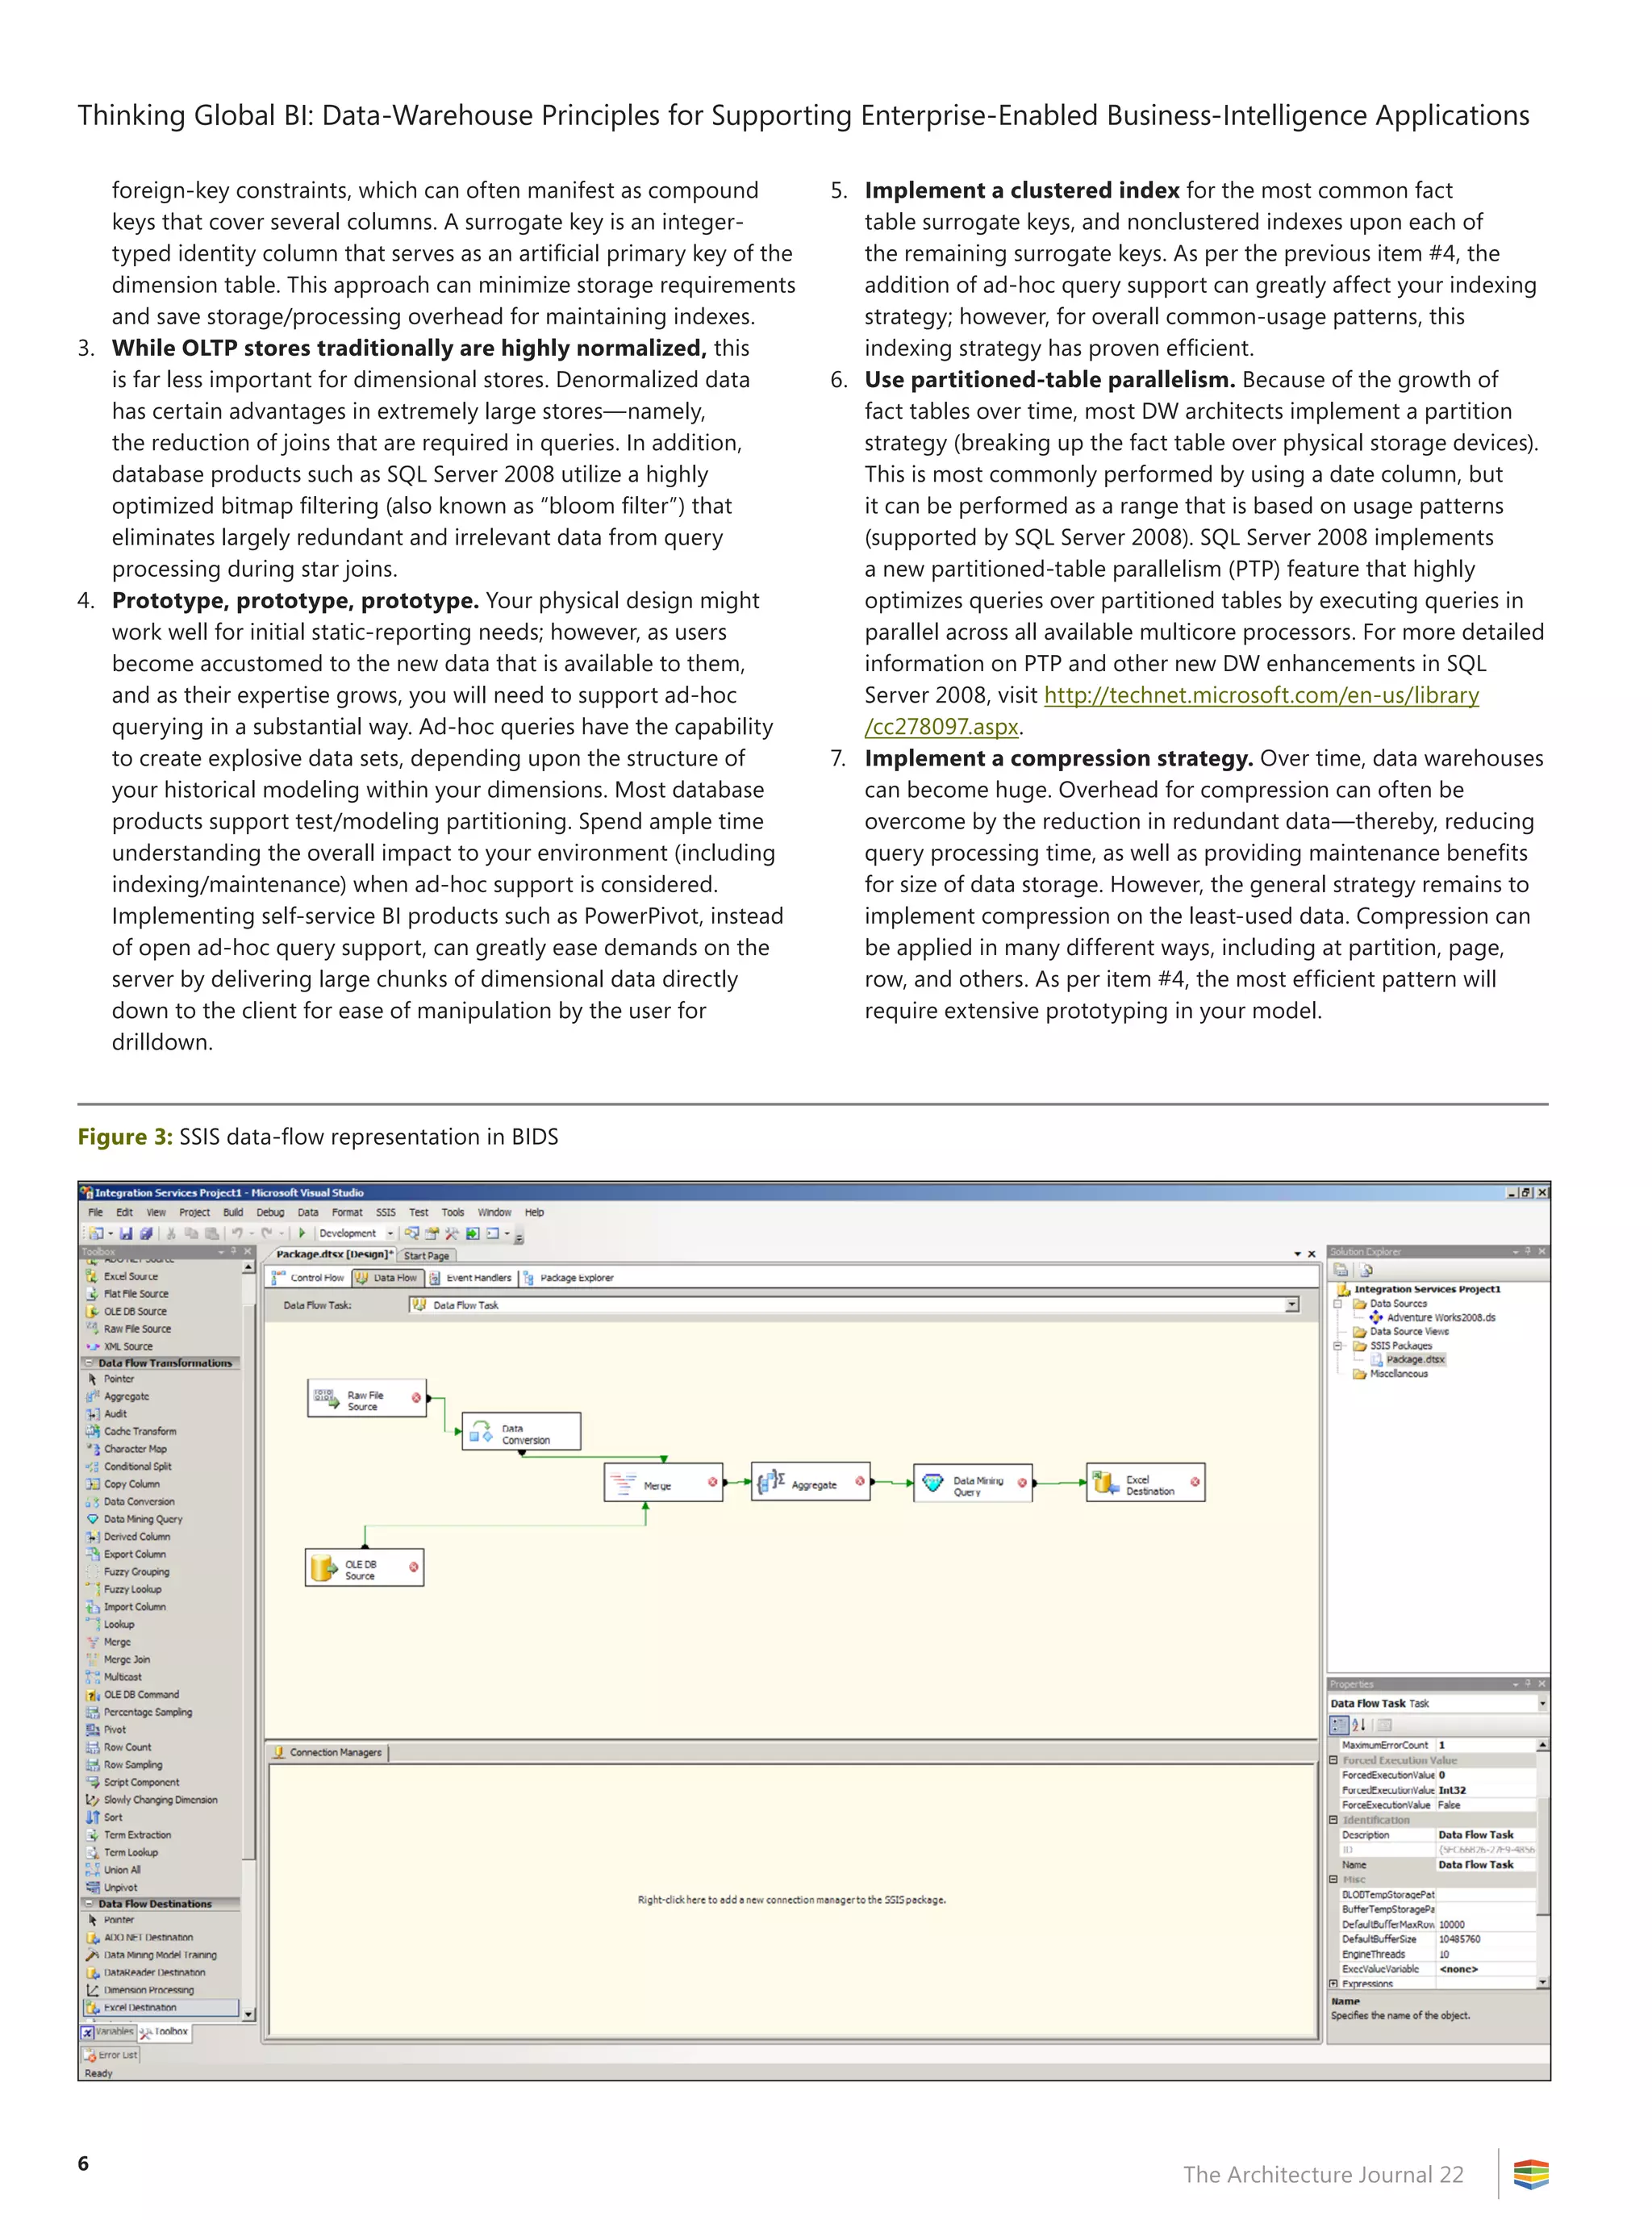
The power of the tools that are available to you at design time
can greatly affect the strength of your models, assist visually with
overcoming the complexity of the relationships, and reveal potential
bottlenecks, poor query structure, and ineffective mining semantics.
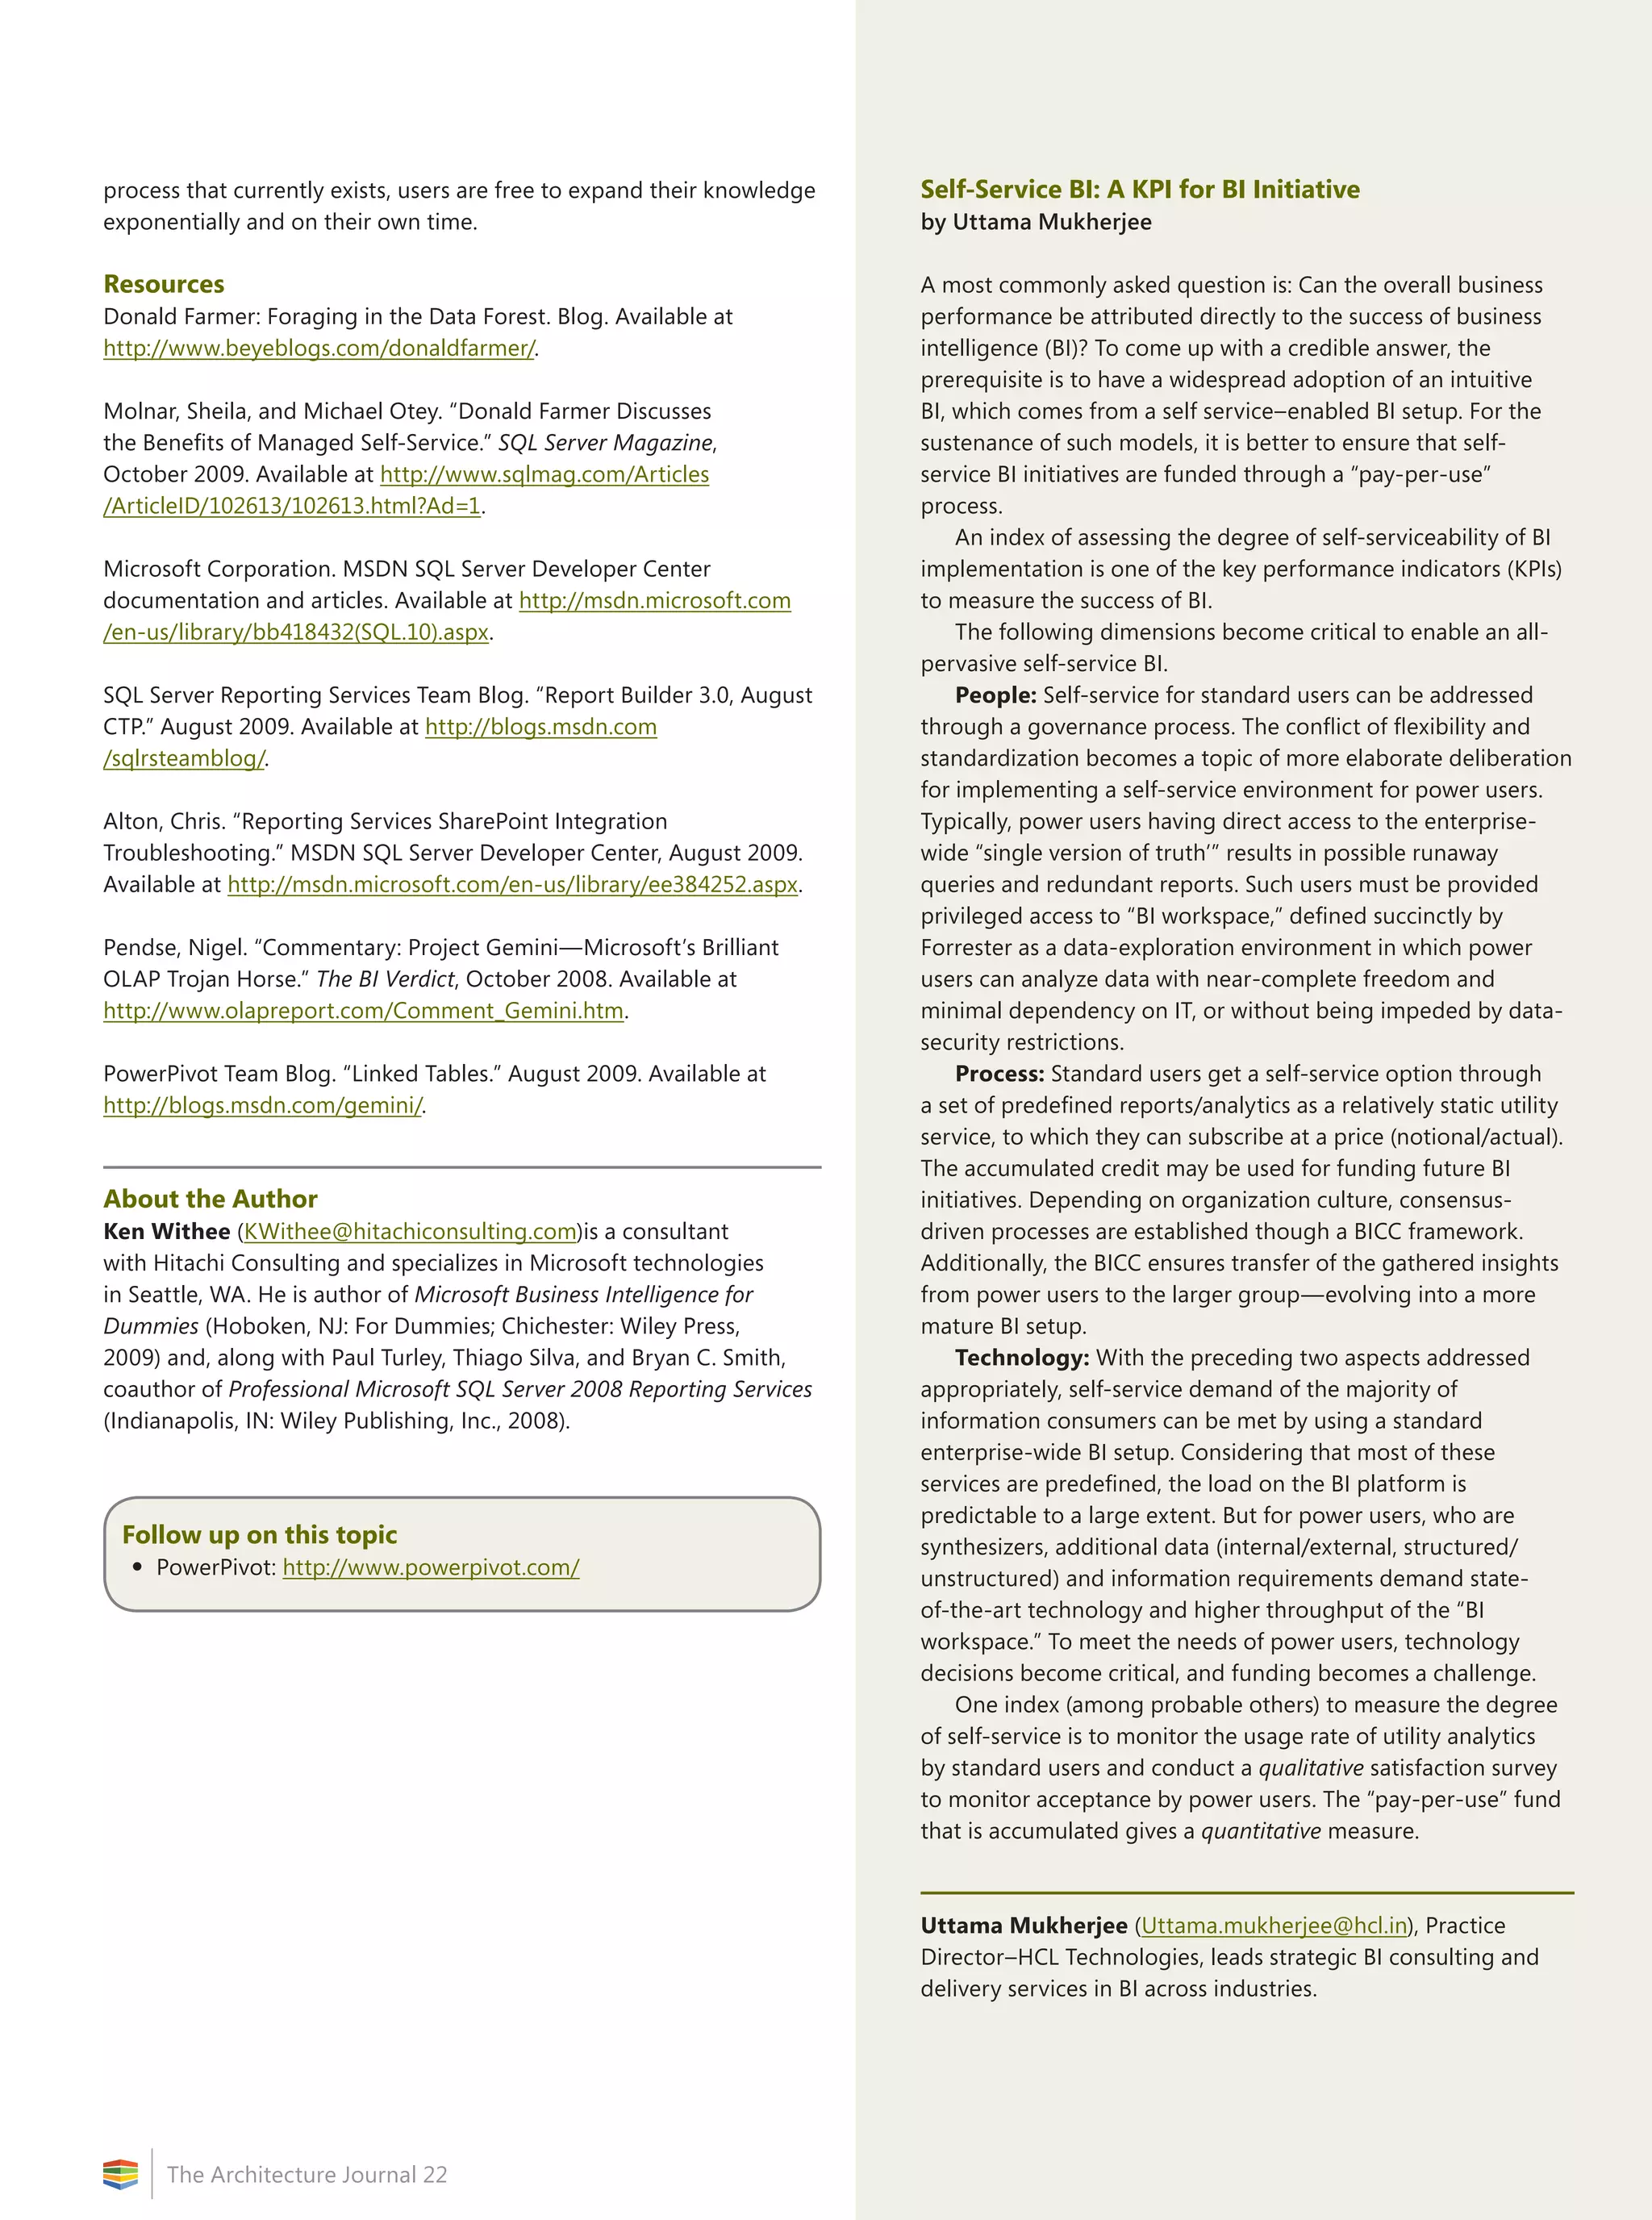
Through the use of the SSAS designer within Business Intelligence
Design Studio (BIDS), the architect is given a comprehensive set of
tools for designing and optimizing dimensional stores and queries
against those stores (see Figure 2).
Listed here are a few key DW principals to remember when you
are designing your dimensional models to maximize performance
later (more comprehensive articles on this subject and advanced
SSAS design can be found at http://technet.microsoft.com
/en-us/magazine/2008.04.dwperformance.aspx and at
http://www.ssas-info.com/analysis-services-papers/1216-sql-server
-2008-white-paper-analysis-services-performance-guide):
1. The overwhelming majority of MOLAP data will grow in your
fact tables. Constrain the number of measures in your fact tables,
as query processing is most effective against narrow-columned
tables. Expand the depth of attributes in the supporting dimension
tables. The benefit of breaking dimension tables into further
subdimension tables, when possible (snowflake pattern), is hotly
debated, although this approach generally gives more flexibility
when one considers scale-out models and utilizing indexing and
performance-enhancing technologies such as partitioning.
2. Implement surrogate keys for maintaining the key relationship
between fact and dimension tables, instead of enforcing
Figure 2: SSAS Designer—Dimensional modeling in BIDS](https://image.slidesharecdn.com/biarchjournal22-190626013418/75/Performance-Management-How-Technology-is-Changing-the-Game-7-2048.jpg)
![BI-to-LOB Integration: Closing the Cycle
The Architecture Journal 22
12
Performance Management:
How Technology Is Changing the Game
by Gustavo Gattass Ayub
Many enterprises have built the capabilities to monitor, analyze, and
plan their businesses. But the problem is that they are delivering
insight into the past, but not into up-to-the-moment performance.
Front-line managers increasingly need to know what’s happening
right now. Individual contributors need to have access to current data
to provide quality service. Retailers and manufacturers are taking
advantage of this to avoid stock-outs or overproduction. Financial-
services, logistics, and utilities companies are using stream-data
processing to increase operational efficiency and create new business
capabilities.
There are clearly three challenges: effective delivery of integrated
data to end users, the ability to process huge volumes of granular
data, and the ability to process data streams.
In-memory processing and 64-bit PCs are changing the way in
which end-users access current integrated data, as it allows them to
build reports, dashboards, and scorecards without the direct support
from IT (also known as self-service business intelligence [BI]). From
the IT perspective, it’s an alternative to delivering insight without the
need of long implementation cycles. The integration of in-memory
processing with business productivity tools such as spreadsheets and
intranet portals is becoming the option of choice to deliver the BI-for-
the masses vision.
Predictive analytics is a top priority in every enterprise profiting
from BI and its potential is directly related to the granularity and
latency of data. Today, in general, there is no big advantage in
working only with sets of aggregated data. The real advantage
comes from processing huge volumes of granular data in near-real-
time. From a technology perspective, there is a new generation of
data-warehouse (DW) appliances that will enable this capability for
organizations that need to predict beyond competition.
Stream-processing technologies allow real-time monitoring
by detecting events or patterns of events as data streams through
transactional systems and networks or from sensors. Complex event-
processing (or CEP) platforms are enabling new applications—varying
from pollution control to algorithmic trading. CEP is becoming a
mandatory capability for any BI platform, as new applications emerge
and also as the real-data integration paradigm might shift in the near
future from the repeatable cycles of the traditional ETL process to the
event-processing paradigm.
Together, these emerging technologies are playing a key role
in enabling some enterprises to evolve from the traditional DW
to modern BI platforms that have arrived to change the game by
providing real-time monitoring and much faster analysis.
Gustavo Gattass Ayub (ggattass@microsoft.com) is a Senior
Consultant at Microsoft Consulting Services Brazil.
Relevant Time-Performance Management
by Usha Venkatasubramanian
Organizations need to make informed business decisions at strategic,
tactical, and operational levels. Decision-support systems were offline
solutions that catered to specific needs. With new trends, there is a
need to cover a larger set of people—right from the CEO, who looks
at a larger timeframe, up to an operations manager, who needs recent
statistics. Therefore, we must build a performance-management
system that delivers information at the relevant time: Relevant
Time‑Performance Management (RTPM).
How can an organization provide self-service capability to the
business, while still maintaining the data recency and granularity?
We implemented a multilayered data warehouse that is both a sink
and a source of information. Data currency was maintained by using
a suitable adapter to poll data (for example, SSIS in the Microsoft BI
suite).
Management Organization-Structure Relevance
Near-real time data was trickle-fed into the lowest layer and reflected
in the output for the operational manager. Data was sourced to higher
levels of managers by creating higher layers of aggregation, and at
predefined time intervals. Granular data got offline-archived for the
future. When data reached the highest level of aggregation, it was
retained for comparative reporting for a longer duration of time.
Information Relevance
Current information requirements that are categorized as primary
data (information source) resided in all layers. Data that is not
required for querying was captured as supplementary data (data
sink). Some data from the secondary layer would move to the primary
layer, if there is a request for additional data. Likewise, a primary data
element would be retired by moving it to the secondary layer.
Data-Nature Relevance
A careful balancing act is needed to control the unwieldy growth
of the data volumes in the data-warehouse database, while still
providing the relevant information. An offline retention policy–based
archive helps maintain the relevant information.
Recency Relevance
Recency of information calls for a proper Change Data Capture
mechanism to be in place for different stakeholders to get what they
need. This would primarily depend on the nature of the source data
itself. Using metadata-driven CDC and normalized CDC, the data is
maintained as recently as required.
Delivery Relevance
Information delivery was a mix of push and pull to maintain the time
relevance. Standard reports were delivered through the push method
and ad-hoc reports through the pull method.
Some of the case studies in which we’ve used these principles
effectively can be seen at the following Web site: http://www.
lntinfotech.com/services/business_analytics/overview.asp.
Usha Venkatasubramanian (usha.v@lntinfotech.com) is the deputy
head of the Business Analytics Practice at LT Infotech.](https://image.slidesharecdn.com/biarchjournal22-190626013418/75/Performance-Management-How-Technology-is-Changing-the-Game-14-2048.jpg)
![27
The Architecture Journal 22
Summary
The authors propose a semantic ontology–driven
enterprise data–model architecture for interoperability,
integration, and adaptability for evolution, by
autonomic agent-driven intelligent design of logical
as well as physical data models in a heterogeneous
distributed enterprise through its life cycle.
An enterprise-standard ontology (in Web Ontology
Language [OWL] and Semantic Web Rule Language
[SWRL]) for data is required to enable an automated
data platform that adds life-cycle activities to the
current Microsoft Enterprise Search and extend
Microsoft SQL Server through various engines for
unstructured data types, as well as many domain types
that are configurable by users through a Semantic-
query optimizer, and using Microsoft Office SharePoint
Server (MOSS) as a content and metadata repository to
tie all these components together.
Introduction
Data models differ in their structural organization to suit various
purposes. For example, product and organization hierarchies yield
well to the hierarchical model, which would not be straightforward
to represent and access in a relational model (see Table 1).
The model is decided by following factors:
1. Ease of representation and understandability of the structure for
the nature of data
2. Flexibility or maintainability of the representation
3. Ease of access and understanding the of retrieval, which involves
the query, navigation, or search steps and language
4. Ease of integration, which is an offshoot of maintainability and
understanding
5. Performance considerations
6. Space considerations
Depending on the requirement—be it a structured exact search
or a similarity-based unstructured, fuzzy search—we can have a
heterogeneous mix of structured, semistructured, and unstructured
information to give the right context to enterprise users.
While the relational database helped with the sharing of data,
metadata sharing itself is a challenge. Here, enterprise ontology
is a candidate solution for metadata integration, and it leverages
such advances for stable Enterprise Information Integration (EII) and
interoperability, in spite of the nebulous nature of an enterprise.
Ontologies are conceptual, sharable, reusable, generic, and
applicable across technical domains. They contain explicit knowledge
that is represented as rules and aids in inference. Also, they improve
communication across heterogeneous, disparate components, tools,
technologies, and stakeholders who are part of a single-domain
enterprise.
Evolution of Enterprise Integration
It is interesting to note the evolution of enterprise integration over
periods of time, when there were simple applications for each specific
task in the past, to the applications on the Web that can communicate
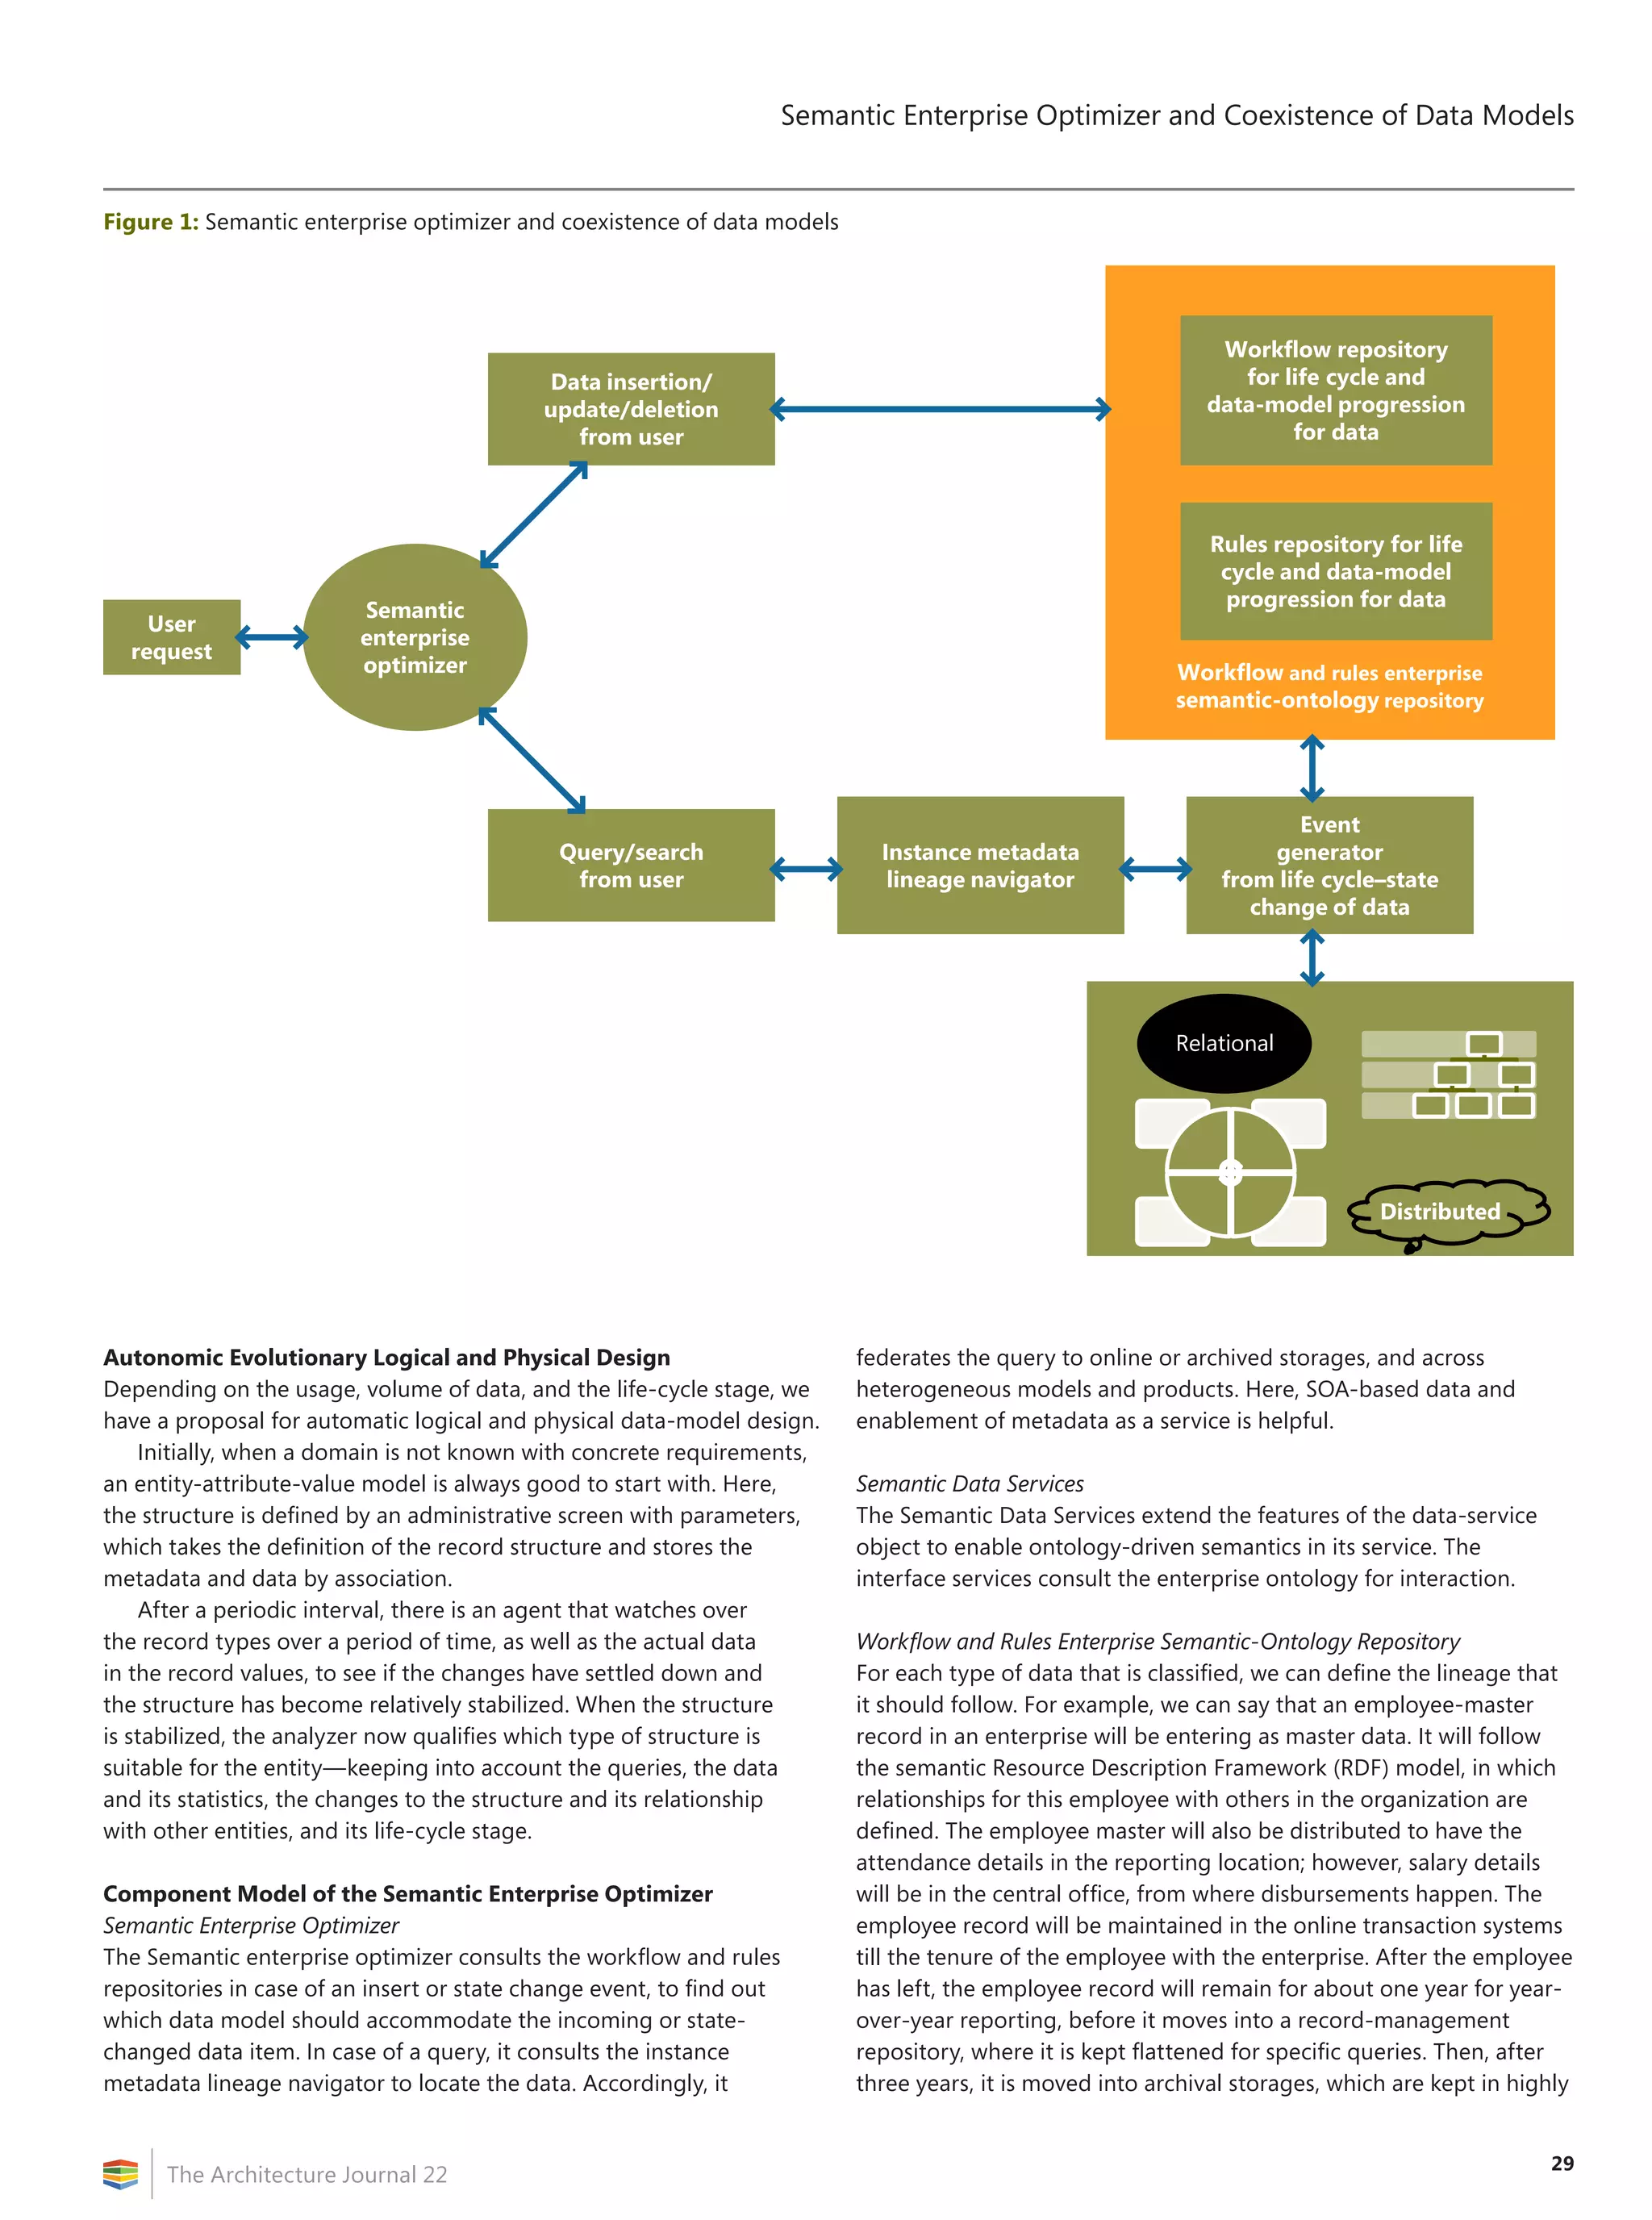
Semantic Enterprise Optimizer and
Coexistence of Data Models
by P. A. Sundararajan, Anupama Nithyanand, and S.V. Subrahmanya
Table 1: Data models for various purposes
Data-model name Purpose
Hierarchical Complex master-data hierarchies (1:M)
Very high schema-to-data ratio
Network Complex master-data relationships (M:M)
Spatial networks, life sciences, chemical
structures, distributed network of
relational tables
Relational Simple flat transactions
Very low schema-to-data ratio
Object Complex master-data relationships, with
nested repeating groups
XML Integration across heterogeneous
components; canonical; extensible
File systems Structured search
Record-oriented Primary-key retrieval—OLTP—sequential
processing
Column-oriented Secondary-key retrieval; analytics;
aggregates; large data volume, requiring
compression
Entity-attribute-value Flexibility; unknown domain; changes
often to the structure; sparse; numerous
types together](https://image.slidesharecdn.com/biarchjournal22-190626013418/75/Performance-Management-How-Technology-is-Changing-the-Game-29-2048.jpg)
![31
Semantic Enterprise Optimizer and Coexistence of Data Models
The Architecture Journal 22
G-SDAM. Grid-Enabled Semantic Data Access Middleware. Available at
http://gsdam.sourceforge.net/ (visited on October 18, 2009).
W3C. “A Semantic Web Primer for Object-Oriented Software
Developers.” Available at http://www.w3.org/TR/sw-oosd-primer/
(visited on October 18, 2009).
Oracle. Oracle Exadata. Available at http://www.oracle.com/database
/exadata.html (visited on October 21, 2009).
About the Authors
P. A. Sundararajan (sundara_rajan@infosys.com) is a Lead in the
Education Research Department with ECOM Research Lab at Infosys
Technologies Ltd. He has nearly 14 years’ experience in application
development and data architecture in Discrete Manufacturing,
Mortgage, and Warranty Domains.
Anupama Nithyanand (anupama_nithyanand@infosys.com) is a
Lead Principal in the Education Research Department at Infosys
Technologies Ltd. She has nearly 20 years’ experience in education,
research, consulting, and people development.
S. V. Subrahmanya (subrahmanyasv@infosys.com) is currently Vice
President at Infosys Technologies Ltd. and heads the ECOM Research
Lab in the Education Research Department at Infosys. He has
authored three books and published several papers in international
conferences. He has nearly 23 years’ experience in the industry and
academics. His specialization is in Software Architecture.
Thinking Global BI: Data-Consistency Strategies for Highly
Distributed Business-Intelligence Applications
by Charles Fichter
The need for centralized data-warehousing (DW) systems to update
and frequently rebuild dimensional stores, and then replicate to
geographies (data marts), can create potential consistency challenges
as data volumes explode. In other words: Does your executive in
Japan see the same business results in near-real time as headquarter
executives in France? Throw in write-back into the dimensional
stores, plus a growing need to support mobile users in an offline
capacity, and suddenly you’ve inherited larger challenges of consistent
business-intelligence (BI) data. Consistent data view across the global
enterprise is a result of DW-performance optimizations that occur at
design time.
Here are some quick tips for thinking global BI:
• Look for optimizations locally first. Seek ways in which to
create and manage Multidimensional Online Analytic Processing
(MOLAP) stores that are close to the users who consume it. You’ll
likely find that 80 percent or more of BI reporting needs are local/
regional in nature. Effective transformation packages (using tools
such as Microsoft SQL Server Integration Services [SSIS]) or even
managing data synchronization directly through application code
for asynch/mobile users (such as Synch Services for ADO.NET) can
often be more flexible than replication partnerships.
• As much as possible, utilize compression and read-only
MOLAP for distribution. Many DW vendors have enabled write-
back capabilities into the MOLAP stores. Use these judiciously, and
minimize them to a smaller subset of stores.
• Minimize fact table columns, and maximize dimension
attributes. The single biggest performance bottleneck in I/O for
building and replicating MOLAP stores is large fact tables that
have excessive column size. Large columns (attributes) within the
associated dimension tables can be processed far more efficiently.
Extending dimension tables to a snowflake pattern (further
subordinating dimension tables) for extremely large DW sizes can
further increase efficiencies, as you can utilize partitioning across
tables and other database features to increase performance.
• If centralized DW, consider lightweight access (browser).
Utilizing tools such as SQL Server Report Builder, architects can
provide summary data by designing a set of fixed-format reports
that are accessible via a browser from a Reporting Services server.
By enabling technologies such as Microsoft PowerPivot for Excel
2010—formerly known as codename “Gemini” (to be available H1
2010)—users can download cubes for their own manipulation in
tools such as Office Excel 2010. PowerPivot utilizes an advanced
compression algorithm that can greatly reduce the physical data
size that is crossing the wire—to occur only when a “self-service”
request is initiated directly by a user.
You can learn more about Microsoft’s experiences in working directly
with customers in extremely large DW and BI implementations by
visiting the SQL CAT team Web site at http://sqlcat.com/.
Charles Fichter (cfichter@microsoft.com)is a Senior Solution Architect
within the Developer Evangelism, Global ISV (Independent Software
Vendor) team at Microsoft Corporation. For the past four and a
half years, Charles has focused on assisting Global ISVs with their
application-design strategies.](https://image.slidesharecdn.com/biarchjournal22-190626013418/75/Performance-Management-How-Technology-is-Changing-the-Game-33-2048.jpg)


This document discusses principles for designing global data warehouse architectures to support enterprise business intelligence applications. It notes common challenges in accessing isolated enterprise data stores due to business, legal, technical and other obstacles. It provides tips for overcoming these, including establishing strong executive sponsorship, understanding the data, and standardizing data models. The article also discusses the importance of data usability and consolidating source data into readable dimensional models to enable self-service BI. Semantic layers can help integrate disparate data models and technologies. Overall it emphasizes the need for a holistic approach to enterprise data and analytics.


![[DSC Europe 25] Ivan Peric - Intelligence Swarm Logic and Techno-Functional M...](https://cdn.slidesharecdn.com/ss_thumbnails/7my7c97fsduiccadgavw-2-251212103249-5a03f7c6-thumbnail.jpg?width=640&height=640&fit=bounds)
![[DSC Europe 25] Debmalya Biswas - Agentification: the art of transforming man...](https://cdn.slidesharecdn.com/ss_thumbnails/r5azlggvtqiaiiusrqdr-4-251212103249-5a12c89b-thumbnail.jpg?width=640&height=640&fit=bounds)
![[DSC Europe 25] Jovan Bogicevic - Legacy to AI-Driven Defense: Transforming D...](https://cdn.slidesharecdn.com/ss_thumbnails/rsarluadt563hntyfc8q-3-251211083849-3e7bc4c0-thumbnail.jpg?width=640&height=640&fit=bounds)
![[DSC Europe 25] Miodrag Pesovic & Vladislav Radonjic - Federated Data Archite...](https://cdn.slidesharecdn.com/ss_thumbnails/gsbe3y5it5uhndi4e08e-1-251212103249-f1008e0c-thumbnail.jpg?width=640&height=640&fit=bounds)

![[DSC Europe 25] Kaja Kandare - LLM as a judge.pptx](https://cdn.slidesharecdn.com/ss_thumbnails/arxyccaxsdsd1ba99wjw-7-251212104007-2b4e3f64-thumbnail.jpg?width=640&height=640&fit=bounds)


![[DSC Europe 25] Dusan Nesic - Securing Tomorrow’s Infrastructure: Why Cyber-P...](https://cdn.slidesharecdn.com/ss_thumbnails/qikbszfftyowjm2q6duw-1-251211083848-8f2ead6b-thumbnail.jpg?width=640&height=640&fit=bounds)
![[DSC Europe 25] Jon Dajci - Bridging TradFi and DeFi: Building the Future of ...](https://cdn.slidesharecdn.com/ss_thumbnails/fqmhfvlbqhkihjvqvhmu-7-251211083849-6af7e325-thumbnail.jpg?width=640&height=640&fit=bounds)


![[DSC Europe 25] Branko Dzakula - From Defense to Attack: How AI Redefines Cyb...](https://cdn.slidesharecdn.com/ss_thumbnails/80bdzdxpr3ky2g0qvyk9-8-251211083048-ce5fc1ee-thumbnail.jpg?width=640&height=640&fit=bounds)
![[DSC Europe 25] Hans Kleinsman - The Compliance Gearbox: How Tax Tech Mediate...](https://cdn.slidesharecdn.com/ss_thumbnails/dxdytie1toel0hr90bjs-2-251212103250-174fdbe7-thumbnail.jpg?width=640&height=640&fit=bounds)


