This PDF documentwas made available from www.rand.org as a public
service of the RAND Corporation.
Jump down to document6
Support RAND
For More Information
Visit RAND at www.rand.org
Explore RAND Europe
View document details
Limited Electronic Distribution Rights
This document and trademark(s) contained herein are protected by law as indicated in a notice appearing later
in this work. This electronic representation of RAND intellectual property is provided for non-commercial
use only. Unauthorized posting of RAND PDFs to a non-RAND Web site is prohibited. RAND PDFs are
protected under copyright law. Permission is required from RAND to reproduce, or reuse in another form, any
of our research documents for commercial use. For information on reprint and linking permissions, please see
RAND Permissions.
THE ARTS
CHILD POLICY
CIVIL JUSTICE
EDUCATION
ENERGY AND ENVIRONMENT
HEALTH AND HEALTH CARE
INTERNATIONAL AFFAIRS
NATIONAL SECURITY
POPULATION AND AGING
PUBLIC SAFETY
SCIENCE AND TECHNOLOGY
SUBSTANCE ABUSE
TERRORISM AND
HOMELAND SECURITY
TRANSPORTATION AND
INFRASTRUCTURE
WORKFORCE AND WORKPLACE
The RAND Corporation is a nonprofit research
organization providing objective analysis and effective
solutions that address the challenges facing the public
and private sectors around the world.
Browse Books & Publications
Make a charitable contribution
2.
This product ispart of the RAND Corporation technical report series. Reports may
include research findings on a specific topic that is limited in scope; present discus-sions
of the methodology employed in research; provide literature reviews, survey
instruments, modeling exercises, guidelines for practitioners and research profes-sionals,
and supporting documentation; or deliver preliminary findings. All RAND
reports undergo rigorous peer review to ensure that they meet high standards for re-search
quality and objectivity.
3.
Performance Audit
Handbook
Routes to effective evaluation
Edited by Tom Ling and Lidia Villalba van Dijk
EUROPE
RAND Europe
Preface
ii
RAND Europe is an independent not-for-profit
policy research organisation that aims
to improve policy and decision-making in the
public interest, through research and analysis.
RAND Europe’s clients include European
governments, institutions, NGOs and firms
with a need for rigorous, independent, multi-disciplinary
analysis. This report has been
peer-reviewed in accordance with RAND’s
quality assurance standards.
The handbook will be of interest to those,
like its authors, who are engaged in conducting
performance audits and evaluation and reflect-ing
in the effectiveness and use of performance
audits. They are likely to be found not only in
audit bodies but also in the various research
and academic institutions that support these
activities and in a wider research community
that is interested in performance audit more
generally. It is not intended as another contri-bution
to social research methods (of which
there are many excellent examples) but rather
it aims to take these methods and make them
applicable in a performance audit setting.
This handbook is intended as a first edi-tion
and we look forward to receiving feedback
on both its current content and potential later
additions. We will then develop future editions
in this light. In this sense it is offered more in
the spirit of opening a conversation within the
international performance audit community
than as a set of lessons for others to follow.
6.
PERFORMANCE AUDIT HANDBOOK
iii
Acknowledgements
This book was funded through RAND internal
funding and the editors would like to express
our gratitude to the President of RAND, Jim
Thomson who supported this project strongly
from the outset, and to Richard Neu who
helped to keep it on track. The handbook would
have been much less good without the contri-butions
from our internal Quality Assurance
process where Christian van Stolk and Emma
Disley provided sage advice throughout. We
introduced the first draft of this book to the
International Research Group in Evaluation
(INTEVAL) in June 2008 and benefited
greatly from both the general encouragement
and the specific feedback. Thanks in particular
are due to Olaf Rieper, Richard Boyle, Peter
Wilkins, Nicoletta Stame, and, for his welcome
inputs over many years, Jeremy Lonsdale. Ray
Rist, as INTEVAL’s spiritual father, and John
Mayne, for his work on the ‘Contribution
Story’ played and important role in framing
the overall approach. Our thanks to the indi-vidual
chapter authors who bore the pleas and
harassment from the editors with good grace
and professionalism. Finally, we would like
to thank Kate Kirk and Cambridge Editorial
Partnership for their contributions to the style
and editing of the report.
We would also like to thank the UK
National Audit Office and Oxford University
Press for permission to use material previously
published by them.
7.
RAND Europe
Contents
Preface ........................................................ii
Acknowledgements ......................................iii
Table of Figures ...........................................ix
Table of Tables ..............................................x
Table of Boxes .............................................xi
CHAPTER 1: Introduction: the changing
iv
context of performance audit
Tom Ling .........................................1
1.1 The changing architecture of
accountability ..................................1
1.2 Agency in the de-bureaucratising
state .................................................2
1.3 Attribution when government
becomes governance.........................3
1.4 Measurement in the face of multiple
players, interests and timeframes ......4
1.5 For whom? Dealing with multiple
stakeholders where costs and benefits
are unevenly distributed ...................4
1.6 Further reading ................................5
CHAPTER 2: A framework for
understanding the contribution of
public services to public benefit
Tom Ling .........................................6
2.1 Performance audit and causality .......6
2.2 Performance audit and judgement ...6
2.3 Theory of Change approaches and
performance audit judgements .........7
2.4 The Theory of Change .....................7
2.5 Building the “contribution story” .....8
2.6 Practical steps to understanding the
contribution of public services to
public benefit .................................10
2.7 Conclusion ....................................10
CHAPTER 3: Building your own toolkit
and capacity set
Tom Ling .......................................11
3.1 Fundamental questions in
performance audit..........................11
3.2 Building capacity to select and use
the most appropriate
methodologies ...............................13
3.3 Tailoring the performance audit
toolkit ............................................14
3.4 Concluding remarks ......................20
CHAPTER 4: Benchmarking
Philip-Bastian Brutscher .................21
4.1 Key points .....................................21
4.2 Defining benchmarking .................21
4.3 When to use benchmarking and
when not to use it ..........................22
4.3.1 Performance vs process
benchmarking .......................22
4.3.2 Domestic vs international
benchmarking .......................22
4.3.3 Public sector vs public policy vs
policy system
benchmarking .......................23
4.4 How to conduct a benchmarking
project ...........................................23
4.4.1 Planning ...............................23
4.4.2 Analysis of data .....................24
4.4.3 Integration, action and
monitoring ...........................24
4.5 International benchmarking in action
– comparing hidden economies .....24
4.6 Summary .......................................26
4.7 Further reading ..............................26
CHAPTER 5: Delphi exercises
Sharif Ismail ..................................27
5.1 Key points .....................................27
5.2 Defining a Delphi exercise .............27
8.
PERFORMANCE AUDIT HANDBOOK
v
5.3 When to use a Delphi exercise .......28
5.4 What a Delphi exercise is not .........28
5.5 How to conduct a Delphi
exercise ..........................................29
5.5.1 Basic Delphi exercise .............29
5.5.2 Delphis with pre-defined
goals......................................30
5.5.3 Rotational Delphis ................30
5.5.4 Teleconferencing Delphis ......30
5.5.5 Online or real-time Delphis ..31
5.5.6 Policy Delphis .......................31
5.6 Delphi in action: the RAND/UCLA
Appropriateness Method in health
settings ..........................................32
5.7 Summary .......................................32
5.8 Further reading ..............................33
CHAPTER 6: Discrete choice modelling
Dimitris Potoglou, Chong Woo Kim
and Peter Burge ..............................34
6.1 Key points .....................................34
6.2 Defining discrete choice
modelling ......................................34
6.3 How to conduct discrete choice
analysis ..........................................35
6.4 Discrete choice modelling in action
(1): revealed preference data/the
London Patient Choice Project
Evaluation .....................................37
6.5 Discrete choice modelling in action
(2): stated preference data/ evaluation
of distribution network operators and
willingness to pay for improvements
in service ........................................38
6.6 Discrete choice modelling in action
(3): combining revealed and stated
preferences/the Isles of Scilly Travel
Demand Model .............................40
6.7 Summary .......................................41
CHAPTER 7: Economic evaluation
Annalijn Conklin ...........................42
7.1 Key points .....................................42
7.2 Defining economic evaluation .......42
7.2.1 Different types of economic
evaluation .............................43
7.2.2 Cost-effectiveness analysis .....43
7.2.3 Cost-utility analysis ...............44
7.2.4 Cost-benefit analysis .............44
7.2.5 Distinguishing types of costs
and benefits ..........................45
7.3 When to use economic
evaluation ......................................46
7.3.1 Cost-effectiveness analysis .....46
7.3.2 Cost-utility analysis ...............46
7.3.3 Cost-benefit analysis .............46
7.4 When not to use it .........................47
7.5 Conducting economic evaluation –
be wary of ratios!............................47
7.6 Summary .......................................52
7.7 Further reading on economic
evaluation ......................................53
CHAPTER 8: Focus group interviews
Aasha Joshi .....................................54
8.1 Key points .....................................54
8.2 Defining focus group interviews ....54
8.3 When to use focus groups ..............54
8.4 Conducting focus group
interviews ......................................54
8.5 Focus groups in action ...................57
8.6 Summary .......................................59
CHAPTER 9: Futures research
Stijn Hoorens ..................................60
9.1 Key points .....................................60
9.2 Defining futures thinking ..............60
9.3 When to use futures research .........65
9.4 Futures research is not a panacea ....67
9.5 Conducting futures research ..........68
9.6 Futures research in action (1) –
helping the European Commission
to identify future challenges in public
health and consumer protection .....69
9.
RAND Europe
vi
9.7 Futures research in action (2) –
the future of civil aviation in the
Netherlands ...................................72
9.8 Summary .......................................75
9.9 Further reading ..............................75
CHAPTER 10: Grounded theory
Richard Warnes ...............................76
10.1 Key points .....................................76
10.2 Defining grounded theory .............76
10.3 When should grounded theory be
used? ..............................................76
10.4 How to use grounded theory .........77
10.4.1 Open coding .........................77
10.4.2 Axial coding ..........................78
10.4.3 Selective coding ....................79
10.5 Potential pitfalls in applying
grounded theory ............................80
10.6 Grounded theory in action (1):
a performance audit of counter-terrorism
measures .........................80
10.7 Grounded theory in action (2):
informing Lord Darzi’s review of the
National Health Service .................81
10.8 Summary .......................................82
CHAPTER 11: Impact assessment
Jan Tiessen .....................................83
11.1 Key points .....................................83
11.2 Defining impact assessment ...........83
11.3 When to use and when not to use
impact assessment ..........................83
11.4 Conducting an impact assessment
exercise ..........................................84
11.4.1 Defining the problem ...........84
11.4.2 Defining the objectives .........84
11.4.3 Identifying policy options .....85
11.4.4 Analysing impacts of different
options ..................................86
11.5 Impact assessment in action: quality
and safety standards for organ
donation and transplantation in
Europe ...........................................92
11.6 Summary .......................................95
11.7 Further reading ..............................98
CHAPTER 12: Key informant interviews
Aasha Joshi ...................................100
12.1 Key points ...................................100
12.2 Defining key informant
interviews ....................................100
12.3 When to use key informant
interviews ....................................100
12.4 How to conduct key informant
interviews ....................................100
12.5 Key informant interviews in
action ..........................................104
12.6 Summary .....................................105
CHAPTER 13: Logic models
Lidia Villalba van Dijk.................106
13.1 Key points ...................................106
13.2 Defining the logic model .............106
13.3 Why use a logic model? ...............108
13.4 When to use logic models ............111
13.4.1 Framing evaluation
questions .............................111
13.4.2 Programme planning and
implementation ..................111
13.4.3 Performance evaluation .......111
13.5 How to develop a logic model ......112
13.5.1 Factors to be taken into account
before developing a logic
model .................................112
13.5.2 Specific steps in logic
modelling............................112
13.6 A logic model in action: combating
benefit fraud ................................113
13.7 Summary .....................................114
13.8 Further reading ............................114
CHAPTER 14: Network analysis
Priscillia Hunt ..............................116
14.1 Key points ...................................116
14.2 Defining network analysis ............116
14.3 When to use network analysis ......116
10.
PERFORMANCE AUDIT HANDBOOK
vii
14.4 When not to use it .......................117
14.5 How to conduct network
analysis ........................................117
14.6 Summary .....................................121
14.7 Further reading ............................121
CHAPTER 15: Online tools for gathering
evidence
Neil Robinson ...............................122
15.1 Key points ...................................122
15.2 Defining online surveys ...............122
15.3 When to use online surveys .........122
15.4 When not to use online surveys ...123
15.5 Conducting online surveys ..........124
15.6 Online surveys in action: reviewing
impact assessments .......................127
15.7 Summary .....................................128
CHAPTER 16: Payback framework
Sonja Marjanovic .........................129
16.1 Key points ...................................129
16.2 Why do we need to evaluate
research? ......................................129
16.3 Defining the Payback
framework ...................................129
16.3.1 Categories of benefits (Payback)
and associated indicators .....130
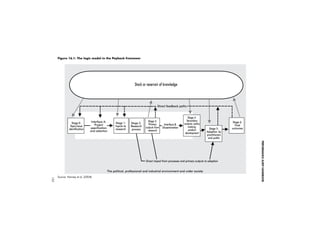
16.3.2 The logic model in the Payback
framework ..........................132
16.4 When to use the Payback framework
for research evaluation .................135
16.4.1 The Payback framework and
evaluation objectives ...........135
16.4.2 Measures used in the Payback
framework ..........................135
16.4.3 The Payback framework and
levels of aggregation ............135
16.4.4 The Payback framework and the
timing of an evaluation .......136
16.5 How to use the Payback
framework ...................................136
16.6 The Payback framework in
action ..........................................137
16.7 Summary .....................................140
16.8 Further reading ............................141
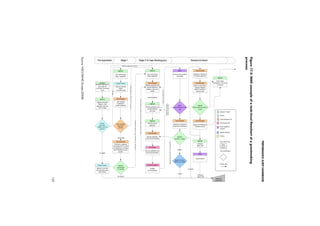
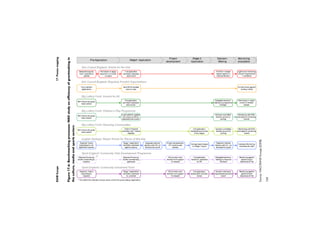
CHAPTER 17: Process mapping
Jan Tiessen ...................................146
17.1 Key points ...................................146
17.2 Defining process mapping ...........146
17.3 When to use and when not to use
process mapping ..........................146
17.4 How to conduct process
mapping ......................................147
17.5 Process mapping in action: awarding
grants in the culture, media and sport
sector ...........................................158
17.6 Summary .....................................161
17.7 Further reading ............................161
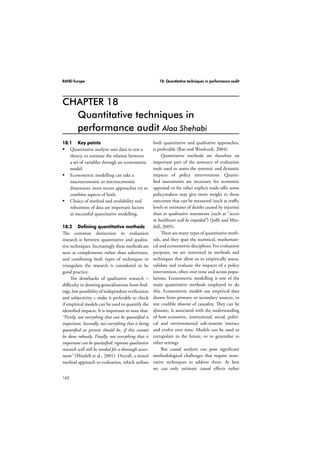
CHAPTER 18: Quantitative techniques in
performance audit
Alaa Shehabi ................................162
18.1 Key points ...................................162
18.2 Defining quantitative methods ....162
18.3 The range of quantitative
techniques ...................................163
18.3.1 Macro models .....................164
18.3.2 Micro models ......................167
18.3.3 Environmental impact
assessment models (EIA) .....169
18.3.4 Choosing which model to
use ......................................170
18.4 When to use quantitative
techniques ...................................175
18.5 When not to use quantitative
techniques ...................................175
18.5.1 When there are theoretical
issues ...................................175
18.5.2 When there are methodological
issues ...................................175
18.5.3 When there is insufficient
data .....................................176
18.5.4 Other practical
considerations .....................181
18.6 Quantitative methods in action ...181
11.
RAND Europe
viii
18.6.1 Computable general
equilibrium (CGE)
models ................................181
18.6.2 Sectoral partial equilibrium
models ................................181
18.6.3 Macro-econometric models .182
18.6.4 Microsimulation models .....182
18.6.5 Markov models ...................182
18.7 Summary .....................................183
18.8 Further reading ............................183
CHAPTER 19: Stakeholder engagement
Lila Rabinovich ............................184
19.1 Key points ...................................184
19.2 Defining stakeholder
engagement .................................184
19.3 When to use stakeholder
engagement .................................185
19.4 When not to use stakeholder
engagement .................................185
19.5 How to conduct a stakeholder
engagement exercise .....................185
19.5.1 Determine the aim of
stakeholder engagement ......185
19.5.2 Decide which stakeholders to
involve ................................187
19.5.3 Structure stakeholder input .187
19.5.4 Use stakeholder input .........188
19.6 Summary .....................................188
19.7 Further reading ............................188
CHAPTER 20: Standard cost modelling
Carlo Drauth ...............................190
20.1 Key points ...................................190
20.2 Defining standard cost
modelling ....................................190
20.3 Why do we need to reduce
administrative burdens? ...............190
20.4 Benefits of the Standard Cost
Model ..........................................192
20.5 Potential pitfalls of the Standard Cost
Model ..........................................192
20.6 Conducting a standard cost
modelling exercise ........................193
20.7 Summary .....................................207
Reference List..........................................198
12.
PERFORMANCE AUDIT HANDBOOK
ix
Table of Figures
Figure 3.1: Framing the fundamental
questions of performance
audit.................................... 12
Figure 3.2: First level view of toolkit ..... 15
Figure 3.3: The area of costs in the
toolkit ................................. 16
Figure 3.4: The area of benefits
(compliance) in the toolkit .. 17
Figure 3.5: The area of benefits (customer
service) in the toolkit ........... 18
Figure 3.6: The area of benefits (savings) in
the toolkit ........................... 19
Figure 6.1: Choice context of London’s
patients ............................... 37
Figure 6.2: An example of a choice
experiment .......................... 39
Figure 7.1: Illustration of economic
evaluation as a comparative
analysis of alternative courses of
action .................................. 42
Figure 9.1: The relevance of futures
research methods at different
stages of the policy cycle ...... 66
Figure 9.2: Eight critical uncertainties
driving future change of
public health and consumer
protection............................ 71
Figure 9.3: Scenario axes for the future
of civil aviation in the
Netherlands in 2025............ 73
Figure 11.1: Hierarchy of objectives ........ 85
Figure 11.2: Diagram of the three main
policy objectives .................. 85
Figure 13.1: The basic logic model ........ 110
Figure 13.2: Logic model “Targeting Fraud”
advertising campaign ......... 115
Figure 14.1: Simple graph nodes ........... 119
Figure 14.2: Multiplex relations ............ 120
Figure 14.3: Social network – a “Kite
Network” .......................... 120
Figure 15.1: General process of
implementing online data
collection tools .................. 125
Figure 16.1: The logic model in the Payback
framework ......................... 133
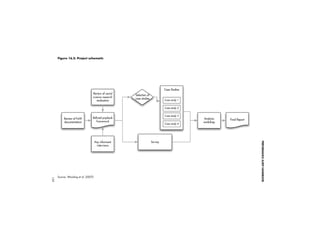
Figure 16.2: Project schematic ............... 139
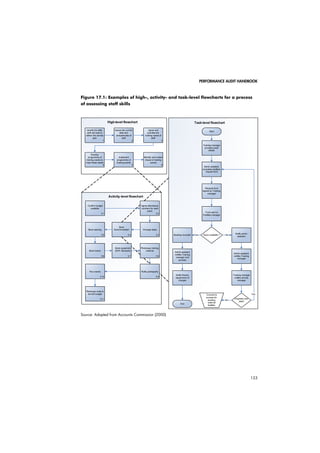
Figure 17.1: Examples of high-, activity-and
task-level flowcharts for a
process of assessing staff
skills .................................. 153
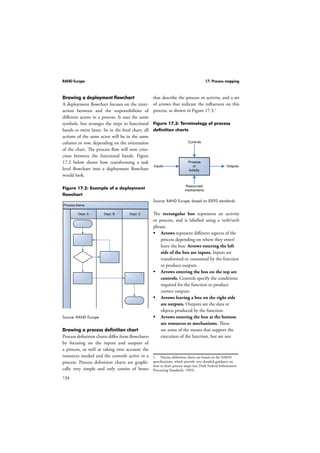
Figure 17.2: Example of a deployment
flowchart ........................... 154
Figure 17.3: Terminology of process
definition charts ................ 154
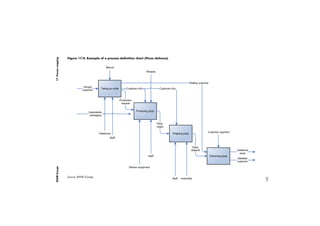
Figure 17.4: Example of a process definition
chart (Pizza delivery) ......... 156
Figure 17.5: NAO example of a task-level
flowchart of a grantmaking
processs ............................. 159
Figure 17.6: Benchmarking processes:
NAO study on efficiency of
grantmaking in the culture,
media and sports sectors .... 160
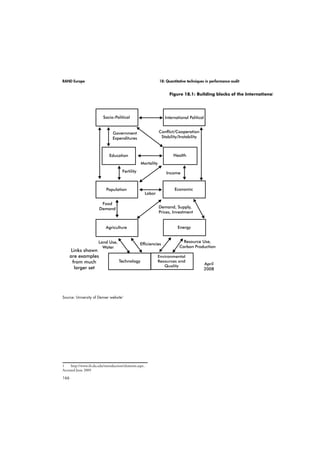
Figure 18.1: Building blocks of the
International Futures CGE
model ................................ 166
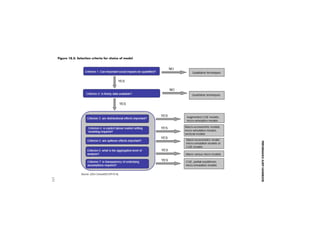
Figure 18.2: Selection criteria for choice of
model ................................ 171
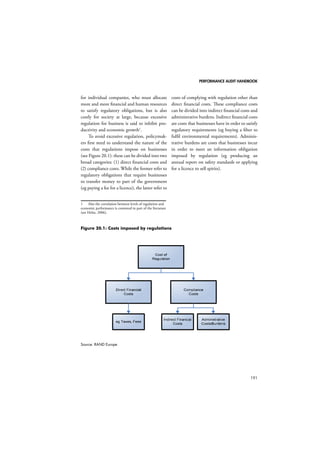
Figure 20.1: Costs imposed by
regulations ......................... 191
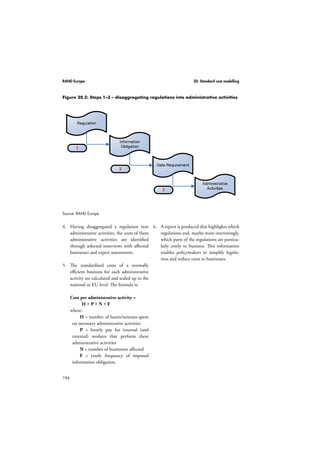
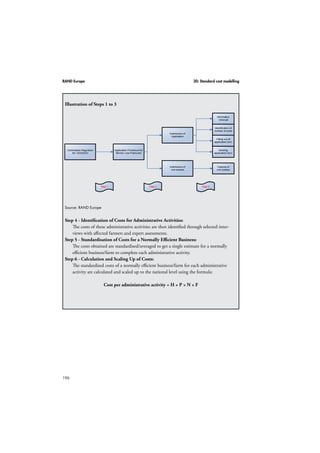
Figure 20.2: Steps 1–3 – disaggregating
regulations into administrative
activities ............................ 194
13.
RAND Europe
Tableof Tables
x
Table 16.1: The payback from research in
case studies of the Future of
Work programme .............. 142
Table 17.1: Choosing a process map .... 148
Table 17.2: Types of information collected
in different map types ........ 149
Table 17.3: Methods for gathering
evidence ............................ 150
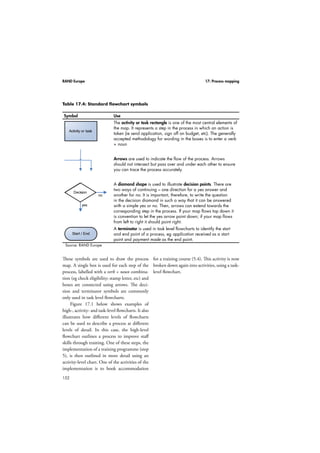
Table 17.4: Standard flowchart
symbols ............................. 152
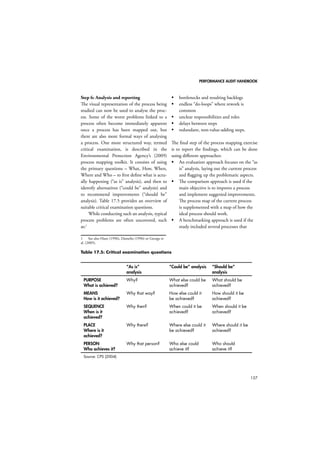
Table 17.5: Critical examination
questions ........................... 157
Table 18.1 What quantitative models
can do ............................... 174
Table 5.1: Comparison between standard
and real time (online) Delphi
exercises ............................... 31
Table 6.1: Stated preference attributes .. 39
Table 7.1: Types of economic evaluation
studies ................................. 43
Table 7.2: Four health-related economic
evaluation databases ............ 53
Table 8.1: Five types of questions and
examples.............................. 56
Table 9.1: Brief descriptions of a selected
sample of futures research
methodologies ..................... 63
Table 9.2: Brief description of the three
SANCO scenarios ............... 72
Table 9.3: Attributes of the future of civil
aviation scenarios ................ 74
Table 10.1: Glaser’s coding families ........ 79
Table 11.1: Scoring mechanism to compare
non-quantifiable impacts ..... 88
Table 11.2: Comparison of methods to
assess impacts ...................... 89
Table 11.3: Example of a summary
table .................................... 91
Table 11.4: Benchmarking the policy
option against the Spanish
model .................................. 94
Table 11.5: Comparison of the health
impacts of proposed policy
actions ................................. 97
Table 12.1: Types of interview
prompts............................. 102
Table 12.2: Examples of common pitfalls in
interviewing ...................... 103
Table 13.1: DWP initiatives selected for
analysis .............................. 113
Table 14.1: Summary of data ............... 118
Table 14.2: Reported working
relationships ...................... 119
14.
PERFORMANCE AUDIT HANDBOOK
xi
Table of Boxes
Box 6.1: Data elements in discrete
choice modelling ................. 35
Box 6.2: Elements of discrete choice
model estimation ................. 36
Box 7.1: The same economic evaluation
technique can produce different
ratios ................................... 48
Box 9.1: Embedding a long-tern
perspective in government and
administration ..................... 61
Box 9.2: Step-wise approach to scenario
building .............................. 69
Box 16.1: Categories of benefits from
research in the Payback
framework ......................... 130
Box 16.2: Some indicators of potential
benefits from research (within a
Payback framework
category) ........................... 131
Box 16.3: A summary of issues to
consider in evaluations, within
each stage of the Payback logic
model ................................ 134
Box 16.4: Revised Payback categories for
social science ..................... 140
Box 18.1: Causality and the notion of
ceteris paribus.................... 163
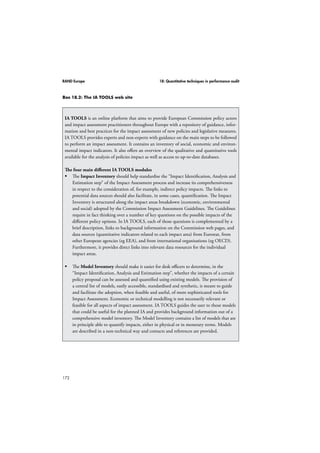
Box 18.2: The IA TOOLS web site .... 172
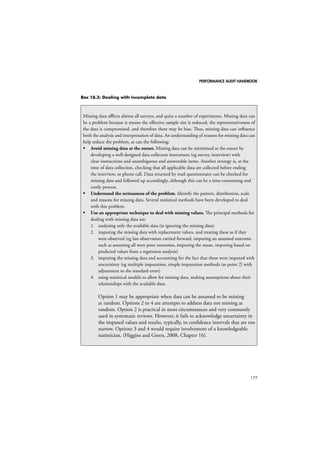
Box 18.3: Dealing with incomplete data ..
173
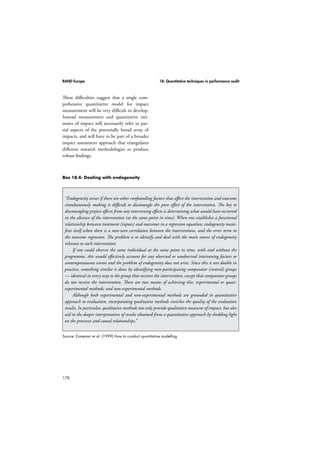
Box 18.4: Dealing with endogeneity .. 177
Box 19.1: Stakeholder engagement versus
stakeholder consultation .... 185
Box 19.2: Structuring stakeholder
engagement in the public
sector: the UK School Meals
Review Panel ..................... 186
Box 19.3: Structuring stakeholder
engagement at the European
level: the European Alcohol
and Health Forum ............. 188
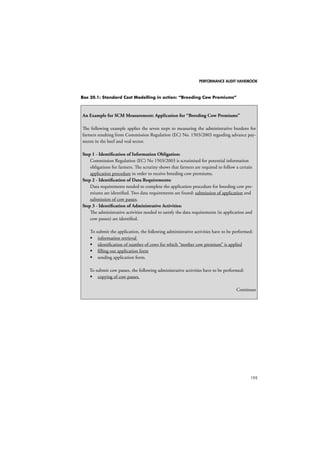
Box 20.1: Standard Cost Modelling
in action: “Breeding Cow
Premiums” ........................ 195
16.
PERFORMANCE AUDIT HANDBOOK
1
CHAPTER 1
Introduction: the changing context
of performance audit Tom Ling
Future, more diffused approaches to
governance, in all parts of society, will
only work if there are frameworks in place
that assure very high levels of transparency,
accountability and integrity. (OECD,
2000, p. 3)
1.1 The changing architecture of
accountability
Performance audit involves drawing together
evidence to support judgements about the
worth and value of activities made possible by
the use of public resources (money, authority,
staff, etc). Unlike pure research it is driven by
questions that should matter to those hold-ing
others to account: Parliamentarians and
other elected officials, the public, the media,
organised interest groups and so forth. It
should also produce conclusions that are
comprehensible to these groups and recom-mendations
that can be put into effect. It has
corollaries in the private sector, and many of
the methods described here are also of use in
the private sector, but performance audit, in
the sense used here, is inherently linked to the
idea of a sector delivering public benefits and
being held to account for doing so. Its first
purpose is, therefore, to strengthen account-ability
by making evidence available to allow
citizens to understand what has been done
in their name and with what consequences.
Its second, equally important purpose is to
facilitate reflection and learning so that future
public services might be better run and public
activities focused more intelligently on public
benefit; and (if we are to avoid a technocracy)
we strongly argue that weighing benefit should
be shaped by political judgements. However,
the ability of performance audit to achieve
this depends crucially upon the validity and
reliability of its findings and, for this reason,
like pure research, only the highest standards
of approach and methodology are acceptable.
This is the focus of this handbook.
A central thesis here is that, in recent
decades, this task of supporting and deliver-ing
performance audit has become technically
more demanding. The subsequent chapters
address some of these technical issues and they
aim to provide a toolkit of approaches needed
by the contemporary performance auditor.
They draw upon many years of experience at
RAND Europe delivering performance audit
for a wide range of clients and in particular for
the UK National Audit Office and the Euro-pean
Commission. However, this should come
with an “auditors’ health warning”: improving
the methodologies of performance audit will
only strengthen performance audit to a cer-tain
extent. Successful performance audit also
depends upon having wider clarity in society
about its legitimate breadth and depth and this
is a theme that will be developed in a volume
by Wilkins, Ling and Lonsdale (forthcoming)
to be published by Edward Elgar.
So the central theme of this introductory
chapter is that the architecture of the contem-porary
state is changing in ways that cause
problems for the role of performance audit
and that at least part of the response to this
must be to adopt a more sophisticated set of
audit approaches and methodologies. In this
17.
RAND Europe 1:Introduction: the changing context of performance audit
context, architecture refers to the relation-ships
2
amongst the organisations involved in
delivering, communicating and acting upon
performance audit (audit bodies, organisations
commissioned to support the work of audit
bodies, parliament, government, the press, and
departments and agencies), the resources they
use (money, statutory powers, skills, influence)
and the power relationships that hold them
together.
The problematic transformations for per-formance
audit might be organised into four
dimensions. First is the problem of agency:
identifying who was responsible, how deci-sions
were made, or even the intended purpose
has become increasingly difficult. Second is
the problem of attribution: we may be able to
measure certain outcomes, for example, but
understanding what was causally necessary
or sufficient for this outcome to be achieved
can prove elusive. Third is the problem of
measurement: many inputs, processes, outputs
and outcomes can be very difficult to measure,
especially where these are intangible (trust,
social capital, confidence, and even happiness
might be relevant but difficult things to meas-ure).
Fourth is the problem of whose benefit is
being measured and the need to recognise that
there may be multiple stakeholders with differ-ent
and even incommensurate interests; in this
case achieving an understanding of aggregate
benefit could be difficult or unhelpful. Below,
we consider these four dimensions in turn.
1.2 Agency in the de-bureaucratising
state
Arguments about agency in the modern state
are not new. They address the question “Who
makes the key determining decisions?” or, at
least, “In what setting and through what proc-esses
are these decisions taken?” Historically
these often concerned the role of adminis-tration
compared with political leadership.
Weber, in particular, was concerned about
“bureaucratic power becoming out of con-trol”
(Gerth and Mills, 1948, pp. 232–235).
Weber’s concern, however, was relatively
straightforward and focused on a perceived
tendency in the modern world to move deci-sionmaking
from democratically accountable
forums to the bureaucracy. Lenin is often said
to have called this the “who-whom” question.
As public services became more complex, how-ever,
the problem of agency increased. As long
ago as the 1940s there was an active debate
(the so-called Friedrich-Finer debate) over
whether external controls were sufficient to
ensure accountability, or whether professional
and ethical motivations were also necessary
(see Friedrich, 1940).
In recent decades agency has become more
dispersed and the “problem of many hands”
has meant that performance auditors need
to interrogate not simply one decisionmaker
but to understand a potentially long chain of
interactions – potentially with feedback loops
– which culminate in particular outcomes (see
further: Ling, 2002, Pierre and Peters, 2000,
Rhodes, 1997, 2000, Richards and Smith,
2002, Smith, 1999, Walsh, 1995). This can
be seen as a problem of growing complexity.
Public services have become more complex
in at least two ways (see Stame, 2004, p. 64).
First, policymakers have attempted to create
integrated programmes bringing together
different services such as Health, Social Care,
Urban Regeneration and Employment, or
integrating previously fragmented agencies
working in delivering the same service (such
as acute and primary health care). This is in
recognition of the fact that the processes
producing those services are themselves inter-locked.
Second, within a multi-level system of
government European, national, regional and
local levels of government can all be involved.
18.
PERFORMANCE AUDIT HANDBOOK
3
These could be called horizontal and vertical
complexities.
Across contemporary states we have seen
a movement towards a differentiated policy
model in which there are policy networks,
power dependencies and complex relationships
between the centre and devolved, regional,
local and mayoral authorities. The popular
grumble that “no-one seems to take respon-sibility
for their actions any more” reflects
something more deeply rooted than simply the
pusillanimity of decisionmakers.
Techniques outlined in later chapters
capable of helping the hard-pressed perform-ance
auditor to grapple with the question of
agency include logic models, network analysis
and process mapping, and findings may be
supplemented with interviews, focus groups,
surveys and Delphis.
1.3 Attribution when government
becomes governance
In contemporary states, many areas of activity
are being characterised by less government and
more governance. Consequently, relationships
within the public sector becoming more dif-ferentiated,
with partnerships between public
bodies and more non-state organisations (both
corporate and third sector) involved in the
business of delivering public services. This
involves a new set of players, including:
private and not-for-profit bodies
contracting to do work previously done
by public bodies
new collaborations within the public
sector involving partnerships between
agencies that were previously only weakly
connected
private bodies taking over responsibility
for public services
co-financing and pooled budget
arrangements with public and private
money combined to deliver a service
partnerships with a more or less formal
status
more elusive arrangements of state and
non-state bodies being encouraged to
collaborate for mutual benefits and
public gain.
OECD has argued that “old forms of govern-ance,
in both the public and private sectors,
are becoming increasingly ineffective” and that
“new forms of governance needed over the
next few decades will involve a much broader
range of active players” (OECD, 2000). The
key features of new manifestations of govern-ance
arrangements include:
new cross-cutting tasks and targets where
agencies and departments are given
shared responsibilities
more multi-level governance
arrangements involving local, regional,
national and European levels of
government
in the name of greater transparency in the
face of complexity, the rise of inspection
and regulation in the public sector
the (partial) empowerment of new
partners in public service provision and
an engagement of users of services and
other stakeholders.
Metaphorically we can think of attribution
in government in terms of a truck and trailer;
we know where the engine of change is to be
found and we can identify the driver and her
intentions. With governance the metaphor
is more akin to a fleet of ships loosely held
together by a set of rules of the ocean, terms
of engagement, shared charts, and influenced
by the same winds and sandbanks. We need
to understand the rules and their interpreta-tion
in each ship, the capacities of different
vessels, what charts they are using, and their
skills in sea-craft if we are to understand, hold
19.
RAND Europe 1:Introduction: the changing context of performance audit
to account and learn from the movements of
the fleet.
4
In addressing the problems of attribution,
the performance auditor might draw upon the
chapters on benchmarking (we cannot under-stand
how well the fleet is working until we
compare it with other examples), economet-rics
to understand how the fleet behaves, focus
groups, interviews and surveys to understand
motivations, grounded theory to make sense
of what we are being told and Delphis to
understand what experts believe.
1.4 Measurement in the face of
multiple players, interests and
timeframes
The above developments have both made
measurement more difficult and fed an appe-tite
for more measurement on the grounds
that “what cannot be measured cannot be
managed”. More specifically for performance
audit, this new terrain has important implica-tions.
We consider three of these here:
1. The involvement of statutory, voluntary,
corporate and community bodies in deliv-ering
services makes it more difficult to
account for and measure the use of public
money and often to measure outcomes,
especially because it is unclear what these
bodies might have done in the absence of
public money or public sector steering.
2. If it is more difficult to understand what to
measure, it is also more difficult to under-stand
when to measure. Many examples of
governance have the explicit aim of secur-ing
long-term improvements or benefits in
services, such as transport, education and
crime reduction, which may take over 20
years to be completed. However, neither
performance auditors nor the public have
been willing to wait until their completion
before asking audit questions. Arriving
at an ex ante, audit judgement requires
auditors to take a view on decisions that
relate to an uncertain future (see Ling,
2003).
3. Interventions, such as urban regeneration,
involve the government intervening in
complex adaptive systems, where public
agencies are not in full control of the out-comes.
In this context, it may be necessary
to measure the features of the system or
network (how often do interactions take
place, with whom and for what purpose).
However, this is often not immediately
interesting to the public and measuring
network characteristics requires particular
methods.
This handbook also offers some tools to address
these problems of measurement. Logic models
can provide a structured way to identify what
it is important to measure, economic evalua-tion
can be especially useful where costs and
benefits can be monetised, futures thinking
can help when considering long-term future
impacts to measure, impact assessments
provide a helpful way to provide an array of
outcomes to measure, and standard cost mod-elling
can provide a way into understanding
the categories and ranges of costs.
1.5 For whom? Dealing with
multiple stakeholders where
costs and benefits are unevenly
distributed
Costs saved to the taxpayer, for example, or
improved delivery for the same resource, are
(other things being equal) unequivocally good
things. However, most performance audits
come up against the problem that costs and
benefits are unevenly distributed, that those
who contribute most might not be the ben-eficiaries,
and that benefits might be incom-mensurate
(an economic saving for one might
involve a loss of privacy for another). Many
20.
PERFORMANCE AUDIT HANDBOOK
5
important issues of the day (such as climate
change, migration and security) involve man-aging
risks rather than delivering measurable
outcomes (the risk might have been well man-aged
whatever the outcome) (see Beck, 1992;
cf Culpitt, 1999). Furthermore, the costs or
the benefits might be in the future and con-tingent
upon developments over which public
decisionmakers have little control. To com-plicate
matters still further, different groups
might value the same outcomes differently.
For example, certain types of consumer might
value front of pack labelling on nutrition very
highly while others might primarily be inter-ested
in place of origin.
In this context, the performance auditor
might draw upon chapters addressing how to
understand how service users value different
packages of service, how to estimate future
costs and benefits, and how to understand
the risks being managed. Delphis can help
to identify future risks and futures thinking
can help to identify the dimensions and cat-egories
of future costs and benefits. Discrete
choice modelling is an essential tool if we are
to understand how individual service users
value the different possible options. Impact
assessments show how to structure an array of
costs and benefits across multiple stakeholders
and stakeholder analysis can help understand
stakeholders’ values and priorities. All of these
are discussed in later chapters.
1.6 Further reading
Audit Commission and MORI, Trust in
Public Institutions, London: Audit
Commission, 2001.
Bamberger, M., J. Rugh and L. Mabry, Real
World Evaluation, London: Sage, 2006.
Davis, H. and S.J. Martin, “Evaluating the
Best Value Pilot Programme: Measuring
‘Success’ and ‘Improvement’’’, Local
Government Studies, Vol. 28, No. 2, 2002,
pp. 55–68.
Gill, M., “Let’s finally talk about tax”, Fabian
Review, January 2005. As at 23 October
2009: www.fabian-society.org.uk
Kelly, G. and S. Muers, Creating Public
Value. An Analytical Framework for Public
Service Reform, London: Strategy Unit,
Cabinet Office, 2002.
Normanton, E.L., The Accountability and
Audit of Governments. A Comparative
Study, Manchester, UK: Manchester
University Press, 1966.
O’Neill, O., A Question of Trust: Called to
Account, Reith Lecture, 2002. As at 23
October 2009: www.bbc.co.uk/radio4/
reith2002/lecture3.shtml
also available as O’Neill, O., A Question
of Trust, Cambridge, UK: Cambridge
University Press, 2002.
Power, M., The Audit Society: Rituals and
Verification, Oxford, UK: Oxford
University Press, 1999.
van Stolk, C. and J. Holmes, Etude sur les
Réformes des Administrations Fiscales
Internationales, prepared for the Cour des
Comptes, Santa Monica, CA : RAND
Europe, TR-456-CCF, 2007.
van Stolk, C., J. Holmes and J. Grant,
Benchmarking of Tax Administrations,
prepared for EUROSAI, Santa Monica,
CA: RAND Europe, DRR-4050, 2006.
Walsh, K., Public Services and Market
Mechanisms: Competition, Contracting and
the New Public Management, Basingstoke,
UK: Macmillan, 1995.
21.
RAND Europe 2:A framework for understanding the contribution of public services to public benefit
2.1 Performance audit and
6
causality
In the previous chapter we noted how the
changing architecture of accountability and
delivery is provoking many changes in the
practice of performance audit. Performance
audit aims to understand what difference a
service, regulation, or other activity makes, at
what cost, and who bears the costs and receives
the benefits. It is therefore concerned with the
contribution made to achieving desirable out-comes
and minimising undesirable costs and
consequences. Sooner or later this requires
some consideration and understanding of
attribution, contribution and causality, often
in the context of complex interventions that
may evolve over time. This is not the place for
an extended methodological discussion but it
is important that as we consider how to apply
methodologies outlined in later chapters, we
do so within a framework informed by a plau-sible
understanding of how we might conclude
that public services contribute to or detract
from the well-being of society.
Performance audit often includes a “Why?”
question inviting a causal explanation. This
might be why a particular health intervention
delivered significant health benefits or why an
anti-crime programme failed to reduce crime.
It is immediately apparent that these are unique
events and as such do not allow us to conduct
experimental or quasi-experimental studies to
understand causality. Instead, we are invited to
develop a narrative account of why something
happened which can provide the basis for an
audit judgement.
2.2 Performance audit and
judgement
Performance audit, in common with evalu-ation,
involves a number of activities leading
to an exercise of judgement (Schwandt, 2008).
Performance audit bodies therefore seek to
arrive at judgements which are seen to be
legitimate (Hurteau et al., 2009). This require-ment
for legitimacy is one of the many ways
in which academic research is distinct from
performance audit. Being seen to be legitimate
might involve five steps (similar to those iden-tified
by Scriven, 1980):
1. Agree with stakeholders the perform-ance
criteria applicable to the service in
question.
2. Agree the performance standards and
intended outcomes that are applicable.
3. Gather data relating to these standards and
outcomes.
4. Assess the contribution made by the
agency/activity in achieving these stand-ards
and outcomes.
5. Form a performance audit judgement.
These steps protect the audit body from the
accusation of being arbitrary or otherwise
non-rational. All performance audit bodies
have different stakeholders related to their par-ticular
context. Should audit bodies develop
performance criteria that are irrelevant to these
CHAPTER 2
A framework for understanding the
contribution of public services to
public benefit Tom Ling
22.
PERFORMANCE AUDIT HANDBOOK
7
stakeholders (elected politicians, managers,
professionals, users, taxpayers, for example)
then they might not be seen to form legitimate
judgements. We have seen a trend towards
performance auditors taking on a wider set of
stakeholder interests and demonstrating con-cern
with wider issues such as user satisfaction,
adherence to professional values, the effec-tiveness
of cross-government working and so
forth, in addition to more traditional concerns
such as value for money and conformity with
policymakers’ intentions.
Performance audit bodies will not only
seek to identify acceptable performance cri-teria
(the domains of measurement) but also
acceptable performance standards (the levels
that should be achieved). They may also seek
to influence these standards. For example, a
RAND study showed that what was consid-ered
to be an unacceptable level of error in
social security in the UK was in fact broadly
in line with what was achieved in other
countries, highlighting the apparently inher-ent
nature of error in complex social security
systems and lowering the threshold of what
was considered to be acceptable (National
Audit Office, 2006). The third step involves
understanding the contribution made by the
service to achieving the standards or outcomes.
A characteristic of performance audit is that
it is clearly oriented towards collecting and
analysing data that helps to identify and assess
the contribution made by a particular set of
activities. Finally, an audit judgement can be
drawn informed by understanding this contri-bution.
In this chapter we suggest a coherent
approach to understanding this contribution,
suggesting that, following Mayne, a pragmatic
place to start is with the underlying theory of
how the activities were intended to produce
these benefits.
2.3 Theory of Change approaches
and performance audit
judgements
The performance audit judgement rests upon a
sequence of related statements:
1. The thing being audited was intended to
achieve or contribute A (particular criteria
and standards).
2. It actually achieved or contributed B (a
particular level of performance).
3. The reasons for this are C,D, and E.
4. A contribution of A might have been
expected, but we now know that there
were particular additional factors to take
into account, consequently our view on
performance is F, and the lessons we derive
for the future are G.
To succeed, these steps must provide – implic-itly
or explicitly – an analysis of how the pro-gramme,
agency or activity was supposed to
work, an analysis of what actually happened
(including compelling evidence) and a judge-ment
about what should have happened (was
it a consequence of the design, the delivery,
or external factors). Achieving these steps to
arrive at a legitimate, non-arbitrary, rational
basis for audit judgements is made easier, we
suggest, using a Theory of Change.
2.4 The Theory of Change
Implicitly or explicitly, many evaluations of
complex interventions use a Theory of Change
(ToC) approach.1 These evaluations aim not
only to understand the contribution made by a
programme or activity to achieving outcomes,
but also to interrogate evidence and commu-
1 We do not always find it helpful to use the language
of ‘Theory of Change’ but the approach has under-pinned
our work for clients including the National Audit Office,
the Department of Health, DG SANCO, The Health
Foundation, Tommy’s the Baby Charity, the Papworth
Trust, and others.
23.
RAND Europe 2:A framework for understanding the contribution of public services to public benefit
nicate findings to support both learning and
accountability.
8
Our approach takes as its starting point
the argument of Weiss (1995) that:
The concept of grounding evaluation
in theories of change takes for granted
that social programmes are based on
explicit or implicit theories about how
and why the programme will work…
The evaluation should surface those
theories and lay them out in as fine
detail as possible, identifying all the
assumptions and sub-assumptions
built into the programme. The evalu-ators
then construct methods for data
collection and analysis to track the
unfolding assumptions. The aim is
to examine the extent to which pro-gramme
theories hold…the evaluation
should show which of the assumptions
underlying the programme are best
supported by the evidence.
In this sense, ToC is an approach rather
than a methodology (its successful delivery
requires harnessing a range of methodologies
such as those outlined elsewhere in this docu-ment).
Our ToC approach has five precepts.
Individually these precepts are, in our view,
neither controversial nor radical but taken
together they provide a firm and pragmatic
base for performance audit. First the approach
requires us not only to look at the outcomes
of the programme but to pay equal attention
to processes. This contrasts with more classical
evaluation approaches which tend to look at
outcomes first and then to look for evidence
to support attribution. Second, the approach
requires a more embedded evaluator where
the auditor works closely with policymakers,
practitioners and end users to understand and
elaborate a sometimes changing theory of
change. Without losing their independence,
successful auditors will understand the world
of the policymakers, practitioners and service
users, including an understanding of what
motivates their behaviour. Third, the approach
requires an ability to reconstruct and represent
the sequence of events connecting actions to
each other and how these contributed to the
outcomes identified, reconstructing at least
the sequence of events and statistical covaria-tions,
but preferably also identifying the causal
mechanisms at work. Fourth, the approach
is sensitive to the possibility that during the
life of a programme or intervention, initial
theories of change may change in response
to learning or to exogenous events and that
the evaluation should capture these chang-ing
understandings and actions. Fifth, it will
also be sensitive to the fact that different and
potentially conflicting theories of change
might be simultaneously pursued within any
one programme; the thing being audited can
often be a terrain upon which different values,
interpretations and interests play out their dif-ferences.
Collectively, these precepts describe
an interest not only in causal effects (what hap-pens
when an independent variable changes)
but also in causal mechanisms (what connects
causes to their effects); not only what officials
say they do but what the evidence shows they
do; and not only what contribution stories
practitioners tell themselves and others but
also what really contributes to public benefit.
2.5 Building the “contribution
story”
The approach to performance audit outlined
here could give rise to varied practices amongst
audit bodies. In putting these rather abstract
arguments into practice we would advocate
developing what Mayne (2008) calls the
“contribution story”; that is, to understand
why practitioners and policymakers believe
24.
PERFORMANCE AUDIT HANDBOOK
9
that their use of resources (money, authority,
expertise, time, etc) will contribute to public
benefits and what side-effects and unintended
outcomes they envisage. Of the myriad things
that could capture the performance auditors’
gaze, taking the contribution story as the start-ing
point increases the chances of both support-ing
accountability and improving future prac-tice.
Data collection then supports or weakens
these narratives. Pragmatically, we agree with
Mayne (2001) that in “most cases what we are
doing is measuring with the aim of reducing
uncertainty about the contribution made, not
proving the contribution made”. This allows
auditors to narrow down the potential range
of questions posed by a more general (and
sometimes abstract) ToC approach and to
focus on the things service users, practitioners
and policymakers most need to know. In prac-tice,
we therefore need a tool for developing
and understanding the contribution story that
we can use to make sense of the (sometimes
varying) claims made. We suggest that Mayne’s
approach is a pragmatic way of dealing with
the reality that most performance evaluations
are not aiming to achieve statistically valid
accounts of attribution in relation to multiple
repeatable events. Rather, they are typically
concerned with unique events that may have
unfolded in unintended ways, with intended
outcomes that were possibly unclear, not
agreed and in any case changed during the life
of the intervention. Understanding contribu-tion,
rather than proving attribution, becomes
an important goal of performance audit. The
alternative is for performance auditors to end-lessly
complain at the real world’s inability
to organise its affairs as if they were part of a
randomised controlled trial.
The contribution story provides benefits
for performance audit by making explicit prior
assumptions. Not only does this provide focus
for the performance audit as a study but also
any findings are likely to be relevant to the
world view of practitioners and stakeholders.
However, an important limitation is that they
may also be subjective and that a variety of con-tribution
stories may be held at any one time.
For these reasons, the contribution stories exist
to be interrogated and tested in the light of the
evidence collected and are not a substitute for
analysis. The purpose is not simply to make
visible contribution stories but to subject these
to careful analysis.
In later chapters we discuss the use of
two tools that can support the interrogation
of the contribution story; process maps and
logic models. Either of these can be used to
achieve some initial clarity about the contribu-tion
story. Two things should be made clear
about them: first, they are a starting point for
data collecting rather than representing the
programme/project itself (they generate mini-hypotheses
to be assessed); and second, they
have their own limitations, which we identify
in the relevant chapters. They can also be used
at the reporting stage to communicate findings
should this be helpful. In this sense they should
be used pragmatically as stepping stones to
understand the causal chains in the ToC or as
vital parts on the contribution story.
But, to repeat, we are interested in testing
these against independent evidence that sup-ports
or weakens the contribution stories, and
also in understanding how motivations are
shaped (perhaps by institutional change), how
information is made available, processed and
acted upon, and how capacities in particular
respects are weakened or strengthened. This
is not unlike the process-tracing approach of
George and Bennett (2005), but we would
always want to support this with strong statis-tical
evidence of causal effects where feasible.
Finally, we are aware of the need to be sensitive
to context, reflecting the realistic evaluation
mantra that “mechanism + context = outcomes”
25.
RAND Europe 2:A framework for understanding the contribution of public services to public benefit
(Pawson and Tilley, 1997). The importance of
context encourages caution before believing
that success achieve in one place can automati-cally
10
be replicated elsewhere. We suggest that
benchmarking at least and rigorous compara-tor
data at best are crucial to this process.
2.6 Practical steps to understanding
the contribution of public
services to public benefit
John Mayne (2001, p. 9) has outlined six steps
in contribution analysis. Here we present a
variation on this and link it to the particular
issues related to arriving at a legitimatised
audit judgement (indented as bullet points
below). The steps towards understanding con-tribution
are:
1. Identifying the formal contribution story
from documentary analysis.
Identifying agreed performance
criteria, performance standards, and
expectations.
2. Identifying tacit and informal assumptions
through interviews with practitioners and
wider stakeholders; participant observa-tions,
etc.
Identifying tacit and informal
performance criteria and standards
and stakeholder expectations.
3. Understanding if there is a shared contri-bution
story and, if not, identifying vari-ety
of stories used by analysis of qualitative
data.
Identifying what performance
standards are/were anticipated and
regarded as legitimate.
4. Identifying what kind of evidence would
be needed to support these stories through
logical analysis and literature review of
related approaches.
Identifying what data would
be needed to determine actual
performance standards.
5. Identifying the available evidence (made
available by the auditee, wider stakehold-ers
and literature).
Identifying what the available
evidence shows and what evidence is
regarded as robust and appropriate by
stakeholders.
6. Filling any essential evidence gaps using
appropriate methodologies and within the
budget constraints of the audit.
Identifying and collecting
additional evidence, including that
on unanticipated outcomes and
comparator data.
7. Weighing the strength of the available evi-dence
(assessing evidence for its independ-ence,
validity, replicability, etc).
Developing a performance judgement
based on a credible account of the
contribution made and minimising
the uncertainties surrounding this
contribution.
8. Providing an analysis of the varying stories
and their evidence base.
Producing the final audit report.
2.7 Conclusion
Using Mayne’s contribution story approach
to underpin a framework for understanding
the contribution of public services provides a
pragmatic and non-arbitrary basis for support-ing
performance audit judgements that should
be widely held as legitimate. It simultaneously
ties the data collection and analysis to the
world view of practitioners and it provides a
methodological basis that addresses the prob-lems
of studying unique events, unfolding
interventions and activities that might have
multiple meanings and purposes.
26.
PERFORMANCE AUDIT HANDBOOK
11
CHAPTER 3
Building your own toolkit and
capacity set Tom Ling
3.1 Fundamental questions in
performance audit
In Chapter 1 we outlined the claim that cur-rent
trends in public services are creating a
more demanding terrain for performance
auditors and prompting the need for more
sophisticated methodologies. In Chapter 2 we
outlined a pragmatic approach that perform-ance
audit might adopt in relation to this chal-lenge.
However, despite this proposed response
to the shifting architecture of accountability
and improvement, the fundamental questions
of performance audit remain unchanged.
Individual studies may focus on one or other
of these but there are essentially six questions
to be asked.
1. Relevance: Given the aim of the policy,
was this the best way to deliver it? In
modern governance the instruments
available are extensive and include hier-archy,
professional empowerment, con-tractual,
market, network-building, and
research. Performance auditors want to
understand the evidence base behind the
selection of instruments.
2. Process evaluation: What processes have
been used, what was intended, what hap-pened,
and what have we learned?
3. Efficiency: Have resources been secured
at the right price and have they been
made available at the right time and in
the optimal quantities?
4. Effectiveness: Have resources and proc-esses
been used to achieve the intended
outputs?
5. Utility: Are the outputs and the intended
outcomes and benefits of value and, if so,
to whom?
6. Sustainability and social acceptance: Will
the outcomes fit with the wider socio-economic
drivers of change to produce
desirable and socially acceptable long-term
change?
Answering these questions requires data
collection and analysis activities (the third
column in the diagram below), but in consid-ering
what toolkit might be needed for this,
it is important to understand how these ques-tions
fit within the fundamental questions of
performance audit.
Within this framework, what should find
its way into the suite of methodologies avail-able
to the performance auditor? The choice
of a particular approach/methodology is lim-ited
by three constraints (cf Bamberger et al.,
2006).
Time and budget availability. At the
National Audit Office, for example,
Value for Money studies (the NAO term
for performance audit) often take place
over a 10-week period, which dictates
the scope of the study as well as to some
extent the choice of methodologies.
For example, methodologies that take
longer to set up and run than is available
within the time allocated for the study
may be avoided. The trade-off between
addressing matters of current importance
in a timely manner and adopting the
most academically appropriate one is real
and inevitable. Additionally, the available
27.
RAND Europe 3:Building your own toolkit and capacity set
Figure 3.1: Framing the fundamental questions of performance audit
Contextual
conditions and
developments
12
Interests
Timeliness,
Interests
Timeliness,
relevance, feasibility,
democratic concerns
relevance, feasibility,
democratic concerns
Audit
Audit
Purpose
Purpose
Aims of performance
Aims of performance
audit
audit
Objectives
What audit topic will
do, by when, for
Objectives
What audit topic will
do, by when, for
whom
whom
Inputs
Inputs
What resources are
required to deliver?
human, financial,
reputation and time
What resources are
required to deliver?
human, financial,
reputation and time
Throughput
What processes are
required to deliver?
admin, contractual,
Throughput
What processes are
required to deliver?
admin, contractual,
market etc
market etc
Outputs
What are the
consequences for
stakeholders?
Outputs
What are the
stakeholders?
consequences for
Outcomes
Initial and long-term
Outcomes
Initial and long-term
impact
impact
Wider drivers
What might be
Wider drivers
What might be
intended and
unintended side-effects?
intended and
unintended side-effects?
Wider-socio-economic
context
Topic selection
and purpose
5
4
2
Performance audit
questions
Data collection
and analysis
Contextual
conditions and
developments
1
Relevance
Utility
6
Sustainability and social acceptance
Effectiveness
3
Efficiency
Process evaluation and
implementation logic
28.
PERFORMANCE AUDIT HANDBOOK
13
suite of methodologies is also inevitably
limited due to the budget available for the
study as well as to their underlying costs.
Performance audit cannot be immune
to a cost-benefit analysis and therefore
trade-offs between costs and robustness
are likely.
Availability of data. Data is more readily
available to answer some performance
questions than others. More sophisticated
methodologies, such as financial analysis
or modelling exercises, may be difficult to
complete because data collected for one
purpose is not suitable for another – for
example a performance audit. This may
lead to a pragmatic use of secondary
analysis of data with the likely result that
there will be more descriptive findings. In
addition, the problem of poor and patchy
data leads to the adoption of mutually
reinforcing methodologies in order to
triangulate the evidence and produce
robust findings.
Practicality of passing the clearance
process and securing legitimacy.
The choice of methodologies is also a
function of practical factors such as the
ease with which certain methodologies
pass the clearing process and will be
regarded as legitimate. Tried and accepted
methodologies might create fewer
difficulties and ensure that discussion is
focused on accountability and learning
rather than methodology (which would
most probably be unrewarding for both
citizens and practitioners).
These are real and in some senses inevitable
constraints. However, in building capacity,
performance auditors can address (but not
remove) these in the longer term.
3.2 Building capacity to select
and use the most appropriate
methodologies
To an important degree, the constraints listed
above are external to the performance audit
organisation. However, there are measures that
performance audit bodies can take to mitigate
these constraints:
Poor data availability. Poor data
availability is the consequence of a mix
of factors and circumstances, but not all
of these are external to the audit body.
Most significantly, the ad hoc nature
of many performance audits acts as a
disincentive to the regular collection of
data. The development of a data strategy
would allow auditors to collect and
store data on a regular basis to provide
a set of longitudinal data capable of
strengthening a range of studies. There
is a cost associated with this and it could
be seen to distract from the performance
auditor’s core business, but there may also
be important benefits.
Diversity and mix of skills. It is unlikely
that any audit body would commit the
resources needed to fully cover the mix
of skills required to successfully use every
methodology listed in this handbook.
However, a strategy for developing in-house
skills and identifying which skills
to outsource would improve the options
open to audit bodies in the longer term.
This would also allow external consultants
to identify opportunities and to develop
their own capacities.
Use of methodologies and associated
buy-in from the service deliverers. In
the public sector, performance auditors
frequently have auditees who themselves
have considerable analytical capacity. On
the one hand, it would be a poor use of
public money to ignore a potential source
29.
RAND Europe 3:Building your own toolkit and capacity set
14
of research and analysis. On the other
hand, performance auditors must be able
to independently verify their findings
and there is a danger that data produced
for management purposes might not
be helpful for accountability or lesson-learning
purposes.
However, performance auditors also face chal-lenges
that they have less control over. One in
particular can be the endless reorganisation
of the service they audit. There is no basis
for arguing that, for the convenience of per-formance
auditors, public services should be
obliged not to change but, conversely, public
services that constantly reorganise can be
hard to audit. Accountability can be easy to
evade and lessons hard to learn. With multiple
restructurings occurring, performance audi-tors
have to rediscover who is responsible for
what, and more importantly, staff has to work
on rebuilding the confidence with their new
counterparts in the auditee.
3.3 Tailoring the performance audit
toolkit
Not all performance audit bodies have the
same requirements. They might require a
distinct mix of the methods outlined here
but they might also require some additional
methodologies to meet their circumstances.
Tailoring the toolkit should involve discrete
steps.
First, it is necessary to map the core busi-ness
of the performance audit body. For exam-ple,
this could be done in the form of a value
tree. In this section we draw upon collabora-tive
work between RAND Europe and the UK
National Audit Office HMRC (Her Majesty’s
Revenue and Customs) team to illustrate the
steps required. In the broadest sense on the
cost side, these performance areas are the costs
incurred by HMRC in administering the tax
system and the costs to taxpayers of comply-ing
with the tax code. On the benefit side, the
areas of performance include higher rates of
compliance, savings that HMRC makes and
improvements in service delivery (see Figure
3.2).
Subsequently, the RAND Europe study
team identified a range of performance indica-tors
in each sub-area. These performance indi-cators
are published in the annual reports of
other tax administrations and in reports by the
Organisation of Economic Cooperation and
Development (OECD). Two RAND Europe
publications have analysed these indicators in
depth and the RE study team took the indica-tors
from these reports (van Stolk and Holmes,
2007, van Stolk et al., 2006). The main pur-pose
of including these indicators is to show
how other tax administrations assess perform-ance
and what specific aspects of performance
they are measuring.
Finally, we listed a range of methodologies
that could be used to gauge performance for
each sub-area. The methodologies are not spe-cific
to certain performance indicators; mostly
more than one methodology can be used in
a sub-area or even to measure a specific per-formance
indicator. Rather, the list represents
a range of methodologies that can be used in a
specific performance area.
From this, it is possible to develop a set
of diagrams that trace the sorts of high level
methods that might be required in this area of
performance auditing. Below this level we can
see how we might dig deeper into costs and
then benefits (figures 3.2-3.6).
RAND Europe 3:Building your own toolkit and capacity set
Figure 3.3: The area of costs in the toolkit
16
32.
PERFORMANCE AUDIT HANDBOOK
17
Figure 3.4: The area of benefits (compliance) in the toolkit
PERFORMANCE INDICATORS
Timeliness
Accuracy
Completeness
% of (people/ business) filing on time (CA)
% of tax refunds made within x weeks/ months
% of returns received on time (AU)
% of tax returns that are processed and finalised in a tax
year (GER)
% of tax records processed in a year (USA)
METHODS
Observational
analysis
Economic modelling
Primary review cases
Financial data
analysis
Sampling
Case studies
Registration
Coverage
Registering
Tax Return
Payment/
Debt
Recovery
% of (people/ business) paying on time (AU)
Annual gross debt to total annual revenue collections (%)
(AU)
Arrears as a % of total revenues (AU)
Value of tax audits to net revenue collection (OECD)
Total time employed in responding to changes in customer
specific circumstances (eg changes in the type of business
or structure of labour)
% of tax files processed accurately
Total incomplete forms to total forms received (AU)
Average time of appeal and claim proceedings (SP)
Actions on fraud plots false bills (ref. over realised) (SP)
Estimated tax gap (USA)
Number of tax payers registered (CA)
Number of tax payers declaring a second income (%
moonlighters)
Estimation of % of tax payers not registered (% ghosts)
Under-payment
Over-payment
Benefits
Improve
Compliance
33.
18
RAND Europe3: Building your own toolkit and capacity set
Figure 3.5: The area of benefits (customer service) in the toolkit
PERFORMANCE INDICATORS
Timeliness
Accuracy
Completeness
% of (people/ business) filing on time (CA)
% of tax refunds made within x weeks/ months
% of returns received on time (AU)
% of tax returns that are processed and finalised in a tax
year (GER)
% of tax records processed in a year (USA)
METHODS
Observational
analysis
Economic modelling
Primary review cases
Financial data
analysis
Sampling
Case studies
Registration
Coverage
Registering
Tax Return
Payment/
Debt
Recovery
% of (people/ business) paying on time (AU)
Annual gross debt to total annual revenue collections (%)
(AU)
Arrears as a % of total revenues (AU)
Value of tax audits to net revenue collection (OECD)
Total time employed in responding to changes in customer
specific circumstances (e.g. changes in the type of business
or structure of labour)
% of tax files processed accurately
Total incomplete forms to total forms received (AU)
Average time of appeal and claim proceedings (SP)
Actions on fraud plots false bills (ref. over realised) (SP)
Estimated tax gap (USA)
Number of tax payers registered (CA)
Number of tax payers declaring a second income (%
moonlighters)
Estimation of % of tax payers not registered (% ghosts)
Under-payment
Over-payment
Benefits
Improve
Compliance
34.
PERFORMANCE AUDIT HANDBOOK
19
Figure 3.6: The area of benefits (savings) in the toolkit
HMRC
Taxpayer
Productivity gains of x% per year (UK)
Value of tax audit assessments to total net revenue
collection (AU)
Calculation gap: difference between estimated real costs
(NL)
Employee satisfaction (GER)
Number of staff performance above average (NL)
Taxpayer satisfaction (AU) (USA)
Amount of time spent on filing taxes (USA)
METHODS
Activity based costing
Financial data
analysis
Process mapping
Simulation
Standard cost
modelling
Focus groups
Surveys
Benefits
Savings
PERFORMANCE INDICATORS
35.
RAND Europe 3:Building your own toolkit and capacity set
3.4 Concluding remarks
This approach to tailoring the performance
audit methodology toolkit is still a work in
progress. In the illustration referred to in this
chapter, the NAO may edit this output and
may customise particular elements of the
toolkit, for instance by making the perform-ance
20
indicators as relevant as possible for the
HMRC context. It should not be taken as the
NAO view but it provides an illustration of the
way in which each subsequent chapter might
be used. It does, however, reflect our under-standing
at RAND Europe, although this is
presented here as a basis for further discussion.
It suggests how audit institutions and the
teams within them might build up a coherent
approach to selecting a suite of methodologies
to which they wish to have access.
36.
PERFORMANCE AUDIT HANDBOOK
21
CHAPTER 4
Benchmarking Philip-Bastian Brutscher
4.1 Key points
Benchmarking is a method of comparing
performance or processes across and
between organisations, policies or policy
systems, and across or between countries.
Benchmarking in the public sector is used
to identify and learn from best practice.
Benchmarking follows a five-step
procedure, and is an iterative process.
4.2 Defining benchmarking
The traditional definition of benchmarking is
“the continuous process of measuring [outputs
and processes] against the toughest competitors
[…]”. We expand that to describe benchmark-ing
as a way of comparing outcomes, processes
or systems. The core idea is to learn through a
structured process of comparison.
Benchmarking originated in the private
sector in the 1980s, when the Xerox Corpora-tion
realised they had to study their competi-tors
to find out why they were losing market
share. The disturbing results led to the com-pany
adopting a systematic process of compar-ing
factual data across a range of performance
dimensions (How big is the gap?) and practices
or processes (What are they doing differently
– and better – than us?). The impact of this
approach on Xerox is widely held to have been
critical, not least because it warned “of a crisis
before that crisis actually overtook and inca-pacitated
the firm” (Bessant and Rush, 1998).
The main objectives of using benchmark-ing
in the public sector context are:
to get a general idea of what is being
done, how and with what outcome across
different public sector organisations/
policies/policy systems
to compare the specific performance/
processes of certain public sector
organisations/policies/policy systems
to generate ideas of what can be done,
how and with what outcomes.
There are several types of public sector bench-marking,
the most prominent being:
performance benchmarking, which
compares the performance (in terms
of outputs and outcomes) of different
entities and assesses whether they
make efficient and effective use of their
resources compared to similar entities
process benchmarking, where the
processes and procedures of entities that
are likely to lead to different outputs and
outcomes are analysed and compared
domestic benchmarking, which compares
the performance and/or processes of
similar entities within one country
international benchmarking, which
compare entities from different countries.
Another way of looking at benchmarking
is in terms of the subject of the evaluation.
Groenendijk (2004) distinguishes between the
benchmarking of public sector organisations,
public policies and policy systems, and points
out that the focus of benchmarking public
sector organisations is typically on processes
and/or outputs, whereas benchmarking public
policy is concerned with policy outcomes
(such as economic growth, unemployment,
etc). The main difference between benchmark-ing
public policies and benchmarking policy
systems is that policy systems deal with a
multitude of policy outcomes, whereas policy
37.
RAND Europe 4:Benchmarking
benchmarking typically involves a single set of
coherent policy outcomes.
4.3 When to use benchmarking and
22
when not to use it
Benchmarking is applicable in any situation
where separate entities or activities need to be
compared in order to identify and learn from
best practice. The key question is what type of
benchmarking is most appropriate, and will
yield the most useful information.
4.3.1 Performance vs process
benchmarking
The question of whether to use performance
or process benchmarking depends largely on
the objective of the evaluation. If the objec-tive
is to compare the overall performance of
similar organisations/policies/policy systems,
then performance benchmarking is the more
appropriate choice. If, on the other hand, in
the objective is to examine and compare stand-ard
processes (such as the way complaints are
handled), process benchmarking is a better
method.
However, evaluation objectives are not the
only consideration when deciding between
performance and process benchmarking.
Another factor is the complexity of the out-come
being benchmarked – the more compli-cated
the outcome, the less likely it is that we
can rely on standards or results benchmarking
alone, and the more important it is that we go
into the process or processes that contribute to
performance. For instance, while it may be dif-ficult
to benchmark illiteracy, it is far easier to
benchmark the performance of public librar-ies.
Similarly, it is easier to benchmark dif-ferent
organisations involved in conventional
training than to benchmark unemployment.
4.3.2 Domestic vs international
benchmarking
The main reasons for using international com-parators
include:
a lack of similar domestic comparators
evidence of exceptional international
examples (in terms of performance/
processes)
the goal of the benchmarking exercise
being to generate ideas of what can be
done, how and with what outcomes.
There are a number of potential problems
with international benchmarking. One is
that, whereas the institutional environment
in which the different units operate in domes-tic
benchmarking is identical or similar, the
same cannot be claimed for international
benchmarking. As a result, the findings from
an international benchmarking exercise must
be analysed more carefully and implications
should be drawn with caution.
Another potential problem of inter-national
benchmarking is that it requires
greater attention to data issues than domestic
benchmarking, since “definitions, concepts,
ways of data collection differ largely between
... countries (notably between the US, Japan
and Europe)” (Polt et al., 2002). This problem
is aggravated by the fact that internationally
comparable statistics are not available for most
processes underlying the development of per-formance.
One implication, therefore, is that
international benchmarking must aim at being
cooperative. In cooperative benchmarking, the
parties involved exchange first-hand informa-tion
with the aim of mutually beneficial learn-ing.
In competitive benchmarking, on the
other hand, one is often restricted to secondary
sources of information and statistics. Polt et al.
(2002) find that “[c]ountries often hesitate to
enter benchmarking exercises if they fear to be
ranked in league tables”.
38.
PERFORMANCE AUDIT HANDBOOK
23
4.3.3 Public sector vs public policy vs
policy system benchmarking
When it comes to benchmarking public sector
organisations, public policies or policy sys-tems,
there are again a number of factors that
influence which type of benchmarking should
be used. Since public sector benchmarking is
mainly concerned with process and short-term
output (performance) benchmarking, whereas
public policies and policy systems are con-cerned
with long-term outcome (performance)
benchmarking, as suggested by Groenendijk
(2004), our understanding of benchmarking is
one such factor.
While processes and outputs tend to occur
immediately and, therefore, allow benchmark-ing
of public sector organisations at all times,
outcomes (such as improvements in unemploy-ment)
tend to occur with a significant time-lag
and so delay the benchmarking process of
public policies and policy systems. Related to
this, whereas it is relatively easy to attribute
processes and outputs, it is much harder to
attribute outcomes to a certain public policy
and/or policy system because of the many
other factors that may influence outcomes over
time (Brutscher et al., 2008).
This suggests that, whereas it may well be
possible to benchmark processes and outputs of
public sector organisations in the short term, if
we are interested in the longer-term outcomes
(or processes in a different institutional set-ting),
benchmarking must be understood as
a continuous learning process that identifies
examples of good practices rather than best
practice (Camp, 1989).
Of course, we may also be interested in
benchmarking the outcomes (rather than
outputs and/or processes) of public sector
organisations. In this case, the same problems
of timing and attribution apply and so the
same broader understanding of benchmarking
should be used. The severity of the problem
in public sector organisations varies depend-ing
on the level of aggregation – ranging from
activity levels to unit levels to organisational
levels. Empirical evidence suggests that the
lower the level of aggregation, the higher the
chance that activities other than the one being
benchmarked are included and falsely attrib-uted
(Georghiou, 2002).
4.4 How to conduct a benchmarking
project
A five-step model can be applied to public
sector benchmarking, viewing it as, in princi-ple,
an iterative process (Groenendijk, 2004).
Planning: determining what is to be
benchmarked, identifying benchmarking
partners, generating data.
Analysis of data: establishing
performance/gaps.
Integration: communicating benchmark
findings, developing plans to overcome
performance gaps.
Action: implementing measures to
enhance performance.
Monitoring: observing and recording
progress, recalibrating the benchmarking
process, feeding back into the planning
stage of the next cycle.
4.4.1 Planning
The first step comprises a number of activities:
deciding on the objective for the benchmark-ing
exercise; finding out which organisations
(or units thereof ), policies or policy systems
carry out similar activities or have similar func-tions
– that is, they are suitable comparators;
and collecting appropriate data.
The main factors that should go into
choosing benchmarking comparators or part-ners
are the availability of relevant and reliable
comparative information (Is a comparator pre-pared
to provide the necessary information?)
and associated costs (What is the added value
39.
RAND Europe 4:Benchmarking
and cost of including an additional bench-marking
24
partner?). As a rule of thumb, it is
unlikely that one comparator is superior along
all benchmarking dimensions, so the number
of benchmarking cases should increase as the
degree of complexity increases (eg going from
public policies to policy systems).
We can use a number of methods to collect
data. The most prominent are key informant
interviews, focus groups, workshops, surveys,
documentary and file reviews and visits (for
process mapping). The exact method depends
on the availability of data and access to people
with information. In addition, it is important
to bear in mind that different methods come
with different costs. As a consequence, it is
typically advisable to start with desk-based
research (which is less resource intensive) and
to complement this with primary data analysis
only where no prior data exists.
4.4.2 Analysis of data
The key questions for analysing benchmarking
partners are as follows. What are the differ-ences
and similarities between the partners?
What are examples of good and bad practice?
What factors seem to make a difference? What
alternative explanations are there? What is the
context of the results (for example, what social,
economic or political environments influence
the outputs/processes/outcomes of the bench-marking
partners)? What changes are likely to
lead to improvements? What are the associated
costs?
4.4.3 Integration, action and
monitoring
Steps one and two represent basic activities in
a formal process of benchmarking. On their
own, however, they result in little more than
an indicator of where something stands in
relation to others – providing a league table
or performance indicator. To be a tool for
learning, the results need to be communicated,
recommendations formulated and implemen-tation
plans devised (including timescales and
resources required). These plans then need
to be continually monitored and updated.
Furthermore, it is important to keep in mind
that best practice is a dynamic concept and that
what is being benchmarked against is unlikely
to have stood still (Groenendijk, 2004).
4.5 International benchmarking
in action – comparing hidden
economies
The UK National Audit Office (NAO) com-missioned
RAND Europe to carry out a study
placing the performance of HM Revenue
Customs in tackling the hidden economy in
an international context. The study also sought
to identify good practices used by other tax
authorities that could be adopted by the UK
(van Stolk et al., 2008).
The hidden economy affects everyone.
Honest businesses suffer from unfair com-petition
from those in the hidden economy.
People working in the hidden economy do not
benefit from the protection of employment
legislation. Customers of people working in
the hidden economy do not get guarantees for
work carried out or have no legal recourse for
poor quality work. From a government point
of view, the hidden economy can lead to:
tax losses
benefit fraud, where unemployed people
are engaged in undeclared work while
claiming benefit
avoidance of employment legislation,
such as minimum wage agreements or
health and safety and other standards in
the workplace.
Tax authorities tackle the hidden economy
to reduce the amount of tax revenue lost
and to improve fairness for taxpayers who
40.
PERFORMANCE AUDIT HANDBOOK
25
comply with their obligations. There are vari-ous
definitions for the hidden economy; for
example, some include within their definition
all forms of undeclared income, while others
include only undeclared cash transactions. Tax
authorities also use different terms, such as
“underground”, “hidden”, “black”, “shadow”
or “cash” economy, to describe income that is
undeclared for tax purposes.
In the first stage of the project, the NAO
study team and the RAND Europe project
team agreed on the objective of the study and a
template of questions to be used for the coun-try
reviews, as well as selecting five countries to
be reviewed. The template closely followed the
following categories:
general description of the revenue system
and organisation of each country
definition and measurement of the
hidden economy
strategy of tax authority
key initiatives used by the tax authority
results of initiatives.
The countries selected for comparison were
Australia, Canada, Belgium, Sweden, and
the United States. The selection of the coun-tries
took into account a number of criteria,
including:
similar demographics to the UK
similar size of economy (GDP per capita)
similarities in the set-up of the tax
authority
the availability of data and information/
research on the hidden economy and
initiatives of tax authorities (given the
short timeframe and budget constraints of
this research, the RAND Europe project
team felt that the study should focus on
cases where data and information was
more readily available from publications
and web resources)
variation in hidden economy indicators
(some countries with a larger hidden
economy, some with similar levels to the
UK, and others with a lower level)
evidence of interesting or innovative
practices.
The data collection proceeded in two stages. In
the first stage, members of the RAND Europe
team were assigned countries according to their
nationality, relevant experience and language
skills. The team undertook an initial search to
collate easily identifiable information through
desk-based research, to identify potential
sources and to establish contacts for less easily
available information. Sources included:
government, tax agency and policy
publications in the respective countries
documents from international
organisations such as the OECD and
IMF
documents from international Supreme
Audit Institutions
documents from supra-national
organisations such as the European Union
publications from institutes involved in
tax authority reform, such as the Taxation
Institute of Australia and the Institute of
Fiscal Studies in the UK
other academic databases such as JSTOR
and SSSR.
A mid-project meeting allowed the RAND
Europe team and the NAO study team to
share findings, identify difficult areas, draw out
emerging themes for wider analysis, compare
understanding of the questions in the template
and identify areas for further investigation. The
RAND Europe team then refined their investi-gation
through further document analysis and
through personal contact with informants in
the countries selected. The interaction with the
contacts ranged from phone calls to sending
41.
RAND Europe 4:Benchmarking
e-mail inquiries for verification or additional
information.
26
In the next phase, the RAND Europe
project team synthesised the research and
prepared the final deliverable, which consisted
of a thematic comparative overview of the
evidence found in the selected countries. The
comparative analysis and reporting were struc-tured
around the following themes:
estimating the size of the hidden
economy
tax authorities’ strategies and organisation
encouraging people into the formal
economy
detection
sanctions.
The findings were communicated to HM
Revenue Customs by the NAO project
team, recommendations were formulated, and
implementation plans sketched out. The NAO
continues to monitor developments following
the project.
4.6 Summary
Over the past 30 years, benchmarking has
become one of the most prominent evaluation
methods. This is due, at least in part, to its
conceptual simplicity. However, it is important
to bear in mind that, despite this, an evaluator
wishing to use benchmarking has to make a
number of important decisions. These include
what type of benchmarking to employ, what
benchmarking partners to choose, what data
to collect, how to analyse the data, and how to
communicate results, formulate recommenda-tions
and monitor their implementation.
4.7 Further reading
Balzat, M., Benchmarking in the Context of
National Innovation Systems: Purpose and
Pitfalls, Vokswirtschaftliche Diskussion-sreihe,
Augsburg, Germany: University of
Augsburg, 2003.
Bessant, J. and H. Rush, Benchmarking Frame-work
Conditions, Paper prepared for the
Benchmarking co-ordination Office,
1999.
European Commission, First Report by the High
Level Group on Benchmarking. Benchmark-ing
Papers No.2; EC-Directorate General
III – Industry, 1999.
Garcia-Ayuso, M. and P. Sanchez, On the
Need to Measure Intangibles to Improve the
Efficiency and Effectiveness of Benchmark-ing
Policy Making, MERITUM Project,
Mimeo, 2001.
Lundvall, B.A. and M. Tomlinson, Interna-tional
Benchmarking and National Inno-vation
Systems, Report for the Portuguese
presidency of the European Union, 2000.
Paasi, M., “Benchmarking Policies – Collec-tive
Benchmarking of Policies: An Instru-ment
for Policy Learning in Adaptive
Research and Innovation Policy”. Science
and Public Policy, Vol. 32, No. 1, 2005,
pp. 17–27.
Tomlinson, M., Policy Learning through
Benchmarking National Systems of Compe-tence
Building and Innovation – Learning
by Comparing. Report for the Advanced
Benchmarking Concepts ABC project,
European Commission, 2001.
42.
PERFORMANCE AUDIT HANDBOOK
27
CHAPTER 5
Delphi exercises Sharif Ismail
5.1 Key points
Delphi exercises are a structured way
to collect large amounts of qualitative
information from experts in fields
relevant to the issue being examined.
Delphi exercises use ranking, scoring and
feedback to arrive at consensus on an
issue or a set of issues.
Delphi exercises are not aimed at
predicting the future.
5.2 Defining a Delphi exercise
The Delphi method is a means for collecting
large quantities of qualitative information –
principally expert opinion – in a structured
fashion. In its conventional, “pencil and paper”
form, the Delphi method involves issuing
questionnaires to participants in which they
are asked to rank a series of items (in order
of importance, likelihood of occurrence, etc)
over a number of rounds, interspersed with
feedback collection. The exercise is usually
conducted remotely; there is no requirement
for participants to be brought together in one
place. The aim in most instances is to drive
participants to consensus on the ranking of a
set of issues, factors or events, but the method
can be used in a more open-ended manner to
reveal a range of options instead.
Broadly speaking, Delphi exercises involve
four phases.
1. Exploration of the subject under
discussion.
2. Reaching an understanding of how the
group understands an issue through an
iterative process of ranking and scoring.
3. Exploring where disagreements have
occurred between participants – and the
reasons underlying these disagreements.
4. Final evaluation – where all previously
gathered data has been reviewed.
In the context of performance audit exercises,
the Delphi method has a number of particu-larly
advantageous features. First, it provides
a structured means of collecting large bodies
of qualitative and quantitative data1 in areas
in which other forms of evidence may be thin
on the ground. This can be particularly useful
when scoping potential performance indicators
in an unfamiliar setting. Second, by helping to
bring participants towards consensus, it ena-bles
users to prioritise lists of possible perform-ance
audit options in a structured manner.
This could be applied at both the early stages
of a project, to identify key audit questions,
and at the concluding stages, to help prioritise
recommendations.
How does the Delphi method differ from
other consultative techniques (such as work-shops
and focus groups), and what advantages
does it have over them?
Larger exercises frequently yield a
statistical group response, the results
of which can be subjected to further
analysis. This is not the case for focus
groups and many other consultative
approaches. Typical sample sizes for
1 Qualitative data collected from Delphi exercises
can include open-text responses to questions. From a
quantitative perspective, ranking lists produced by Delphi
participants can be analysed statistically in a number of
ways, ranging from basic descriptive statistics to more
advanced measures of decisionmaking reliability between
rounds, and preference differences between individuals.
43.
RAND Europe 5:Delphi exercises
28
Delphi exercises lie in the range of 30–
120 participants.
The Delphi approach provides anonymity
for participants, which helps to ensure
that group pressures are less of a factor
in decisionmaking than they are in
workshops, focus groups and many other
consultative exercises.
In contrast to focus groups and other
face-to-face consultative approaches,
there is no requirement that participants
are physically present when the Delphi is
run. Instead, they can provide feedback at
their own convenience (within limits).
Feedback can be collected in a structured
way between rounds – meaning that the
questionnaire can be adjusted if particular
issues have not been taken into account,
in a way that would be very difficult if
not impossible using other methods, such
as a conventional survey.
5.3 When to use a Delphi exercise
The conditions under which Delphis are most
commonly used include occasions where:
The issue at hand does not readily lend
itself to precise analytical techniques:
this occurs particularly in those instances
where the evidence base is fragmented,
patchy or even non-existent.
Subjective judgements gathered on a
collective basis could help to inform
decisionmaking: in the context of
performance audit, this is most relevant
in two instances: (1) where the terms of
the audit are not clear; and (2) where
normatively defined terms are involved
as an important basis for evaluation (eg
“sustainability”, “quality” and so forth)
and it is important to clearly define
these terms for the audience at hand by
engaging expert opinion.
More individuals are needed than can
readily be accommodated in a face-to-face
engagement, such as a workshop:
in complex fields, or for large-scale
audits, it may be that a large number of
stakeholders need to be involved, and
short of a full-scale survey, the Delphi
method provides perhaps the most viable
method for integrating them.
Required participants cannot easily
be brought together in one location:
especially where some are based abroad.
Disagreements between individuals are
such that face-to-face contact becomes
difficult: this situation could arise in
politically sensitive areas, where it is
important to ensure engagement and
exchange between stakeholders, but face-to-
face meetings would not be considered
advisable.
5.4 What a Delphi exercise is not
Despite the symbolic resonance of its name,
the Delphi method is not a way of “predicting
the future”. Though often considered part of
a tool-box of futures methodologies, it is in
reality simply a method for gathering expert
responses and providing feedback to them in a
structured fashion. Its occasional use for what
appear to be predictive exercises – mainly to
anticipate immediate developments in high
technology industries or scientific research –
masks the fact that these statements merely
reflect expert opinion rather than a well-evi-denced
vision of future realities.
Nor is the Delphi method a robust replace-ment
for a large-sample survey. In general, it is
inappropriate to use this methodology when
a very large number of stakeholders are to be
involved (ie more than 200).
44.
PERFORMANCE AUDIT HANDBOOK
29
5.5 How to conduct a Delphi
exercise
In this section we review both the basic
approach to a Delphi exercise, and a series of
modifications that may be considered based on
specific requirements.
5.5.1 Basic Delphi exercise
A basic Delphi exercise involves six steps.
1. Decide whether a Delphi is the most
appropriate method to use. In the con-text
of a performance audit, a Delphi
offers the greatest potential at the prob-lem
formulation and findings assessment
stages, where a number of alternative
appropriate methodologies exist. These
include scenarios, stakeholder workshops,
multi-criteria decision analyses (MCDAs)
and so forth. The merits of each method
need to be considered carefully before
opting for a Delphi.
2. Identify the question. It is important to
be clear precisely what the objectives of the
exercise are. Is the aim to produce consensus
on the conceptual approach to a perform-ance
audit problem? Or is the intention
instead to get a sense of the range of possible
approaches to a particular problem? Subtle
modifications can be made to the process
to take account of each of these aims.
3. Identify the experts. This step is com-plicated
by the difficulty of identifying
those individuals who may be considered
“experts” in a particular field. For within-discipline
exercises, this may not present
a problem, but it becomes trickier when
questions cross obvious disciplinary
boundaries. The key is to be clear about
the rationale for selecting your group of
experts.
4. Pre-Delphi exercise to formulate the
questionnaire. The pre-Delphi exercise
provides the material for the questionnaire.
Identify the question
Identify the experts
Pre-Delphi exercise:
Ask experts the agreed
question and collect
responses
Collate responses and
arrange into categories
Questionnaire 1: Ask
experts to rank categories in
order of impact/importance
Questionnaire 2: Show
experts ranking of the group
and ask for adjustments
and/or comments
Synthesise comments and
incorporate into
questionnaire
Consensus reached
By putting the question to the identified
experts and soliciting their responses to
it, a rich initial data set of interpretations
can be gathered. The list of responses is
then collated and arranged into a set of
categories that experts can rank in future
rounds – this forms the basis of the
questionnaire.
5. Run the multi-round Delphi exercise.
Once the first–round questionnaire is
45.
RAND Europe 5:Delphi exercises
30
drawn up, the exercise can be launched.
A mechanism for summarising the results
for participants between rounds is needed,
and most commonly this is done through a
series of histograms, showing the distribu-tion
of rankings. This element of feedback
may or may not influence the judgement
of the participants in further rounds.
6. Collect and analyse the results. Depend-ing
on the particular approach chosen, a
Delphi exercise will yield either (a) a ranked
hierarchy of options, or (b) an unranked
range of possible options. Importantly,
though, the way results are collected from
the participants may also enable further
analyses to be performed on the results.
The approach outlined above is best described
as a “conventional” Delphi. Since its inception,
a host of modifications have been developed to
respond to specific qualitative data collection
requirements, and whether one of these modi-fications
might be more appropriate to current
auditing needs than a conventional approach
should be considered. Each offers specific
advantages in particular situations.
5.5.2 Delphis with pre-defined goals
Rather than involving participants in a costly
and time-consuming pre-Delphi goal-setting
exercise, it may be easier to launch the ques-tionnaire
directly. This is probably most
appropriate if the issues under analysis are
already well understood. Biasing effects are to
some extent offset by the feedback mechanism
built into the Delphi process, since this ena-bles
participants to suggest additional items
for inclusion if they do not feel that the topic
has been covered from a sufficient number of
angles.
How are questions generated for the
Delphi questionnaire without engaging expert
participants directly? Possible approaches
include:
examining questions and goal sets from
other, similar Delphi exercises conducted
elsewhere
synthesised literature reviews
interviews with key informants (a major
advantage of this approach is that it
may improve participation rates in
later rounds since experts are required
to respond in a focused way from the
outset).
An innovative example of this modification is
the RAND/UCLA Appropriateness Method,
which has become an important tool in the
development of clinical guidelines in medi-cine,
and in deciding on the appropriateness
of particular medical procedures in a variety of
contexts. Further detail on the application of
this method in healthcare is provided in sec-tion
5.6 below.
5.5.3 Rotational Delphis
An important challenge when running large-scale
Delphis is deciding how to deal with large
data sets. It has been observed that participant
attrition rates rise significantly when experts
are asked to rank large numbers of items. In
response to this, a rotational Delphi technique
has been developed by a group of educational
practitioners; it involves splitting large item
sets into smaller groups, which are then rotated
between sub-committees (Custer, Scarcella
and Stewart, 1999). It is important to ensure
that sub-committees are selected in a stratified
way, to comprise a representative sample of the
participants in the whole exercise.
5.5.4 Teleconferencing Delphis
Teleconference Delphis bring a large number
of individuals together at one time while
46.
PERFORMANCE AUDIT HANDBOOK
31
maintaining anonymity. The main advantages
of this method are:
• Live negotiation between individu-als
means that a consistent view of
the assignment is often reached
rapidly.
• It allows greater flexibility in the use
of sources. While conventional Del-phis
tend to encourage participants
to make judgements on the basis of
summary statistics and numerical
forecasts, there is in theory greater
scope for use of other evidence in
the context of a teleconference,
where content can be explained in
greater depth. The range of evidence
might go from the anecdotal (par-ticipant
experiences) to the visual
(PowerPoint presentations, videos,
etc).
• Efficiency, since the time between
each round is considerably reduced.
5.5.5 Online or real-time Delphis
As with teleconferencing, an online or real-time
Delphi is a modification of convenience.
By assigning each participant a login code
(against which their activities on an online
Delphi site can be tracked), it may be possible
to gather more regular participation.
5.5.6 Policy Delphis
Policy Delphis resemble the conventional
model only superficially. In particular, they
exploit the pre-Delphi questionnaire or
brainstorming exercise, with less emphasis
on a drive towards consensus in later rounds.
Instead, policy Delphis are designed to expose
the full range of approaches to a particular
problem or question. They can be particularly
useful during the conceptualisation phase of a
performance audit exercise, before narrowing
down to the most appropriate research ques-tion
using another method.
What stages are there to a policy Delphi?
Because of the need to gather as wide a spec-trum
of opinion as possible, particular atten-tion
should be paid to the way in which the
Delphi is structured. Broadly, this should
include the following steps:
1. formulating the opening research
question
2. exposing the options through opinion
gathering from participating experts
Table 5.1: Comparison between standard and real time (online) Delphi exercises
Type of
consultation
Group
size
Length of
interaction
Number of
interactions
Principal costs Other features
Standard
Delphi
Small to
large
Short to
medium
Multiple,
delays
between
rounds
Monitor time;
clerical and
secretarial
Equal
information
flow to and
from all
Real-time
(online) Delphi
Small to
large
Short Multiple, as
required by
individual
Computer access;
communications
Equal
information
flow to and
from all
Source: Author
47.
RAND Europe 5:Delphi exercises
3. determining initial positions on the
32
issue at hand, and highlighting areas of
disagreement
4. exploring the underlying reasons for these
disagreements
5. evaluating these underlying reasons
6. re-evaluating the options available to deci-sionmakers
on the basis of this review.
In view of the kind of information to be col-lected,
it is important to consider the scales
used to rank items. While most conventional
Delphis rely on a simple numerical rank for
each item, policy Delphis tend to involve rank-ing
items along a number of axes, particularly
because the implications of a policy option
may be unclear. Typically, policy Delphis ask
participants to consider (1) the desirability of a
measure (very desirable, desirable, undesirable,
very undesirable); (2) the feasibility of a meas-ure;
(3) the importance of a measure; and (4)
the confidence of the individual in the validity
of the argument or premise.
5.6 Delphi in action: the RAND/
UCLA Appropriateness Method
in health settings
The Delphi method has been used extensively
in healthcare settings and health services
research. Applications have included efforts
to help determine the most appropriate bases
for performance management, for example a
recent attempt in the UK to develop appro-priate
performance indicators for emergency
medicine (Beattie and Mackway-Jones, 2004).
It has also been used to understand key deter-minants
of innovation in healthcare organisa-tions
(Fleuren et al., 2004), and even to esti-mate
the global prevalence of key disorders,
such as dementia (Ferri et al., 2006).
One of the best-known applications of
the Delphi method in a healthcare context,
however, builds on attempts by the RAND
Corporation in the late 1980s and 1990s
to develop a methodology for assessing the
appropriateness of medical or surgical proce-dures.
This culminated in the development of
the RAND/UCLA Appropriateness Method,
which seeks to combine the best available sci-entific
evidence in a given area with a synthesis
of the opinions of leading experts in that field,
to give a robust assessment of the appropriate-ness
of performing a particular procedure given
patient-specific symptoms, medical history
and test results. In this sense, a Delphi exercise
forms part of a larger, evidence-gathering effort
that includes literature reviews and sometimes
primary research.
The details of the method and its applica-tion
are described elsewhere (see Fitch et al.,
2001, among others); below is an outline of
the major steps in the process.
Stage 1: Select a topic area.
Stage 2: Conduct a review and synthesis
of existing literature in the area in
question.
Stage 3: Develop a list of indications and
definitions.
Stage 4: Assemble an expert panel for the
Delphi exercise.
Stage 5: Develop rating scales for
appropriateness and necessity of use of
the intervention in question.
Stage 6: Run the Delphi exercise to gather
expert scores of appropriateness and
necessity.
5.7 Summary
The Delphi exercise occupies a useful middle
ground between the face-to-face interaction of
individuals in a small group setting (eg a focus
group) and large-scale data collection without
direct contact (eg via a survey). It offers a
robust means for driving groups of individuals
to consensus, and has a range of possible appli-cations
in a performance audit context – most
48.
PERFORMANCE AUDIT HANDBOOK
33
obviously for reaching agreement between
diverse groups of people on appropriate meas-ures
of performance.
5.8 Further reading
Adler, M. and E. Ziglio, Gazing into the Oracle:
the Delphi Method and Its Application to
Social Policy and Public Health, London:
Jessica Kingsley Publishers, 1996.
49.
RAND Europe 6:Discrete choice modelling
CHAPTER 6
34
Discrete choice modelling Dimitris
Potoglou, Chong Woo Kim and Pete Burge
6.1 Key points
Discrete choice modelling is a technique
employed to analyse and predict the
choices individuals make regarding
interventions or services.
It is based on real and hypothetical
choices (revealed preference – RP – and
stated preference – SP – data) regarding
a number of factors that describe
improvement or policy change.
Choice data can be monetised to help
in cost-benefit analysis, used to weigh
up the pros and cons of introducing
or amending particular policies, or as
a source of objective information on a
difficult subject.
6.2 Defining discrete choice
modelling
Discrete choice modelling provides an
evidence-based, quantitative framework that
enables researchers and policy makers to
understand how individuals make choices
when faced with different policy options or a
number of alternative situations. In particular,
discrete choice modelling helps to:
identify the relative importance of the
factors or attributes that drive individual
choice
construct alternative scenarios and predict
public acceptance of policy interventions
or proposed service improvements, or
demand and market shares of products
over the whole population (Ortuzar and
Willumsen, 2001).
The types of research questions that discrete
choice modelling can answer include the
following.
How will people react to changes in price
of services or goods? For example, how
would a change in the price of alcohol
influence demand, or how many people
would stop having regular dental check-ups
as the price increased?
How will people respond to a policy
intervention that involves a new option?
For example, how would patients respond
if they were given a choice between
hospitals, or what would drive people’s
choice of postal provider in a deregulated
postal system?
How do people value the different
attributes of services? For example, how
would people trade off time and cost (eg
travel time, hospital waiting times), or
how much would people be prepared to
pay for improved public spaces?
The trade-offs that customers are prepared
to make when comparing improvements in
service attributes with increases in bill size is
of key interest. Another measure here is will-ingness
to pay (WTP), which expresses trade-offs
in monetary terms that can feed into a
cost-benefit analysis (CBA) framework. An
important outcome of discrete choice model-ling,
which is less frequently reported, is the
accuracy of WTP values, which can be used
to provide guidance on the appropriate confi-dence
intervals for these model outputs.
50.
PERFORMANCE AUDIT HANDBOOK
35
Since discrete choice modelling allows
us to forecast choicemaking behaviour and
demand for alternatives in future scenarios,
discrete choice models can be embedded
within decision support systems to allow analysts
to test the potential impact of different policy
interventions.
6.3 How to conduct discrete choice
analysis
Box 6.1: Data elements in discrete
choice modelling
Attribute: A policy element or a character-istic
of a product or service such as price,
waiting time, tax discount, etc.
Alternatives: The options that were consid-ered
by the individual in making the choice.
These are described by a series of attributes.
Choice set: A finite set of a number of alter-natives
available to an individual.
For example, an individual may consider a
number of different hospitals (alternatives
within a choice set) that can be compared
by describing them in terms of a series of
attributes (eg waiting time, reputation) that
are weighed up when making a choice.
Analysis of individual choice requires knowl-edge
of what has been chosen, but also of what
has not been chosen. This information may be
acquired from Revealed Preference (RP) data
and Stated Preference (SP) data. RP refers to
direct observation of choices that individu-als
have made in real-life situations, whereas
SP data come from hypothetical choices that
individuals are asked to consider in a survey
environment.
In an ideal case, we would develop discrete
choice models using information on choices
made in a real situation. From these data,
we could quantify the influence of particular
attributes or individual characteristics in real
choice contexts (ie revealed preferences). There
are, however, a number of potential problems
with such data (Hensher et al., 2005, Louviere
et al., 2000):
what we think people are considering and
what they are actually considering may be
different
the alternatives that individuals consider
may be ambiguous
the range and variation of the product or
service attributes may be limited
the attributes may be highly correlated
(eg quality and price)
the attributes may include measurement
errors.
Moreover, there might be cases where direct
observation is not possible, because some
alternatives or certain characteristics do not
yet exist (eg new technologies, new policy
interventions, new environmental protection
plans, etc).
These problems could be overcome if we
could undertake real-life controlled experi-ments.
The SP discrete choice experiments
provide an approximation to this, a sort of
quasi-experiment undertaken in a survey envi-ronment
based on hypothetical (though realis-tic)
situations set up by the researcher (Ortuzar
and Willumsen, 2001). The main features of
SP discrete choice experiments are as follows
(Ortuzar and Willumsen, 2001).
51.
RAND Europe 6:Discrete choice modelling
Box 6.2: Elements of discrete choice model estimation
The models are constructed by specifying the range of alternatives that are available to the
decision maker. Each of these alternatives is described with a utility equation.
Decision Rule: Each respondent chooses the alternative that provides them with the highest
utility.
Utility: A function composed of a deterministic and a random component. The deterministic
part of the utility is composed of attributes of the alternative itself and the decision maker.
Each attribute in the deterministic part is multiplied by a coefficient (weight) that reflects the
size of its impact on the decisionmaking process (Ben-Akiva and Lerman, 1985, Train, 2003).
The random component is included on each utility function to reflect unobservable factors in
the utility (this noise encompasses both factors that the analyst does not have insight into, and
inconsistencies in the behaviour of individuals making the choices).
Estimation: The model coefficients are estimated in the model estimation procedure. The
estimation can therefore be conducted within the framework of random utility theory, that
is, accounting for the fact that the analyst has only imperfect insight into the utility functions
of the respondents (McFadden, 1973). The most popular and widely available estimation
procedure is logit analysis, which assumes that the error terms on the utilities are independ-ently,
36
identically distributed extreme values. The estimation procedure produces estimates of
the model coefficients, such that the choices made by the respondents are best represented. The
standard statistical criterion of Maximum Likelihood is used to define best fit. The model esti-mation
provides both the values of the coefficients (the utility placed on each of the attributes)
and information on the statistical significance of the coefficients (Ben-Akiva and Lerman,
1985).
Respondents evaluate hypothetical alternative
options and choose one of the alternatives
within a choice set. The choice decision is
dependent upon the levels offered and indi-viduals’
own preferences.
Each option is a composite package of
different attributes.
Hypothetical alternative options are
constructed using experimental design
techniques. These ensure that the
variation in the attributes in each package
allows estimation of the influence of the
different attributes on the choices made.
Alternative options are understandable,
and appear plausible and realistic.
SP data have many useful statistical properties,
since how the hypothetical choices are pre-sented
can be controlled so that there is little
or no correlation between explanatory vari-ables.
The technique is also data efficient: more
than one choice scenario can be presented to
respondents within one interview. On the
other hand, SP data are based around what
individuals say they would do, which may not
exactly correspond with what they actually do
52.
PERFORMANCE AUDIT HANDBOOK
37
when faced with the same choice or situation
in real life.
Therefore, RP and SP data can be com-plementary.
Information based on RP data
ensures that choices modelled are consistent
with choices made in the real world, whilst
information obtained from SP data can be
used to strengthen the valuations of the rela-tive
importance of attributes, especially those
that do not exist in real choices (Louviere et
al., 2000). For this reason, some studies use
both RP and SP datasets simultaneously in the
estimation of discrete choice models, in order
to draw on the strengths of both data sets.
6.4 Discrete choice modelling in
action (1): revealed preference
data/the London Patient Choice
Project Evaluation
The London Patient Choice Project (LPCP)
was established to improve choices for patients
who were clinically eligible for treatment and
had been waiting for treatment at an NHS
London hospital beyond a target waiting time.
As the target waiting time approached, patients
were given an opportunity to choose from a
range of alternative providers who had the
capacity to offer earlier treatment. The aim of
this study was to investigate patients’ responses
to these options for earlier treatment.
Within this study there was an RP data-set
available that reported patients’ choices to
remain at their home hospital or to seek treat-ment
at an alternative hospital. The sample
included a total of 25,241 records from the
LPCP database up to June 2004.
Figure 6.1: Choice context of London’s
patients
Home
Hospital
Alternative
Hospital
London Patient
Source: Burge et al. (2005)
From the choices made by patients, it was
possible to develop a model of the factors
influencing the choice of hospital, including
information on waiting times (both remain-ing
and elapsed), travel times, reputation,
specialty, patient age and patient gender. Tests
were undertaken to examine whether there
were differences in the valuation of each of the
treatment-related variables between different
types of patients. These tests did not reveal any
significant difference in waiting time or travel
distance between different socio-demographic
groups of patients.
Analysis using discrete choice modelling
showed that patients tended to minimise their
waiting and travel time while trying to obtain
treatment at a hospital known to offer a high
quality of care (Burge et al., 2005). Older
patients were more likely to stay at their local
hospital, to which they had originally been
referred. Male patients were more likely to
decide to move to an alternative provider than
their female counterparts (Burge et al., 2005).
The models suggested that more patients
would be willing to move to an alternative
provider for ophthalmological treatments,
while a larger number would stay at their local
hospital for gynaecological treatments.
The findings provide valuable insights
into what drives the choices made and thus
enable policy makers to improve important
53.
RAND Europe 6:Discrete choice modelling
areas within the health care system, such as
information on clinical quality and health out-comes.
38
All factors examined are amenable to
policy change and therefore the models could
be used as a policy tool to examine a range
of scenarios. This would provide insight into
how different policies would influence choice
as well as assist judgements regarding which
outcomes are most desirable and whether
the costs required to achieve them are justi-fied.
For example, if the goal of a policy is to
encourage patients to switch to a short waiting
time but a more distant hospital, this analysis
demonstrated that all transportation should be
organised by the NHS (even if paid for by the
patient) and follow-up care should be at the
home hospital.
6.5 Discrete choice modelling in
action (2): stated preference
data/evaluation of distribution
network operators and
willingness to pay for
improvements in service
Ofgem, the industry regulator for the electric-ity
and gas markets in Great Britain, com-missioned
research with the principal aim of
determining domestic and business customer
priorities and willingness to pay (WTP) for
a range of infrastructure investments by the
Distribution Network Operators (DNOs).
This study has been used as input to price con-trol
negotiations for the period 2010 to 2015.
Ofgem administers a price control regime
which ensures that the DNOs can, through
efficient operation, earn a fair return after capi-tal
and operating costs while maintaining an
appropriate level of service and limiting costs
passed onto consumers.
The design of the stated preference
experiment was based on a list of prioritised
service attributes and associate service levels
(Accent, 2008, see Chapter 5). The attributes
considered in the SP experiments differed for
business and domestic customers. Both service
improvements and reductions were tested,
and the corresponding changes in the bill
size were investigated in the stated preference
experiments.
To ease the respondent’s decisionmaking
process, the attributes were divided across
three choice experiments. The list of attributes
in the Stated Preference experiment is shown
in Table 6.1. Figure 6.2 shows an example of a
stated preference exercise.
Data were collected through 2,154 in-home
interviews and 1,052 business telephone
interviews conducted in early 2008.
54.
PERFORMANCE AUDIT HANDBOOK
39
Table 6.1: Stated preference attributes
Experiment 1
Frequency of power cuts over 3 mins
Average duration of power cuts over 3 mins
Number of short power interuptions
Provision of information
Experiment 2
Restoration of supply (time)
Compensation for restoration of supply
Making and keeping appointments
Planned interruptions – notice
Experiment 3
Network resilience to major storms
Network resilience to flooding
Reduction in carbon emissions
Energy efficiency advice
Source: Accent (2008, see Chapter 5)
Figure 6.2: An example of a choice experiment
Which electricity distribution service would you choose?
As Now Alternative 1 Alternative 2
Average number of power
cuts longer than 3 mins in
normal weather conditions
4 in 5 years 6 in 5 years (worse
than now)
2 in 5 years (better
than now)
Average duration of power
cut
100 mins on average 100 mins on average 110 mins on average
(worse than now)
Average number of power
cuts shorter than 3 mins in
normal weather conditions
5 in 5 years 3 in 5 years (better
than now)
7 in 5 years (worse
than now)
Information provided during
power cuts
Automated messages
of telephone
operators to respond
to customer calls
Automated messages
or telephone operators
to respond to customer
calls, plus helpline for
customers reliant on
medical equipment
Automated messages
or telephone operators
to respond to customer
calls, plus text
messages to provide
information updates
Annual Electricity Bill £200 (no change) £209 (£9 increase) £209 (£9 increase)
Choice (mark “X” in
preferred option)
Source: Accent (2008, see Chapter 5)
55.
RAND Europe 6:Discrete choice modelling
The key findings of the stated preference
choice experiments showed that, first, options
offering equipment and vehicles using less pol-luting
40
fuels were more likely to be selected by
both domestic and business customers (Accent,
2008, see Chapter 8). Second, moving 5 per-cent
of overhead lines underground per annum
in areas of outstanding natural beauty and
national parks for amenity reasons was valued
higher compared to options offering none, 1.5
percent or 3 percent. Finally, domestic and
business customers valued reductions in time
taken to restore the electricity supply after a
power cut, and reductions in power cuts, very
highly. Compared to the baseline scenario of
restoring supply within 18 hours, customers
were more likely to choose scenarios offering
restoration within 12 or 6 hours. This study
also determined the willingness to pay for
service improvements for both residential and
business customers in all areas.
This research represents an evidence-based
approach that helped to inform the next price
control period, known as the distribution
control review 5 (DPCR5), 2010 to 2015.
In particular, the focus was on obtaining cus-tomers’
preferences and willingness to pay for
improvements to the level of service delivered,
identifying any regulatory gaps that need to be
addressed, and assessing whether DNOs offer
quality of service and provide measurable ben-efits
to customers.
6.6 Discrete choice modelling in
action (3): combining revealed
and stated preferences/the Isles
of Scilly Travel Demand Model
The existing ferry service to the Isles of Scilly
is nearing the end of its operational life
and will be taken out of service after 2014.
Cornwall County Council commissioned
research to develop a travel demand model
(see Kouwenhoven et al., 2007). The research
also needed to quantify the benefits to travel-lers
from different ferry service options to
inform the cost-benefit analysis (CBA). The
findings from this study have since been used
by Cornwall County Council in a Major
Bid Submission to the UK Department for
Transport for capital funding support for
improved transport links.
A series of surveys were designed to cover
the three main groups travelling to and from
the Isles: (1) day-trip visitors, (2) staying visi-tors
and (3) island residents, business travellers
and those visiting friends and relatives. Over
1800 face-to-face RP surveys were conducted
with non-resident travellers to the Isles of Scilly
to collect data on the travel choices that they
had historically been making. Among those,
400 respondents went on to participate in a
subsequent SP survey to focus on how their
choices may change if the transport provision
to the islands were to change. In addition, over
250 RP surveys posted to island residents were
returned and of those, 60 took part in the fur-ther
SP survey. All the surveys were conducted
during the peak summer season in 2005.
Due to the importance of transport links
to the Isles, the travel demand model needed to
reflect both changes in modal shift and changes
in total demand as a result of changes in ferry
service level. In this study, both the RP and SP
data were used jointly to estimate mode choice
models. The models incorporated (household)
income-specific cost sensitivity, resulting in
income-specific values of access time and ferry
time. For day-trip visitors, the values placed
on changes in travel time by business travel-lers
were found to be significantly higher than
those of other travellers. For instance, the value
placed on time spent on the ferry for day-trip
business visitors was estimated at £24.07 (£/
hour, 2005 prices). For day-trip private visi-tors,
values of time were estimated at £11.82
for households with income less than £60,000,
56.
PERFORMANCE AUDIT HANDBOOK
41
and £16.09 for those with income of £60,000
or more. The study also provided evidence on
the value placed on both the proposed new
ferry and for the harbour improvements at
Penzance and St Mary’s. The models revealed
that staying visitors would be willing to pay
£13 for the new ferry compared to the resi-dents’
£7. Harbour improvements were valued
at £5 and £10 respectively (per one-way trip
for both improvements, 2005 prices).
Trip frequency models were also estimated
to reflect changes in total travel demand as a
result of changes in ferry services. The models
showed, for example, that improved ferry serv-ices
could lead to an increase of 55 percent in
trips by day-trip visitors whereas there would
be a 19 percent fall in the same segment of
travellers if the ferry service were to be with-drawn.
Subsequent model runs, under a few
simple scenarios, provided further evidence
that there would be a small drop in total pas-senger
demand if the ferry service were to be
discontinued, but a large shift to ferry from
airplane and helicopter services if the ferry
services were to be improved.
6.7 Summary
Discrete choice models demonstrate that it is
possible to obtain and quantify the views and
preferences of citizens or businesses as con-sumers
or users of infrastructure. In the case
studies presented, it was possible to monetise
the preferences, generating evidence to sup-port
investment decisions.
Discrete choice modelling can also shed
light on where policy and individual choices
differ, thus it can help policy makers and those
deploying policy measures to take informed,
evidence-based decisions as to whether the cost
of contravening or ignoring the difference in
choices outweighs the benefit of implementing
the policy measure. It also helps in identifying
areas where policy measures might be adjusted
to take better account of preferences without
losing any of the gains of the proposed policy.
Finally, discrete choice modelling brings
objectivity into charged debates, particularly
when policy discussions turn to talk of “find-ing
the right balance” between public prefer-ence
and policy targets.
57.
RAND Europe 7:Economic evaluation
CHAPTER 7
Figure 7.1: Illustration of economic evaluation as a comparative analysis of
alternative courses of action
42
Economic evaluation Annalijn Conklin
7.1 Key points
Economic evaluation is a way of
comparing the costs and consequences of
a policy, action or intervention.
Economic evaluation helps decision
makers to choose between competing
actions when resources are finite.
Economic evaluation assesses both
allocative and technical efficiency.
7.2 Defining economic evaluation
Economic evaluation is a comparative analysis
that examines both the costs (inputs) and con-sequences
(outputs) of two or more policies/
actions/interventions. Economic evaluation
studies therefore provide a structured and
systematic way of helping decision makers to
choose between competing or alternative ways
of utilising finite resources.
The methodology has a history of being
applied in the transportation sector (eg US
highway and motorway development, major
transport investment in Canada, UK’s London
Underground Victoria Line), engineering (eg
US federal waterways infrastructure), educa-tion
and other public sectors. In the early
1990s, the US Department of Health and
Human Services issued its CBA guidebook
(see reference list below). Here, we focus on
the health sector because economic evaluation
is especially applicable here, given that health
is generally a significant public sector budget
and that decisions about resource allocation
based on this methodology carry a high impact
on individuals and society at large.
In public health, the comparator of a
particular health policy or health interven-tion
is often “standard care” for that region or
country, which can mean no programme or
intervention.
There are two distinguishing features of
economic evaluation studies: (1) they deal
Choice
Programme A
Programme B
ConsequencesA
ConsequencesB
Source: Drummond et al. (2005)
58.
PERFORMANCE AUDIT HANDBOOK
43
with comparing costs and consequences, and
(2) they concern themselves with choices. The
latter distinguishes economic evaluations from
economics. Whereas the discipline of econom-ics
tries to explain the choices and behaviours
of individuals and organisations, economic
evaluation studies seek to inform choices
that must be made by policymakers or other
decisionmakers.1
Ultimately, the purpose of economic
evaluation studies is twofold: first, to assess
whether the benefits from the policies under
consideration are greater than the opportunity
cost of those policies (compared to alternative
uses of the resources); and second, to assess
whether efficiency is achieved, in terms of both
allocative and technical efficiency.
7.2.1 Different types of economic
evaluation
There are several different types of economic
evaluation. Cost effectiveness analysis (CEA),
cost benefit and cost utility are defined as “full”
economic evaluation studies (Drummond et
al., 2005)2. Other, more common, types of eco-nomic
evaluations, such as cost consequence
evaluation, are not described as “full” because
useful cost data is often lacking or insufficient.
What distinguishes the three types of full eco-nomic
evaluations is the way the consequences
of respective policies are expressed (see Table
7.1: Types of economic evaluation studies).
1 Policymakers’ choices can also be informed by eco-nomics.
2 A partial economic evaluation is one where only one
of the two distinguishing characteristics of economic evalu-ation
is achieved. For example, a cost analysis is a compari-son
of two or more alternatives but examines only the costs
of the alternatives and not the benefits. A cost-outcome
description is a partial evaluation whereby both costs and
consequences are examined but there is no comparison
of two or more alternatives. For further information, see
Drummond et al., 2005.
Table 7.1: Types of economic evaluation
studies
Types of
analysis Outcomes/Consequences
Cost
effectiveness
(CEA)
Single effect of interest,
common to both alternatives
but achieved to different
degrees
Natural units (eg life years
gained/ saved, cases
prevented, disability-days
saved, etc)
Single dimension outcome
Cost utility
(CUA)
Single or multiple effects, not
necessarily common to both
Healthy years (eg QALYs and
DALYs)
Multi-dimension outcomes
Cost benefit
(CBA)
Monetary €, £, etc
Source: Adapted from Drummond et al. (2005)
7.2.2 Cost-effectiveness analysis
Cost-effectiveness analysis (CEA) compares
the outcomes/ results between alternative
policies/actions/interventions that affect the
same outcome. Thus, CEA estimates expected
costs and outcomes of policies and expresses
the outcomes in a single dimension measure
(ie natural effectiveness units). The outcomes
in CEA could be intermediate or final,
but they are nevertheless single, policy- or
programme-specific and unvalued. In the case
of health, for example, intermediate outcomes
may be symptoms or risky behaviours,
whereas final outcomes may be cases or
deaths. Ultimately, this method produces a
summary measure, a cost-effectiveness ratio,
for a particular policy/action/intervention
in the form of cost per outcome achieved
(eg cost per cases prevented, cost per death
avoided, cost per quitter, cost per abstinent,
etc).
59.
RAND Europe 7:Economic evaluation
44
A CEA is used primarily to identify the
strategy, or policy, under a fixed budget, that
will achieve the maximum possible gains (or
other defined objective). In other words, CEA
can help determine which policies are not
worth their costs. Hence, CEA assessments
of whether a programme (or policy, or action,
etc) is worthwhile have to be made by refer-ence
to an external standard (eg a budget con-straint
or threshold cost-effectiveness ratio).
Furthermore, decisions on the expansion of
the fixed budget require consideration of the
opportunity cost that is likely to fall outside
the relevant sector.
7.2.3 Cost-utility analysis
Cost-utility analysis (CUA) serves a similar
purpose to CEA (and is sometimes subsumed
under the same heading) in that it compares
costs and benefits of alternative policies (or
interventions, etc) to help decisionmakers
determine the worth of a policy or programme
by reference to an external standard (usu-ally
a fixed budget). In other words, both
CEA and CUA are techniques that relate to
constrained maximisation. However, CUA
differs from CEA on the outcomes side to the
degree that outcomes in CUA may be single
or multiple, are generic (as opposed to policy-or
programme-specific) and incorporate the
notion of value. Hence, CUA is more useful
to decisionmakers with a broad mandate than
CEA because CUA has broad applicability.
Furthermore, CUA is viewed as a par-ticularly
useful technique because it allows for
quality of life adjustments to a given set of out-comes,
while concomitantly providing a generic
outcome measure for comparison of costs
and outcomes in the alternatives examined.
In other words, CUA produces an integrated
single measure, quality-adjusted life-years
(QALYs), that accommodates the variation
in preferences individuals or society may have
for a particular set of outcomes by capturing
gains from reduced morbidity (quality gains)
and reduced mortality (quantity gains). The
result of CUA is typically expressed in terms of
the cost per QALY gained by undertaking one
policy or programme over another.
In contrast to cost-benefit analysis, CUA
and CEA both implicitly assume that one of
the programme or policy alternatives will be
undertaken regardless of its net benefit. Hence,
CEA may lead to a decision to undertake a
programme/intervention/policy that does not
pay for itself because the technique assumes
that the output (in terms of health effects) is
worth having and the only question is to deter-mine
the most cost-effective way to achieve it
(Drummond et al., 2005).
7.2.4 Cost-benefit analysis
Cost-benefit analysis (CBA) is often the most
useful for decisionmakers; however, it is also
the most difficult type of economic evaluation
to conduct. This is because it compares the
expected costs and benefits of two (or more)
alternative policies/actions/interventions
where all items are expressed and valued in
monetary terms. The difficulty lies in the fact
that measuring costs or benefits and valuing
them in a currency requires many different
skills and associated professionals. A basic tenet
of CBA, grounded in welfare economic theory,
is that individual consumers are deemed to
be the relevant source of monetary values for
programme outcomes. A CBA can therefore
provide a list of all costs and benefits for each
policy option over time.
In theory, CBA provides information on
the absolute benefit of a policy, or programme,
in addition to information on its relative per-formance.
The results of CBA can be stated
either in the form of a ratio of costs to benefits,
or as a simple sum (possibly negative) repre-senting
the net benefit (loss) of one policy or
60.
PERFORMANCE AUDIT HANDBOOK
45
programme over another. Thus, a CBA can
help achieve estimates of the Net Social Ben-efit,
providing a single Net Benefit (NB) value
(benefits minus costs). That is, CBA provides
an estimate of the value of resources used up
by each policy or programme compared to
the value of resources the programme might
save or create. Notably, as Drummond et al.
(2005) remark, few published CBAs achieve
this wider remit.
CBA can support a decision to imple-ment
a specific policy, action or programme.
Such a conclusion is possible because CBA
can achieve two goals. First, CBA can assess
whether a programme is worthwhile, without
reference to an external standard. If the Net
Benefit is greater than zero, then the decision
is to implement. When a choice must be made
among competing options, then CBA can be
used to decide to implement the programme
(or policy, etc) having the highest Net Benefit.
Second, CBA can assess whether the budget
should be expanded to accommodate the new
policy, programme or action.
7.2.5 Distinguishing types of costs and
benefits
The existing literature on economic evalua-tion
in healthcare, for example, classifies costs
and benefits as direct, indirect, or intangible.
However, the use of these terms is often not
consistent across studies, which sometimes
creates confusion.
In addition, the relevant costs and conse-quences
that serve as the building blocks for
economic evaluation are assembled in different
ways depending upon the perspective the ana-lyst
takes regarding the role of economic evalu-ation.
For example, a welfarist approach to
economic evaluation might involve a societal
perspective; an extra-welfarist approach might
involve only a healthcare system perspective;
and a decisionmaking approach might entail
a distributional perspective. Nevertheless, we
describe each of these categories of costs and
benefits in turn, as summarised in Drummond
et al. (2005).
Direct costs and benefits denote the
resources consumed (costs) or saved
(benefits) by a programme/intervention/
policy. In healthcare, these would be
resources in the healthcare sector, but
sometimes would include a patient’s out-of-
pocket expenses and resources from
other statutory agencies or voluntary
bodies.
Indirect costs and benefits denote the
time of patients (and/or their families)
consumed or freed by the programme/
action/intervention. Generally, the focus
of indirect costs and benefits has been on
work time, and made synonymous with
productivity gains and losses. Notably, the
term indirect costs can cause confusion as
it is used by the accountancy profession
to indicate overhead costs.
Finally, the terms intangible costs and
benefits have been used to include those
consequences that are difficult to measure
and value, such as the value of improved
life per se, or the pain and suffering
associated with medical treatment, or
the increased opportunity for social
participation and social cohesion, etc.
Yet the latter are not costs as they do not
represent resources denied to other users.
Nor are these items strictly intangible,
since they are often measured and valued
through methods such as the utility or
willingness-to-pay approach.
61.
RAND Europe 7:Economic evaluation
7.3 When to use economic
46
evaluation
7.3.1 Cost-effectiveness analysis
Cost-effectiveness analyses are used when costs
are related to a single, common effect that may
differ in magnitude between the alternatives.
For example, if our policy interest concerns
the prolongation of life after renal failure and
we are interested in comparing the costs and
consequences of hospital dialysis with kidney
transplantation, then the outcome of interest
is common to both programmes: namely, life-years
gained. However, the two programmes
to prolong life have differential success in
achieving this same outcome as well as dif-ferential
costs. In comparing these alternatives,
we would normally calculate the prolongation
and compare cost per unit of effect (ie cost
per life-year gained). Notably, we would only
lean towards the least-cost programme if it
also resulted in a greater prolongation of life,
although this may not necessarily be the case.
It important to note that CEA can be
performed on any alternatives that have a
common effect, for example kidney trans-plantation
can be compared to mandatory
bike helmet legislation, if the common effect
of interest is life-years saved and these are
independent programmes. That is to say, the
costs and health effects (or other benefits) in
one group are not affected by the intervention
alternative in any other group.
In general, CEA is most useful in situa-tions
where a decisionmaker, operating within
a given budget, is considering a limited range
of options within a given field.
7.3.2 Cost-utility analysis
Cost-utility analysis is most appropriate
when costs are related to alternative policies
that have multiple dimensions and outcomes
and where quality of life is either the most
important outcome or an important outcome
among others (eg survival). For example, qual-ity
of life is the most important outcome of
arthritis treatment, whereas both survival
and the quality of that survival are important
outcomes of neonatal intensive care for very
low-birthweight babies. CUA should also be
used when the alternatives examined affect
both quality and quantity of life and a deci-sionmaker
wishes to construct a common unit
of outcome that combines both effects. For
example, medical treatments for certain can-cers
improve longevity and long-term quality
of life but decrease quality of life during the
treatment process itself.
Similar to CEA, CUA is also useful when
(1) a decisionmaker, given a limited budget,
must determine which policies, services or
programmes to reduce or eliminate to free up
funding for a new policy or programme; or (2)
the objective is to allocate limited resources
optimally by considering all alternatives and
using constrained optimisation to maximise
the benefits achieved.
7.3.3 Cost-benefit analysis
Cost-benefit analysis is best used when the
goal is to identify whether the benefits of a
programme or policy exceed its costs in mon-etary
value. Since CBA converts all costs and
benefits to money, the advantage of CBA over
CEA or CUA lies in the ability to make deci-sions
about a policy or a programme in stages
(rather than comparing two alternatives simul-taneously)
and with or without the constraints
of a fixed budget.
Put differently, CBA is much broader
in scope than either CEA or CUA insofar as
the technique is not restricted to comparing
programmes within a particular sector, such as
healthcare, but can be used to inform resource
allocation decisions both within and between
sectors of the economy. As the most widely
62.
PERFORMANCE AUDIT HANDBOOK
47
used economic evaluation, CBA has a long
history in public sector economic evaluation
areas such as transport and the environment
(Sugden and Williams, 1979, referenced in
Drummond et al., 2005).
7.4 When not to use it
There are a number of limitations and cave-ats
to using economic evaluation. Whilst a
detailed review of these lies outside the scope
of this chapter, a few key points are outlined
below.
CEA/CUA should not be used if:
data on all alternatives are incomplete
and/or non-comparable
there is no formal periodic budget
allocation process during which
all alternatives can be assessed
simultaneously
there is a need to know whether a
particular goal of a programme or policy
is worth achieving given the social
opportunity costs of all the resources
consumed in its implementation
(assuming the social costs are also known)
there is a need to capture effects that
spill over to other persons (positive
or negative), known as externalities
in economics (eg health effects of air
pollution such as chronic obstructive
pulmonary disease, or asthma).
CBA should not be used if:
there is a need to know only the price of
achieving a particular goal or outcome,
whether it is the incremental cost of a
life-year saved, a case of disease detected,
or a QALY gained
decisions on allocative efficiency are
not required, rather it is assumed that a
particular policy or programme will be
implemented
the client focus of the expected outcome
is narrow
assigning monetary values to outcomes is
neither appropriate nor possible.
7.5 Conducting economic
evaluation - be wary of ratios!
It is difficult to outline one standard form of
economic evaluation for several reasons. First,
there are different perspectives on the role
of economic evaluation (ie welfarist versus
extra-welfarist versus decisionmaker). Second,
measurement difficulties may compromise
any analytic approach. And third, the institu-tional
context may influence how the various
“building blocks” are assembled (eg a welfarist
approach may not capture all the benefits of a
policy in the estimation of willingness-to-pay
(WTP) if in a setting where healthcare, for
example, is provided free at the point of serv-ice).
Against this background, Box 7.1 shows
how the same economic evaluation technique
can produce different ratios based on what
goes into the numerator and denominator.
63.
RAND Europe 7:Economic evaluation
Box 7.1: The same economic evaluation
technique can produce different ratios
48
Suppose a healthcare programme had costs and consequences as
follows:
Costs Consequences
C1 healthcare costs health improvement
$1,000,000
C2 costs in other U (in preference scores) 10 QALYs
sectors $50,000
C3 patient/family W (willingness-to-pay) $2,000,000
resources $5,000
C4 lost productivity S1 healthcare savings $25,000
$100,000
S2 savings in other sectors $20,000
S3 savings in personal resources
$12,000
S4 savings in productivity $100,000
V (other value created) $0
The following ratios could be calculated:
1. Cost-utility ratio (healthcare resources only)
(C1 – S1) / U = $75,000 per QALY
2. Cost-utility ratio all resources used)
(C1 + C2 + C3 + C4 – S1 – S2 – S3 – S4) / U = $77,300 per QALY
3. Benefit-cost ratio (including all consequences in the numerator as
benefits)
[(W + S1 + S2 + S3 + S4) / (C1 + C2 + C3 + C4)] = 2.163
4. Benefit-cost ratio (treating resource savings as cost-offsets deducted from
the denominator)
[W / (C1 + C2 + C3 + C4 – S1 – S2 – S3 – S4)] = 2.587
Source: Drummond et al. (2005), p. 22
64.
PERFORMANCE AUDIT HANDBOOK
49
Although there is no standard “recipe” for the
different types of economic evaluations, as
each analysis will be different and will depend
on careful consideration of all the components,
it is still helpful to have a standard sequence of
steps to follow. We therefore provide a brief
synopsis of the standard steps of a cost-benefit
model that are recognised as best practice,
according to the Canadian Treasury Board in
its 1976 Benefit-Cost Analysis Guide (Watson,
2005).
1. “Examine needs, consider constraints,
and formulate objectives and targets”
(Watson, 2005). It is important that all
economic evaluations clearly indicate the
perspective from which costs and benefits
will be assessed.
Each analysis must take a single point
of view and it must be stated clearly
at the outset. If there is a single
decisionmaker, then an analysis from
one perspective is often adequate. If
the interests of more than one person
or group are affected, then several
analyses may be necessary.
The perspective of the analysis is
critical not only for identifying costs
and benefits correctly but also for
choosing consistent parameters. For
example, the appropriate discount
rate depends upon what perspective is
being taken in the analysis.
Maintaining a consistent point of
view helps to avoid double counting
the set of costs and benefits being
examined.
2. “Define options in a way that enables
the analyst to compare them fairly”
(Watson, 2005). When an option is
assessed against a baseline case, then it is
important to ensure that the baseline case
has been optimised. (NOTE: this step is
particularly relevant to CEA and CUA,
which are inherently comparative.)
For all public investments, a full set
of the most promising options should
be examined.
When a single proposal (policy or
programme) is being considered, it
must be compared with a baseline
case and the baseline case must be
optimised.
The option to delay a project or
policy or programme to wait for
better information, or for better
starting conditions, can have
considerable value.
The only way to ensure that the
options whose present values are
being compared are really fair
alternatives is to standardise them
for time, for scale and for already-owned
components. A fair options
diagram can clarify a complex set of
investment options.
3. “Analyse incremental effects and gather
data about costs and benefits” (Watson,
2005). It is helpful to specify all of the costs
and benefits over time in a spreadsheet.
Be careful about what you count;
incrementality, transfers, opportunity
cost and residual value in particular
are important concepts in CBA, Only
incremental benefits and costs caused
by the policy/action/intervention
should be compared, not those
that are merely associated with the
input in some way. For example, if
conducting a CBA of a government
grant programme to encourage
exporters, one would need to know
not just the export sales made, but
specifically the sales that were made
65.
RAND Europe 7:Economic evaluation
50
There are a number of procedures
for estimating costs in the healthcare
setting when existing market prices
need to be adjusted, for example: (a)
hospital charges; (b) hospital charges
converted to costs by use of hospital-level
cost-to-charge ratios; (c) hospital
charges converted to costs by use
of department-level cost-to-charge
ratios; and (d) itemised laboratory
costs with non-procedural hospital
costs generated from department-level
cost-to-charge ratios.
For health benefits, for example,
there are at least three ways in which
the value of goods or services can
be defined: (a) find the WTP for a
certain health outcome; (b) find the
WTP for a treatment with uncertain
health outcomes (this takes an ex-post
perspective); (c) find the WTP
for access to a treatment programme
where future use and treatment
outcomes are both uncertain (this
takes an ex-ante perspective).
Income multipliers should generally
be avoided but, when used, must be
applied even-handedly to costs as well
as benefits.
The literature can sometimes provide
approximate values for difficult-to-
measure items (eg clean and
natural environment, time savings
for commuters, jobs created).
Standard government parameters and
benchmarks should be used whenever
possible.
5. “Run the deterministic model” (Watson,
2005) (using single-value costs and ben-efits
as though the values were certain).
that would not have been made in
the absence of the programme.
4. “Express the cost and benefit data
in a valid standard monetary unit of
measurement” (Watson, 2005). This
step involves converting nominal dollars,
pounds, Euros, etc to a constant currency,
so that the CBA uses accurate, undistorted
prices.
Once the relevant range of costs
is identified, each item must be
measured (ie quantities of resource
use) and valued (ie unit costs or
prices). It is important to recognise
here that there are various definitions
of cost (total, fixed, variable,
cost function, average, marginal,
incremental, etc). Moreover, each
type of costing will have a spectrum
of precision from least precise (eg
average per diem) to most precise
(eg micro-costing). These issues are
explored further in Drummond et al.
(2005).
In CBA, market prices are often
considered as being good measures
of the costs and benefits of an
investment.
When market prices are distorted,
or do not exist, the main methods
for estimating the value of costs and
benefits are based on shadow prices,
human capital method, revealed
preferences, or stated preferences of
willingness-to-pay (WTP). Examples
of difficult-to-estimate values are:
the value of travel time savings; the
value of health and safety; the value
of the environment; the value of jobs
created; the value of foreign exchange;
the residual value of special-use
facilities; and heritage values.
66.
PERFORMANCE AUDIT HANDBOOK
51
6. “Conduct a sensitivity analysis to deter-mine
which variables appear to have
the most influence on the Net Present
Value (NPV)” (Watson, 2005). This step
involves considering whether better infor-mation
about the values of these variables
could be obtained to limit the uncertainty,
or whether action can limit the uncer-tainty
(eg negotiating a labour rate). A key
question to ask here is: “Would the cost of
this improvement be low enough to make
its acquisition worthwhile?” If the answer
is yes, then the response is to act.
The outcome of CBA is typically
influenced by several uncertain
factors, and this is true across fields
as diverse as health, education,
employment, and economic
development. It is therefore
important to know how sensitive
the outcome is to changes in those
uncertain factors.
Sensitivity analysis, however, only
treats variables one at a time, holding
all else constant. Thus, simultaneous
actions and interactions among
variables in the real world are ignored
because sensitivity cannot deal with
more than two variables.
Four factors contribute to sensitivity:
the responsiveness of the NPV
to changes in the variable; the
magnitude of the variable’s range of
plausible values; the volatility of the
value of the variable; and the degree
to which the range or volatility
of the value of the variable can be
controlled.
7. “Analyse risk (which arises from
uncertainty in the data) by using what
is known about the ranges and prob-abilities
of the costs and benefits values
and by simulating expected outcomes of
the investment” (Watson, 2005). What
is the expected NPV? Apply the standard
decision rules.
8. “Identify the option which gives the
desirable distribution of income”
(Watson, 2005) along a chosen dimen-sion
such as income, class, gender, region,
etc – whatever categorisation is deemed to
be appropriate.
Questions of fairness are difficult in
CBA because it generally assumes
that everyone in the reference group
takes the same point of view, which
is reasonable when there is a single
investor but not when the perspective
is society at large.
Many governments, including
the Government of Canada, have
fairness objectives as well as efficiency
objectives, which often clash, and
there are no non-contentious ways
of combining efficiency and equity
objectives in the same set of figures.
Distributional issues should be
covered in every CBA but kept
separate from the economic efficiency
analysis. If a recommendation to
approve a particular alternative hinges
on equity objectives, then the net
cost of choosing the equity-based
recommendation must be made
visible to decisionmakers.
There is no clear and simple way
to adjust CBA calculations to take
fairness into account, and several
different approaches are possible: (a)
ignore distributional issues; (b) use
distributional weights; (c) focus on
basic needs; or (d) focus on visibility
and transparency. However, even a
simple analysis showing who benefits
67.
RAND Europe 7:Economic evaluation
52
and who pays can be often helpful to
decisionmakers.
9. “Considering all of the quantitative
analysis, as well as the qualitative analy-sis
of factors that cannot be expressed in
dollars, make a reasoned recommenda-tion”
(Watson, 2005).
In performing a CBA, there are five
key components of this framework
that are general to all public
investment decisions and considered
to be best practice (Watson, 2005).
These include the following: (1) a
parameter table; (2) an operations/
incremental effects model; (3) a table
of costs and benefits over time; (4) a
table of possible investment results
(NPVs); and (5) a statistical and
graphical analysis of investment risk
and expected NPV.
Finally, it is important to remember that all
economic evaluation studies are no better than
the underlying data provided or collected for
the analysis. There are a number of differences
between typical business or financial data
and data used in a CBA. In CBA, every cost
and benefit is fully recognised at the time it
occurs (not accrued beforehand), timing is
dealt with through discounting (consistent
with the point of view taken) and changes in
the values of assets are dealt with by includ-ing
residual values at the investment horizon.
In other words, CBA does not use accruals,
depreciation allowances or other “non-cash”
items (Watson, 2005).
7.6 Summary
Economic evaluation takes a number of differ-ent
forms, depending on the extent of moneti-sation
of both costs and benefits to be analysed
and/or compared. It is important to remember
that, while a CBA can be distinguished from
a CEA by the fact that CBA attempts to go
as far as possible in quantifying benefits and
costs in monetary terms, the ideal of measur-ing
all benefits and costs in monetary terms is
rarely achieved in practice. The distinction is
therefore merely a difference in degree and not
in kind, as Drummond et al. (2005) note.
Similarly, there are a number of different
costs and benefits to be distinguished and the
perspective from which the analysis should
be undertaken must be stated clearly at the
outset of the analysis, as this will determine
what costs and benefits are included in the
economic evaluation.
Each type of economic evaluation has a
different purpose and this will determine the
conditions under which it is used. Given the
different economic perspectives that can be
taken (eg welfarist, extra-welfarist, etc), there
is no single way to conduct an economic evalu-ation;
however, a standard sequence of steps
provides a useful guide.
68.
PERFORMANCE AUDIT HANDBOOK
53
7.7 Further reading on economic
evaluation
Table 7.2: Four health-related
economic evaluation databases
Name Web link for information
source of database
searches
HEED* http://www3.interscience.
wiley.com/cgi-bin/
mrwhome/114130635/
HOME
Tufts CEAR http://www.cearegistry.org
EuronHEED http://infodoc.inserm.fr/
euronheed/Publication.nsf
York CRD http://www.york.ac.uk/
inst/crd/crddatabases.htm
*Access to HEED is by private subscription of RAND
Europe.
Commerce Commission of New Zealand,
Guidelines to the analysis of public benefits
and detriments, Auckland, New Zealand,
December 1997
Drummond, M.F. and A. McGuire, eds., Eco-nomic
Evaluation in Health Care: Merging
Theory with Practice, Oxford, England:
Oxford University Press, 2001.
FSA, Practical Cost-Benefit Analysis for Finan-cial
Regulators Version 1.1, London, June
2000.
Gold, M.R., J.E. Siegel, L.B. Russell and M.C.
Weinstein, eds., Cost-effectiveness in Health
and Medicine, New York: Oxford Univer-sity
Press, 1996.
International Committee of Medical Jour-nal
Editors, “Uniform requirements for
manuscripts submitted to biomedical
journals”, Annals of Internal Medicine, Vol.
126, 1997, pp. 36-37.
Johannesson, M., Theory and Methods of
Economic Evaluation in Health Care, Dor-drecht,
Germany: Kluwer, 1996.
Levin, H.M. and P.J. McEwan, eds., Cost-effectiveness
Analysis: Methods and Applica-tions,
2nd ed., Thousand Oaks, CA: Sage
Publications, 2000.
Neumann, P.J., Using Cost-effectiveness Analysis
in Health Care, New York: Oxford Univer-sity
Press, 2005.
Nera Economic Consulting, The FSA’s Meth-odology
for Cost-benefit Analysis, New York:
Marsh and McLennan Companies, 26
November 2004.
Sloan, F., ed., Valuing Health Care, New York:
Cambridge University Press, 1995.
US Department of Health and Human Serv-ices,
Feasibility, Alternatives, and Cost/
Benefit Analysis Guide, Washington, DC,
July 1993.
World Bank, Monitoring and Evaluation: Some
Tools, Methods and Approaches, Washing-ton,
DC, 2002.
69.
RAND Europe 8:Focus group interviews
CHAPTER 8
54
Focus group interviews Aasha Joshi
of an exiting or proposed programme can be
diagnosed, according to the expressed needs of
programme implementers. Focus groups can
grant insight into a variety of norms, attitudes
and practices among a range of audit topics,
including management processes, information
systems and accountability relationships, from
a number of different programme participants
within a single timeframe.
8.3 When to use focus groups
Focus groups are most useful as a data collec-tion
method when the audit objective includes
the following:
exploring, piloting, or refining a
programme concept
identifying and understanding
participants’ goals, expectations, and
views of the efficacy of an established or
proposed programme
documenting experiences in
implementing a programme
describing differing outcomes across
people or sites.
Similar to interviews with key informants,
focus groups are not as useful as a stand-alone
method when the primary research objective is
to measure outcomes across an entire setting
or programme or to determine the cause of
effects of an implemented programme.
8.4 Conducting focus group
interviews
The purpose of the audit should guide the
process of selecting focus group participants.
Participants should be selected in terms of how
they are related to the implementation of the
8.1 Key points
Focus group interviews provide insight
into a variety of norms, attitudes, and
practices across a range of stakeholders.
Focus groups enable programme
implementation, perceived utility and
efficacy to be documented.
Focus groups rely on carefully structured
questions and skilled moderators.
8.2 Defining focus group interviews
A focus group interview is a group interview
conducted with 6–10 participants guided by
a moderator, who facilitates the discussion
among the participants.
However, “although group interviews are
often used simply as a quick and convenient
way to collect data from several people simul-taneously,
focus groups explicitly use group
interaction as part of the method” (Kitzinger,
1995, p. 299). In comparison to individual
interviews, focus groups and the interactions
they evoke can generate a wide range of opin-ions
and ideas, with each idea and opinion
prompting others among the focus group par-ticipants
(Zikmund, 1997). The value of the
method “lies in the unexpected findings that
emerge” from the participants, their unantici-pated
ideas, suggestions, and responses (Mal-hotra
and Birks, 2000, p. 161).
Focus groups are useful to aid understand-ing
the particular contexts in which pro-grammes
are being or will be implemented. In
conducting a focus group, auditors can learn
about programme implementers’ (ie, service
providers’) general thoughts, perspectives,
and experiences about a programme. In turn,
potential or existing strengths and weaknesses
70.
PERFORMANCE AUDIT HANDBOOK
55
programme in question. For example, if the
auditors are interested in exploring the report-ing
procedures of management to external
bodies, then it may prove useful to not only
recruit the managers who are involved in the
process of reporting itself, but also those who
are behind the scenes yet integral to the report-ing
process (eg contracts, public relations, or
administrative personnel). Note, however, that
this would entail conducting at least two dif-ferent
focus groups. When determining the
composition of the focus group, homogeneity
within each group is fundamental. People of
differing authority, job classification, or level
of education should not be combined, as this
may detract from any common ground pre-supposed
in the questioning.
At a minimum, focus group participants
should not be selected on the basis of an exist-ing
group (eg people who all work together or
friends), unless such a selection is the target
audience of the programme. A group with
members who are already acquainted removes
anonymity and encourages endorsement of
each other’s views (Stewart and Shamdasani,
1990), all of which work to bias the potential
findings from the focus group. “It must be
remembered, however that a small discussion
group will rarely be a representative sample,
no matter how carefully it is recruited.” (Zik-mund,
1997, p. 110). In turn, findings are not
necessarily generalisable to the target popula-tion
relevant to the audit. Instead, the focus
group provides fodder for identifying focus
group participants’ experiences and possibili-ties
for further programme development.
If the auditors decide not to hire an exter-nal
moderator to run the focus group, then
they should select a moderator who is not
associated with the programme for which the
group is being conducted. A moderator inter-nal
to the programme may affect the ways in
which participants respond to the questions.
The moderator focuses the kinds of questions
asked of the group, and creates a relaxed envi-ronment
in which participants actively engage
in the discussion.
Inherent to a focus group is a semi-struc-tured
format, relying on open-ended question-ing.
A set of initial questions or topics to be
addressed should be pre-determined before the
focus group, and the questions asked should
move from the general to the specific (Stewart
and Shamdasani, 1990). Prior to asking the
questions, though, the focus group participants
should be welcomed and, as in key informant
interviews, should be offered an explanatory
framework that will position the purpose of
the focus group. The ground rules for the focus
group should be described, including assuring
the participants that the information gathered
will be confidential and that everyone’s views
are important. Participants should be reminded
that the moderator wants to hear clearly what
each person is saying and that only one person
should speak at a time.
The format of a focus group, as described
by Krueger in the book Focus Groups: A Practi-cal
Guide for Applied Research (1988), follows
a pattern of five types of questions, which
include the following:
opening questions, which are brief,
factual, and establish common ground
among the participants
introductory questions, which introduce
the general purpose of the interview and
serve to start conversation and interaction
transition questions, which narrow the
scope of the topics of interest and allow
participants to hear others’ viewpoints
key questions, which are directly linked
to the audit’s research question and will
be the basis of analysis
ending questions, which close the
interview, highlighting the most salient
points from responses.
71.
RAND Europe 8:Focus group interviews
Suppose, for example, that a department
within an organisation wants to revamp its
employee review process, in which employees
currently meet with their supervisors once a
year for a performance review. The organisa-tion
56
wants to identify what aspects of the
review process are relevant to work quality.
Using Krueger’s framework, possible questions
for a focus group with current employees in
the department might include those shown in
Table 8.1.
Table 8.1: Five types of questions and
examples
Question Type Example
Opening
question
Tell us your name and
how long you have been
with the company.
Introductory
question
How are you currently
given feedback about
your work?
Transition
question
How do you feel about
this?
Key question How would you
characterise helpful
feedback from your
supervisor?
Key question How would you
characterise helpful
feedback from your co-workers?
Key question How are these kinds of
feedback reflected in
your annual review?
Key question What affect does the
current structured review
process have on how
you do your job?
Key question What affect does
the current structured
review process have
on your professional
development?
Key question Which features of the
review process are
particularly useful to
you?
Key question Which features of the
review process are
particularly unhelpful to
you?
Ending question Suppose you were in
charge, what changes
would you make to the
current review process?
Ending question [Offer a brief summary
of the key questions.] Is
this summary accurate?
Ending question The goal of this focus
group was to explore
what you think about
the employee review
process. Have we missed
anything?
Notice that none of these example questions
asks “Why?” Questions beginning with “Why”
may make participants feel that they are
required to justify, on the spot, their views or
behaviours, making them defensive to further
prompts. Instead, questions should focus on
attributes (ie, characteristics and features of the
programme or practice), as well as influences
(ie, the impetus of a practice or programme).
For example, instead of asking participants
“Why is the review process unhelpful to you?”
the moderator can ask “What features of the
review process are unhelpful to you?” or “How
does the review process inhibit your work?”.
Although the difference appears small, the
“What?” and “How?” questions help set the
participants at ease (Krueger, 1998). In gen-eral,
focus group questions should be clear (ie,
jargon free and worded in such a way that they
will not be interpreted in different ways by the
different participants), unbiased (ie, not favour
one particular kind of response over another),
72.
PERFORMANCE AUDIT HANDBOOK
57
and presented in the context of the purpose of
the audit.
Focus group moderators, like interviewers
of key informants (referred to elsewhere in
this handbook), need to respond, probe, and
follow up to gain explicit understanding of the
participants’ responses. The moderator should
take care not to bias the participants’ responses
by only responding to or probing favourable
or unfavourable comments. To encourage dis-cussion
among the participants and determine
the pervasiveness of a particular view, when
the moderator asks follow-up questions they
should ensure that others in the group are
asked if they have similar or different experi-ences,
irrespective of whether the experience is
positive or negative.
Due to the generative nature of focus
groups, they can be difficult to moderate at
times. It is crucial that the moderator includes
everyone in the discussion, without letting any
one person co-opt the session. Krueger (1998)
describes the various kinds of challenging
focus group participants, which include domi-nant
talkers, reluctant contributors, ramblers,
and self-appointed experts, as well as strategies
to deal with each. A focus group moderator
needs to be able to “encourage and stimulate”
the flow of purposive discussion from all par-ticipants
without being intrusive (Malhotra
and Birks, 2000, p. 163). As with interviewers
of key informants, a good moderator will be a
keen and disciplined listener, able to keep par-ticipants’
responses on topic without curtailing
their contributions.
A notetaker should be present during
the focus group interview to record the par-ticipants’
responses, by taking detailed notes
and preferably audio-taping the discussion as
well. After the focus group, notes should be
written up, noting the questions answered and
the topics discussed. Each of the participants’
responses should be noted, including who did
not respond to particular questions, keeping
as much to the participants’ own words as
possible.
The focus group notes or resulting tran-scripts
will be analysed so that conclusions
about the programme in question can be
drawn. When writing a report of the responses
from the focus group, be sure to“identify
agreements (group consensus) and dissenting
views” across groups and “discuss similarities
and differences by groups and by individuals”
(Planning and Evaluation Service, 2005). Ulti-mately,
the report should present findings, as
well as explicitly state how the findings relate to
the audit’s research questions. How the specific
analysis should be used will be determined by
the purpose of the focus group itself. Findings
can be used as the developmental framework
for additional data collection (eg, surveys) or
they can be used as contained descriptions of
people’s responses to the audited programme.
8.5 Focus groups in action
RAND Europe conducted focus groups in
a study on remuneration and pay in the UK
armed forces. The aim of the focus groups was
to determine the importance of pay in deci-sions
to leave the armed forces. These focus
groups tried to outline a range of factors that
would influence such career choices as well
as capturing the background and personal
circumstances of the individual participants.
The sessions focused on outlier views as well
as consensus among participants. The outputs
allowed the Ministry of Defence (MoD) to
understand better how pay was perceived
to be linked to career choices in the armed
forces. The focus group moderator was given
a number of prompts for areas that the MoD
wanted to explore in more detail, such as child
allowances and deployment awards. Questions
73.
RAND Europe 8:Focus group interviews
in the protocol for the focus group discussions
included:
1. Please take a turn and tell us briefly your
58
age, rank, and how long you’ve been in the
service. [Moderator and Notetaker. Record
left participant as 1 and number partici-pants
clockwise.]
2. How did you become interested in a career
in the Armed Forces? Probe to clarify the
most important reasons. Prompt if necessary:
a. In a previous study we were
told that travel, friends and family
influence, or job security were factors.
Which of these were important to
you, or was there another reason?
[Moderator, if necessary, attempt
to differentiate between childhood
aspirations and the more deliberate
step of considering employment.]
3. What made you finally decide to join
the Armed Forces? Probe to clarify the
most important reason. [Moderator and
Notetaker: In this and subsequent questions
record, when appropriate, whether partici-pants
individually or collectively show con-currence
I, dissension (D), or argument (A)
with any noted comments.]
4. Did you consider any of the other services?
If so, which ones and why?
5. Thinking about what you were told
during the application process, perhaps by
recruiters, how does the reality of Service
life compare? Does anything stand out as
being particularly different to that which
you were expecting? Probe (if necessary):
a. Were you prepared for the discipline
expected in basic training?
b. Did you receive enough information
about the physical demands of
Service life?
6. Some of you mentioned [FEEDBACK]
as reasons for joining. Now that you have
been in for a short while, what do you
see as the positive aspects to being in the
Armed Forces? Are there other benefits or
rewards?
7. What are the negative aspects to being in
the Armed Forces?
8. What factors are influencing or will influ-ence
your decision on whether to stay in
the Armed Forces? Prompt (if necessary):
a. Perhaps you have always intended to
leave at your first break point?
b. Or you want reach specific
professional goals that will take time?
c. Are finances a consideration?
d. Career options outside the military?
e. Family issues/dependents?
9. [Notetaker record particularly any partici-pants
who specifically mention child educa-tion
allowances (possibly as CEA or BSA)
and the context of their comments.]
10. As I mentioned at the beginning, this is
a review of the impact of pay and allow-ances.
With that in mind what do you
think about the levels of your current pay,
future pay and your allowance package?
11. [Preamble from SP(Pol) regarding the recent
operational pay announcement – a sentence
up to a short paragraph to set the scene, eg It
has recently been announced that members
of the Armed Forces deployed to Afghanistan
and Iraq will be paid additional money.]
12. Does this make operational deployments
more attractive? How will it affect you if
you are not deployed? Probe:
a. Would deployment pay influence
your decision to stay in the Armed
Forces?
b. Would you accept more frequent
deployments so long as you received
the additional deployment pay?
13. How do you think being in the Armed
Forces will affect your decision to buy a
home? [Moderator: consider the oral answers
to previous questions to challenge answers.
74.
PERFORMANCE AUDIT HANDBOOK
59
For example, look for contradictions between
intended time in service, purchase aspirations
and the answers offered to this question.]
Prompt:
a. Do you think job security will help
with your house purchase?
b. Would you want to live in your new
home?
c. How do you think the demands
of service life will affect home
ownership?
14. What message would you like to convey to
the leaders and policymakers in the Armed
Forces?
8.6 Summary
Focus groups are far more structured and pre-pared
than many people expect. Simply sitting
down with a few people and asking for their
opinions will be of little benefit to an auditor.
Participants in a focus group must be carefully
selected, the questions and their sequence
prepared well in advance, and the moderator
should be skilled at asking the right questions
in the right way. Useful information is only
revealed once the notes and transcripts of the
focus group interviews have been analysed in
detail.
75.
RAND Europe 9:Futures research
CHAPTER 9
60
Futures research Stijn Hoorens
9.1 Key points
Futures research encompasses a number
of different techniques across a range of
academic fields that help explore what
might happen in the medium- to long-term
future.
Futures research tools range from
qualitative (scenario narratives) to
quantitative (regression analysis), from
probabilistic (plausibility matrix) to
deterministic (scenario planning), and
can be expert-based, literature-based or
based on stakeholder participation.
There is limited evidence that futures
methods lead to more robust strategic
policy decisions. However, their merit
lies in agenda-setting, and understanding
uncertainty and stakeholder engagement.
9.2 Defining futures thinking
Futures thinking is generally not regarded as a
discipline on its own; it is highly fragmented,
covers a range of academic fields, and is prac-tised
by a myriad of academic departments,
think tanks, consultancies and government
institutions. Although there is no unam-biguous
definition, futures research can be
considered a collection of approaches that are
employed to conduct policy analysis for the
long- to medium-term future. It is not limited
to specific methods and covers a vast array of
approaches. Futures research has been called a
“very fuzzy multi-field” (Marien, 2002).
Whenever one is faced with a decision
whose success depends on an interplay of
factors beyond the control of those making
the decision, future developments or events
that may be uncertain must be anticipated.
Essentially, every decision is affected by exog-enous
factors; from switching on the light (a
lightning strike may cause a power outage) to
the decision to build a new terminal at Heath-row
Airport (the demand for commercial air
travel may drop as a consequence of terrorism,
recession or cheaper alternative modes).
The desire to anticipate what the future
holds is not new. The Delphic oracle, estab-lished
in the 8th century BC, had a prestigious
and authoritative position in the Greek world,
while Nostradamus, who published Les Pro-pheties
in 1555, has attracted an enthusiastic
following who credit him with predicting
many major world events.
In modern history, decision makers look
to the future using methods other than mere
prophecy or prediction. Analysts at the RAND
Corporation pioneered the development of
futures research methods to describe potential
strategies that the enemy could adopt during
the cold war. Prior to the 1973 oil crisis, Shell
used the scenario method developed at RAND
to improve its long-term strategy. Nowadays,
futures research is increasingly employed by
the private and public sector as part of their
strategic decisionmaking process and long-term
policy analysis. Box 9.1 illustrates how
a number of European governments have
incorporated a long-term policy perspective
into their institutional structure, through the
creation of cross-cutting or departmental stra-tegic
futures units.
76.
PERFORMANCE AUDIT HANDBOOK
61
Box 9.1: Embedding a long-tern
perspective in government and
administration
In Sweden, the government has institutional-ised
a set of 16 long-term objectives for the
future of the country, which are monitored
through a secretariat located within the
Swedish Environment Protection Agency.
The UK Foresight Programme and the Horizon
Scanning Centre are based in the Government
Office for Science, in the Department for
Innovation, Universities and Skills. The
Future Analyst Network (FAN-Club) is a
permanent network of people dealing with
future-related issues in different departments
and agencies.
In Finland, a national foresight reporting
mechanism requires the Prime Minister’s
Office to produce a national foresight report
at the beginning of each legislative period,
which is then subject to discussion in the
Committee for the Future of the Finnish
Parliament.
A common approach for assessing the potential
impact of certain actions in the future involves
gathering evidence about the empirical effec-tiveness
of comparable interventions in the
past. For instance, Dewar (1998) attempted to
understand the potential social consequences
of the Internet revolution by examining the
social effects of the printing press. Dewar
argued that the Internet allows many-to-many
communication on a global scale for the first
time, and asserted that this capability is of
similar magnitude to that of the printing press.
Such insights from history suggest issues that
may be considered to frame long-term policy
for the future (Lempert et al., 2003).
There are, however, several limitations to
an approach that uses historic evidence, which
are listed by Van’t Klooster and van Asselt
(2006):
There are limits to the extent to which
empirical data about the past and present
can be measured and obtained.
The system or processes under
consideration can behave in different
ways as the future exhibits uncertainty
and unpredictability (Bell 2000).
Many relationships that seem to have
developed in a linear way in the past may
follow a non-linear pattern in the future
(eg Lempert et al., 2003, Nowotny et al.,
2001).
Finally, the future is unknown, thus
different and conflicting perspectives as
to how the future may unfold can each be
legitimate.
As a consequence of these complexities, per-forming
futures studies is not a matter of data
collection and analysis in a classical sense.
Although future studies may use empiri-cal
evidence about current trends or causal
mechanisms, they can be distinguished from
empirical analysis in that they explore pos-sible,
probable and/or preferable future situ-ations
(Amara, 1981). The latter distinction
is reflected in a common typology used for
futures approaches, adapted by Börjeson et al.
(2006) based on the principal question users
want to pose about the future:
1. Forecasting (What will happen?): project-ing
effectiveness through extrapolation of
empirical data combined with assumptions
about future developments. This category
of approaches aims to delineate probable
futures.
77.
RAND Europe 9:Futures research
2. Utopian approaches (What can happen?):
62
developing plausible futures that could
vary from best case scenarios to worst case
scenarios and anything in between. This
approach does not aim to identify future
situations based on likelihood, but rather
those based on plausibility.
3. Vision building (How can a specific target
be reached?): developing preferable futures
through identification of aspects that are
desirable.
A multitude of methodological approaches
is covered extensively in the academic lit-erature,
testifying to the vibrancy of the field
(see, for example, Lempert, 2007, Bishop et
al., 2007, Bradfield et al., 2005, Lempert et
al., 2003). Other dimensions in which these
techniques can be characterised include: quali-tative
(scenario narratives) versus quantitative
(regression analysis); probabilistic (plausibil-ity
matrix) versus deterministic (scenario
planning); expert-based, literature-based or
approaches based on stakeholder participation.
The table below provides a brief description
and characterises a number of selected futures
techniques.
78.
PERFORMANCE AUDIT HANDBOOK
63
Table 9.1: Brief descriptions of a selected sample of futures research
methodologies
Technique Description Characterisation
Backcasting In backcasting, process participants describe
a shared vision of their preferred future and
consequently delineate the measures and milestones
that are needed to deliver this vision.
Vision building
Qualitative
Deterministic
Stakeholder
participation
Delphi Delphi is a consultation process involving a group
of experts with ranging specialities. The experts
participate anonymously in a number of sequential
questionnaires about future developments. After each
iteration the experts are asked to reconsider their
opinion in view of the consensus and the reasons for
disagreement. The two elements that mark a Delphi
study are anonymity and feedback. See Chapter 5.
Forecasting
Qualitative
Deterministic
Expert-based
Gaming Gaming involves simulation of a real-world situation
by getting participants to play different roles in a
controlled, risk-free environment. Gaming can be
used to develop alternative perspectives of the future,
or to test out alternative strategies and tactics that
participants may later use.
Utopian
Qualitative
Deterministic
Stakeholder
participation
Horizon
scanning
An effort to delineate significant changes in the
world beyond the organisation of interest. Scanning
is based on a systematic review of current journals,
news outlets, magazines, web sites, and other
media for indications of changes likely to have future
importance. Horizon scanning focuses mainly on
trends rather than events.
Forecasting
Qualitative
Deterministic
Expert and literature-based
Modelling
and simulation
Include a cluster of quantitative techniques
that are used to test a number of hypotheses
about a particular system. Models are artificial
representations of a system, which may be used
to understand its causal relations. When run
under different assumptions, models may provide
insight about potential future states of the system.
Such simulations allow the operator to appreciate
interdependencies and their relative weightings in
a variety of conditions. Examples include discrete
choice models (see Chapter 6), system dynamics
models, stochastic models, econometric models (see
Chapter 18).
Forecasting
Quantitative
Deterministic or
Probabilistic
Data-, literature- or
expert-based
Plausibility
matrix
Developing a plausibility matrix requires a series of
questions to highlight the extent to which participants
agree about the future. It is designed to reveal
differences of opinion and to highlight the strategic
choices that need to be made to ensure that policies
or strategies are fit for the future.
Forecasting
Quantitative
Probabilistic
Stakeholder
participation
Continues
79.
RAND Europe 9:Futures research
Table 9.1 (continued): Brief descriptions of a selected sample of futures research
methodologies
Technique Description Characterisation
Roadmaps A roadmap is a visualisation of the future (often
64
5 years) integrating all relevant policy and
contextual aspects. A roadmap outlines the key
steps and milestones to respond to a particular
challenge. It outlines overall action plan and details
key objectives to be met. Combining research,
trends, applications, objectives and action plans,
it shows the development strands of key elements,
their connections with other strands and potential
applications that result.
Vision-building
Qualitative
Deterministic
Stakeholder
participation
Scenarios Scenarios are systematically derived representations
of plausible states of the future. They do not predict
the future. Rather they provide the means to consider
today’s policies and decisionmaking processes
in light of potential future developments that are
both uncertain and important. Scenarios enable
decisionmakers to identify, structure, and plan for
future uncertainties, and to take decisions that are
robust under different circumstances.
Utopian
Qualitative
Deterministic
Stakeholder
participation
Systems maps The objective of building a systems map is to
conceptually represent a complex situation and its
underlying structure through a set of variables and
its interrelations. The performance of organisations
and the effectiveness of policies often depend on
a myriad of endogenous and exogenous factors
with mutual dependencies. Representing the nature
and direction of these dependencies facilitates
characterisation of the potential policy levers in
the system. Systems maps may summarise and
communicate current developments, relationships
and boundary conditions that may have an impact
on future systems behaviour.
Forecasting
Qualitative
Deterministic
Literature- and
expert-based
Visioning The systematic creation of images of desirable
futures for the organisation of interest. Kicking
off with a review of historic and current trends,
consequently envisioning desirable futures, and
finishing with the identification of strategies to
achieve the desired future.
Vision-building
Qualitative
Deterministic
Stakeholder
participation
Trend analysis The examination of historic performance in order
to characterise possible future trends, their nature,
causes, longevity, and potential impact.
Forecasting
Quantitative or
qualitative
Deterministic
Data- or literature-based
80.
PERFORMANCE AUDIT HANDBOOK
65
9.3 When to use futures research
Since the success of virtually every decision
taken depends on factors that are beyond the
control of the decisiontaker, every policy devel-opment,
termination or amendment could
benefit from some form of futures research.
However, there are situations in which these
techniques are particularly pertinent:1
Situations where there are substantial
delays between actions and desired effects.
These typically concern contexts in which
the size of the required investments
conflicts with shorter-term objectives.
Examples of these include education
policy, large infrastructure projects, or
emission reduction to offset climate
change.
Sectors or policy areas undergoing
substantial transformations. Examples
include the financial sector, or the
position of China on the world stage.
Situations subject to significant surprises.
Although it is difficult to determine
which situations will be subject to
significant surprises, some areas tend
to be less predictable than others;
for example, technology-intensive
or innovation-heavy sectors such as
medicine, Internet services or energy
provision.
Situations where there are institutional
lock-in effects which yield a persistent
gap between goals and performance.
An example of such path dependency
is car traffic in a large metropolis,
which can be inefficient and expensive
and has considerable externalities. The
alternative option of introducing a more
efficient urban transport system without
these externalities (eg noise, emissions,
1 Adapted from Lempert et al. (forthcoming).
congestion), however, is not attractive due
to its extremely high sunk costs.
Situations with significant
interdependencies between different
policy domains, including unintended
side-effects, policy trade-offs and feedback
loops. These policy problems are typically
characterised by a large number of
stakeholders with competing interests.
Examples include large infrastructural
projects or employment policy.
Situations with considerable differences
between individual stakeholders’ interests
and collective (public or national)
interest. This is related to the first
situation as it will often occur when
an investment in future generations
is required at the expense of current
stakeholders. Examples include pension
reform or climate change.
In the situations described above, futures
research can have a number of merits, which
cut across the different stages of policymak-ing.
The concept of the “policy cycle” (see
Figure 9.1) is a helpful, heuristic framework
that breaks down the policymaking process
into several phases (see, for example, Brewer
and deLeon, 1983, May and Wildavsky, 1978,
Anderson, 1975).2 The figure below links the
different futures techniques listed in Table 9.1
to the policy phase in which they are most
useful.
2 In practice, the process of policymaking does not fol-low
such a strict linear sequence of stages. Instead processes
run in parallel, overlap, short-cut each other or are left out.
However, in absence of a better conceptual framework this
concept is used to illustrate the context of using scenarios
in policymaking.
81.
66
RAND Europe9: Futures research
Figure 9.1: The relevance of futures research methods at different stages of the
policy cycle
Delphi
Horizon scanning
1 2
Issue Issue
Systems maps
Trend analysis
framing
(or agenda-setting)
ssue
identification
(or problem
definition)
y
Modelling
6 3 Simulation
Monitoring and evaluation
of effectiveness
Identification of
policy alternatives
5 4
Development
Gaming
or adoption
of policy
measures
Policy
measure
implementation
Scenarios
Backcasting
Roadmaps Plausibility matrix
82.
PERFORMANCE AUDIT HANDBOOK
67
Futures research can be used to directly provide
support for decisionmaking, through inform-ing
specific decisions in the policy formulation
and implementation phase. It can, however,
also be used for various forms of indirect deci-sion
support, such as clarifying the importance
of an issue, framing a decision agenda, shaking
up habitual thinking, stimulating creativity,
clarifying points of agreement and disagree-ment,
identifying and engaging participants,
or providing a structure for analysing potential
future decisions (see Parson et al., 2007). The
various direct and indirect forms of decision
support can be roughly grouped into six
forms:
stimulating wider debate about possible
futures (indirect)
getting stakeholder buy-in or engagement
(indirect)
triggering cultural change within the
organisation (indirect)
clarifying the importance of an issue and
framing a decisionmaking agenda (direct)
generating options for future action
(direct)
appraising robustness of options for
future action (direct).
Futures research should be understood more
from a process-oriented perspective than from
a product perspective. The early phases of the
policy cycle require more indirect forms of
decision support, such as shaking up habitual
thinking in order to come to a new under-standing
of problems, or clarifying points
of agreements and disagreement in order to
establish a policy agenda. Direct forms of
policy support such as evaluating the feasibil-ity
of policy options are required in the policy
measure development and implementation
phases. Creating legitimacy for public action is
a cross-cutting issue through all phases.
The challenge is to match not only the dif-ferent
knowledge and information demands at
the different stages of the policy cycle, but also
the different levels of stakeholder engagement
that are required to ensure that the process is
regarded as relevant and legitimate. Identify-ing
key issues, framing the complexities and
uncertainties around them and highlighting
their policy relevance require broader thinking
from different perspectives. Engaging a larger
number of stakeholders creates the conditions
for imaginative and coherent conversations
about the future which explore alternative
possibilities.
9.4 Futures research is not a
panacea
Whilst there is broad consensus on the merits
of futures thinking, there is little evidence of
its effectiveness. Evidence is mostly anecdotal
and limited to a few “classic” stories from the
corporate world – such as Shell’s anticipation
of the 1974 oil crisis – that are often cited as
proof for the effectiveness and usefulness of
futures research in terms of supporting strate-gic
decisionmaking.
While there has been little evaluative
literature on futures research, studies on the
impact of strategic planning on organisational
performance have not delivered robust find-ings.
Ramanujam et al. (1986) observed: “The
results of this body of research are fragmented
and contradictory”, while Boyd (1991) con-cluded:
“The overall effect of planning on
performance is very weak.”
The limited attention to effectiveness may
be due to the notion that the effectiveness of
futures research is not a concept that is easy
to define. First, the effectiveness depends on
the objectives of the study, which are often
multiple, long-term and difficult to measure.
Second, even for one particular futures study,
different stakeholders may have different
83.
RAND Europe 9:Futures research
perceptions of its objectives and therefore have
different definitions of its effectiveness. But
it is also difficult to define the criteria for the
softer benefits of futures research: is it a suc-cess
68
when policymakers start to think about
longer-term consequences from a broader and
better-informed perspective? Is it a success
when scenarios help to better manage conflicts
between policymakers and stakeholders? Or
should scenarios directly influence the design
of policies? Answers to these questions vary
considerably among those from different
schools of thought.
Efforts are required to better bridge long-term
policy analysis in public policy and
understand the factors that condition effec-tiveness
and efficiency in terms of decision-support.
This is not an easy task.
The benefits attributed to developing
and using scenarios are manifold. Significant
gaps seem to exist, however, between current
scenario practice and the potential contribu-tions
of scenarios. It is unclear whether sce-nario
planning is really effective in delivering
a clearer path through the complexities and
uncertainties of our times (Chermack, 2005).
There is anecdotal evidence that many political
decisionmaking processes that could benefit
from these methodologies are not using them.
A recent literature review (Lempert et al.,
2009) shows that there is little evidence from
the public sector that the many scenario stud-ies
that have been conducted have had a posi-tive
effect on the robustness of organisations’
strategies or long-term decisionmaking.
9.5 Conducting futures research
As explained earlier, futures research is an
umbrella term for a range of techniques
used in long-term policy analysis. There is
a considerable and expanding body of aca-demic
literature in this field, and there are a
number of useful resources for practitioners.
Perhaps the most comprehensive and practical
resource is the online tool kit published by the
Horizon Scanning Unit in the UK Foresight
Directorate. It covers a range of futures tech-niques
and illustrates them with case studies
and good practice examples (HSC, 2008). This
section briefly discusses a possible approach to
one of the most common of these techniques:
scenario planning.
Scenarios have been employed by many
organisations, public and private, small and
large, around the world. The scenario axis
method elaborated by Peter Schwartz (1991)
is the most commonly used futures research
method in public organisations.
Scenarios are useful tools for raising
awareness and shedding new light on current
strategic debates. More importantly, multiple
scenarios can be used to test policy options for
robustness. If an option appears to be effec-tive
in several highly different scenarios, this
implies that it is robust in the range of plausible
futures spanned by the scenario dimensions.
For options that are not robust, it is important
to understand the circumstances under which
they are not effective.
Each scenario is a description of one possi-ble
future state of the system, but does not give
a complete description of the future system.
Scenarios include only those factors that
might strongly affect the outcomes of inter-est.
Because the only certainty about a future
scenario is that it will not be exactly what
happens, several scenarios, spanning a range
of developments, are constructed to cover a
range of possible futures. No probabilities are
attached to the futures represented by each of
the scenarios. They have a qualitative, not a
quantitative, function. Scenarios do not tell us
what will happen in the future; rather they tell
us what can (plausibly) happen.
Scenario thinking aims to identify new
developments, risks or impacts which might
84.
PERFORMANCE AUDIT HANDBOOK
69
otherwise have been missed. It is a means of
stimulating more informed and deeper conver-sations
about the future direction of a certain
policy area. Building scenarios is therefore an
exercise in both discipline and creativity. The
discipline is needed to structure the set of sce-narios
so that they reflect the issues requiring
exploration. Creativity is needed in filling out
the scenarios so that they become meaningful,
consistent and plausible. Box 9.2 sets out a
step-wise approach to the development of sce-narios
using the scenario axis technique.
Although evidence of the effectiveness of
scenario planning in improving the robustness
of long-term policy decisions is limited to date,
there is little doubt about its value as a tool for
stimulating debate among stakeholders about
the future and its uncertainties.
Box 9.2: Step-wise approach to
scenario building
Step 1 Specify the system and
define the outcomes of
interest.
Step 2 Identify external factors
driving changes in the
system.
Step 3 Identify system changes,
connections between these
factors and system changes
and how the changes affect
the outcomes of interest.
Step 4 Categorise the uncertainty
of the factors and system
changes.
Step 5 Assess the relevance of
the uncertain factors and
system changes.
Step 6 Select a small number of
highly uncertain factors
with high impact on the
outcomes of interest.
Step 7 Identify relevant positions
on these dimensions for a
small number of scenarios.
Step 8 Describe other attributes for
each scenario.
9.6 Futures research in action
(1) – helping the European
Commission to identify future
challenges in public health and
consumer protection
In 2006, the European Commission’s
Directorate-General for Health and Consumer
Protection (DG SANCO) embarked on a
series of activities to consider the challenges
it would face in 2009–2014. RAND Europe
supported this project by developing three
scenarios for Europe to be set in the period
2009 to 2014, testing these scenarios in case
85.
RAND Europe 9:Futures research
study workshops, and identifying the issues
and challenges arising from the project.
70
The process of creating the scenarios for
DG SANCO involved the gathering of data
on major trends and key uncertainties affect-ing
the future of public health and consumer
protection. These trends and uncertainties
were clustered in four areas: governance,
confidence, changing society and globalisa-tion.
This information informed an internal
workshop with SANCO staff that identified
eight key uncertainties which would have the
highest impact on the future of DG SANCO
in 2009–2014 (see Figure 9.2).
Many scenario development approaches
use a “scenario axes” method, which uses N
crucial uncertainties as the scenario dimen-sions
(or axes) in order to generate 2N dis-tinct
scenarios. The main advantage of this
approach is that it is easy to understand and
communicate. However, where more than one
or two critical uncertainties with high impact
have been selected, the number of resulting
scenarios is too large to use in a workshop
setting. In this case, eight highly uncertain fac-tors
with high impact on the future of public
health and consumer protection would have
resulted in 256 scenarios. Instead, three sce-narios
representing a spread across the extreme
ends of these eight uncertain dimensions were
selected in a scenario development workshop
with SANCO staff.
86.
PERFORMANCE AUDIT HANDBOOK
Figure 9.2: Eight critical uncertainties driving future change of public health and
consumer protection
71
RAND Europe 9:Futures research
Following this workshop, RAND Europe
fleshed out the three scenarios: Galapagos,
Coral Reef and Wave. These scenarios were
then tested and fine-tuned in four case study
workshops, each of which focused on a par-ticular
72
element that could affect the future
environment in which DG SANCO operates:
nanotechnology, consumer behaviour, ethical
food consumption and health equity.
Table 9.2: Brief description of the three
SANCO scenarios
Scenario Description
Galapagos
A diverse Europe
characterised by varying
interests and inequalities
that are difficult to reconcile
and which have left Europe
weak on a global scale.
Coral Reef
An apparently well-functioning
Europe, but
with an increasing divide
between a metropolitan elite
and those uninterested in
the European project.
Wave
A society in the aftermath
of a crisis where citizens’
confidence in information,
provided by information
and markets, regulation and
enforcement needs to be
regained.
9.7 Futures research in action (2) –
the future of civil aviation in the
Netherlands
Many European countries saw intense public
debate on the future of aviation and their
national airports during the 1990s. Schiphol,
in the Netherlands, had experienced a period
of considerable growth, while society increas-ingly
observed both positive (eg economic)
and negative (eg pollution, noise or safety)
externalities. The Ministries of Transport,
Public Works and Water Management
(VW), of Housing, Spatial Planning and
Environment (VROM), and of Economic
Affairs (EZ) commissioned a policy analysis
study on the future of the Dutch civil aviation
infrastructure. RAND Europe carried out this
research, aimed at helping to develop answers
to some of the policy questions to inform the
public debate. Assuming that the Netherlands
chooses to accommodate future air transport
demands, the task was to assess infrastructure
options for accommodating the demand,
identify their positive and negative attributes,
and draw conclusions about them.1
RAND developed five scenarios for the
future of civil aviation in the Netherlands in
2025. They were not given names, but referred
to as Scenario 1, Scenario 2, etc. They focused
on two things: the world of civil aviation,
and changes – both inside and outside the
civil aviation system – that were relevant for
making policy decisions about infrastructure
investments. The study identified a number
of structural uncertainties that would have a
potential impact on the future of civil aviation
in the Netherlands, including: (1) worldwide
growth of civil aviation; (2) the configuration
of the civil aviation system in Europe; (3) civil
aviation policies within the European Union;
(4) the development of competing transporta-tion
systems; (5) airport capacity in Europe;
and (6) aircraft technology. The two uncertain
factors with the highest potential impact deter-mined
the axes upon which scenario selection
was based (see Figure 9.3). Table 9.3 provides
an overview of the specific attributes of the five
scenarios.
With these scenarios, the researchers
assessed different infrastructure options.
1 Further details of this study are available in the draft
reports published by RAND Europe (EAC 1997a; 1997b),
which until 1997 went by the name of the European-
American Center for Policy Analysis.
112.
PERFORMANCE AUDIT HANDBOOK
73
Options included building an airport in the
North Sea to replace Schiphol, expanding
Schiphol at its existing location, building
remote runways in the North Sea, build-ing
a second national airport in addition to
Schiphol, and building a separate cargo air-port.
Each option was examined in all of the
scenarios and assessed on a set of qualitative
and quantitative criteria.
The analysis provided information on
the effects of a broad range of civil aviation
infrastructure options and made it possible
to compare the options on a consistent and
logical basis. An important finding of this
scenario study was that the relative ranking
of the infrastructure options on each of the
performance criteria was found not to differ
over the scenarios. As with many of these
assessments, however, the analysis did not
result in an unequivocal preferred option, but
preferences depended on the importance of
the various criteria to the various stakeholders
and policymakers.
Figure 9.3: Scenario axes for the future
of civil aviation in the Netherlands in
2025
Worldwide
growth of
Civil
Aviation
high
moderate
decline
2 1
3
5 4
low high
The importance of the Netherlands in
the European Civil Aviation network
113.
RAND Europe 9:Futures research
Table 9.3: Attributes of the future of civil aviation scenarios
74
Scenario No. 1 2 3 4 5
Worldwide growth of civil
aviation
High High Moderate Decline Decline
Configuration of European civil aviation system
Number of European
hubs/international
gateways
6 6 10 3 3
Number of European
airlines
6 6 10 3 3
Ownership of airlines Private Private Govt/
private
Private Private
Competition in airline
industry
High High Low High High
Hub or international
aviation gateway in NL
Yes No Yes Yes No
Presence of European
mega-carrier in NL
Yes No Yes Yes No
European Civil Aviation Policies
Elimination of government
subsidies to aviation
Yes Yes No Yes Yes
Existence of multilateral
air traffic agreements
Yes Yes No Yes Yes
Substitute transportation modes
Competition between
high speed trains and air
transport
Medium Medium High Low Low
Feeder role of high speed
trains
Low Low Medium Large Large
Airport capacity in Europe
Availability of airport
capacity in Europe
Yes Yes No Yes Yes
Aircraft technology
Proportion of mega-jumbos
in aircraft fleet
Moderate Moderate Small High High
Source: EAC (1997b)
114.
PERFORMANCE AUDIT HANDBOOK
75
9.8 Summary
Futures research is used by both the private
and public sector to prepare for possible future
developments. Various methods of futures
research have been developed over the past 35
or more years, and they all serve to improve
agenda-setting, our understanding of uncer-tainty
and stakeholder engagement.
9.9 Further reading
Kahn, H. and A.J. Wiener, The Year 2000:
A Framework for Speculation on the Next
Thirty-three Years, New York: Macmillan,
1967.
115.
RAND Europe 10:Grounded theory
CHAPTER 10
76
Grounded theory Richard Warnes
coding and analysis is to generate theory more
systematically … by using explicit coding
and analytic procedures” (p. 102). Effectively,
the researcher completes a highly systematic
and logical comparative analysis of the data,
coding emerging themes or categories of data
and noting any thoughts, links or ideas that
develop as the data is being processed.
Glaser and Strauss argue that this system-atic
“constant comparison” and coding allows
the comparative analysis of qualitative data,
leading to the emergence of more formal theo-retical
hypotheses.
10.3 When should grounded theory
be used?
The flexible conceptual framework of
grounded theory means that it is applicable
to a wide range of field research on real-world
phenomena. It is best suited when examining
a medium number of qualitative data sources,
such as a series of transcribed interviews from
key informants with insight into the particular
field or case study being researched. Clearly
this sits well when completing qualitative case
study-based research. Consequently, grounded
theory has been used extensively to analyse
qualitative data in the fields of public health,
corporate recruitment, education and evalua-tion,
among others (see Strauss and Corbin,
1997).
Grounded theory is very well suited to
performance audits of systems and structures
due to its applicability to the examination
of practical phenomena, its reliance on the
comparative analysis of data to allow an induc-tive
hypothesis to emerge, its focus on draw-ing
inferences from links in the data, and its
10.1 Key points
Grounded theory operates “backwards”
compared to traditional research.
Grounded theory takes an inductive
approach, gradually building cohesion
through the cumulative collection and
analysis of qualitative data.
Grounded theory uses different levels of
coding to draw meaning from qualitative
data.
10.2 Defining grounded theory
Grounded theory has been described by two of
its key exponents, Strauss and Corbin (1998),
as a theory which is “discovered, developed and
provisionally verified through systematic data
collection and analysis of data pertaining to
that phenomenon” (p. 23). It relies on taking
an inductive approach to qualitative data and
adopting a research goal that can be modified
or changed during the research process (see
Bottoms, 2000), in contrast to more deductive
theories and quantitative methods.
Thus instead of forming a deductive
hypothesis before analysis, and then testing it
against collected data, this process is reversed
and the collected data is constantly analysed
to allow an inductive hypothesis to “emerge”
from within the data. Hence the results and
any emerging hypothesis are “grounded” in
that data, and a researcher’s final conclusions
may not appear until all the data has been
collected, coded and comparatively analysed,
having been frequently changed and amended
during the process.
The originators of grounded theory, Glaser
and Strauss (1967), state that “the purpose of
the constant comparative method of joint
116.
PERFORMANCE AUDIT HANDBOOK
77
attempt “to get beyond static analysis to multi-ple
layers of meaning” (Gray, 2004, p. 330; see
also Locke, 2001).
10.4 How to use grounded theory
In their sourcebook on qualitative data analysis,
Miles and Huberman (1994) describe the ana-lytic
sequence involved in applying grounded
theory, which “moves from one inductive
inference to another by selectively collecting
data, comparing and contrasting this material
in the quest for patterns or regularities, seek-ing
out more data to support or qualify these
emerging clusters, and then gradually drawing
inferences from the links between other new
data segments and the cumulative set of con-ceptualizations”
(Miles and Huberman, 1994,
p. 14). This procedure is usually applied to the
textual analysis of data obtained through qual-itative
interviews of key individuals involved
in a process or structure, although the data
may be based on detailed field observations of
phenomena and events.
The skills and competencies needed to
implement this type of approach to the data
can be considered in several distinct phases.
The main methodological approach to process-ing
qualitative data is through a three-stage
process of “coding”:
open coding: comparing incidents
applicable to each category
axial coding: integrating categories and
their properties
selective coding: delimiting the theory.
Coding breaks down the data into as many cat-egories
as emerge, before re-integrating similar
categories and identifying emerging themes.
The categories chosen depend on the nature
of the data, their applicability and practicality,
and the decisions of the researcher. As the raw
data is coded through these stages, concepts
will emerge as the researcher begins to identify
links and associations. As these thoughts and
ideas emerge, it is critical to stop coding and
note them down while they are still fresh in
the mind. Such reminders can be anything
from a hurriedly scribbled note in a margin to
a detailed, typed research note.
10.4.1 Open coding
First, the data is analysed through open
coding, fragmenting the material into numer-ous
identified categories within the data, with
each category, concept or issue identified
being allocated a code (label). Glaser and
Strauss (1967) state that “the analyst starts by
coding each incident in his data into as many
categories of analysis as possible, as categories
emerge or as data emerge that fit an existing
category” (p. 105), while Strauss and Corbin
(1990) describe the process as “breaking down,
examining, comparing, conceptualizing and
categorizing data” (p. 61).
However, Gray (2004) reminds us that
an important aspect of the process is “making
constant comparisons … each time an instance
of a category is found, it is compared with
previous instances. If the new instance does
not fit the original definition, then either the
definition must be modified or a new cat-egory
created” (p. 332). Consequently, as the
data is progressively categorised and coded,
sub-categories, links and other analytically
developed thoughts will be identified from the
“richness” of the qualitative material – all of
which should be recorded to be examined later
as part of hypothesis development.
Data can generally be coded manually at
first, but as the process continues, appropriate
computer software, such as N-Vivo (see Field-ing
and Lee, 1998), will probably become
necessary. Computer coding can speed up
the process and help with both coding and
retrieval at a later stage.
117.
RAND Europe 10:Grounded theory
78
The codes or labels given to the various
categories identified in the disaggregated data
are up to the individual researcher, but as
Gray (2004) points out, researchers should be
aware that categories can be developed in two
ways, either according to specific properties or
according to dimension. Researchers must rec-ognise
that “the development of properties and
dimensions is crucially important because they
are central in making relationships between
categories and sub-categories and later between
major categories” (p. 333), leading on to the
subsequent analytical stages of the process.
10.4.2 Axial coding
Axial coding seeks to reassemble the data that
was fragmented during the open coding proc-ess.
This is achieved through relating subcate-gories
and linked categories, and amalgamat-ing
them into a smaller number of overarching
categories that explain the data. Thus the
multiple categories generated through open
coding will have to be examined with the
intention of identifying connections between
them. Related categories and sub-categories
are then integrated under more general and
wider categories.
The issue of whether such wider categories
should be preconceived or allowed to emerge
from the data led to a major doctrinal dispute
between the originators of this methodology.
Strauss (1987) argued for the use of four pre-conceived
categories:
conditions
interaction among the actors
strategies and tactics
consequences.
However, Glaser (1978) developed a broader
family of categories, as shown in Table 10.1
below, arguing that none of these should be
applied unless they emerged naturally from the
data as they were examined.
Notwithstanding such doctrinal disputes,
Gray (2004, p. 333) identifies four factors
that should be considered during the process
of reassembling the disaggregated data into
broader linked and integrated categories:
the category
the context in which it arises
the actions and interactions that stem
from it
its consequences.
118.
PERFORMANCE AUDIT HANDBOOK
79
Table 10.1: Glaser’s coding families
Family Examples
Six Cs Causes, contexts,
contingencies,
consequences,
covariances, conditions
Process Stages, phases,
progressions
Degree Limit, range, intensity
Dimension Elements, divisions,
properties
Type Type, form, kinds, styles,
classes
Strategy Strategies, tactics,
mechanisms
Interactive Mutual effects, reciprocity,
mutual trajectory
Identity-self Self-image, self-concept,
self-worth
Cutting
point
Boundary, critical juncture,
turning point
Means-goals
End, purpose, goal
Cultural Norms, values, beliefs
Consensus Clusters, agreements,
contracts
Mainline Social control, recruitment,
socialisation
Theoretical Parsimony, scope,
integration
Ordering or
elaboration
Structural, temporal,
conceptual
Unit Collective, group, nation
Reading Concepts, problems and
hypotheses
Models Linear, spatial
Source: Adapted from Dey, (1999), p. 107 and
Glaser (1978), p. 81
10.4.3 Selective coding
Having linked and integrated categories and
sub-categories in the data, in effect re-assem-bling
the raw data, they are then subjected to
selective coding, where the data is integrated
around a central category that has emerged
from the data itself.
According to Strauss and Corbin (1998)
“a central category has analytic power … what
gives it that power is its ability to pull the other
categories together to form an explanatory
whole … a central category should be able to
account for considerable variation within cat-egories”
(p. 146). Although both Glaser and
Strauss provide separate guides to the criteria
necessary for a central category, Dey (1999, p.
111) provides a useful summary of these crite-ria,
which can be used to guide this stage:
Central: it is related to many of the other
categories accounting for variation in the
data.
Stable: it is a recurrent pattern in the
data.
Incisive: it has clear implications for a
more formal theory.
Powerful: it has explanatory power
which carries the analysis to a successful
conclusion.
Variable: it is sensitive to variations in
conditions, such as degree, dimension
and type.
Sufficiently complex: it takes longer
to identify its properties than other
categories.
To achieve this point in the research, Glaser
and Strauss (1967) suggest that parsimony in
variables will occur, the number of categories
will be reduced and theoretical saturation will
be achieved (p. 111). In practical terms, this
means that while the theory solidifies, fewer
new categories will be needed to cover the data
as pre-existing categories suffice, until a point
119.
RAND Europe 10:Grounded theory
is reached where no new categories are needed.
Strauss and Corbin (1998) summarise, stat-ing
80
that “selective coding is the process of
integrating and refining the theory. In integra-tion,
categories are organized around a central
explanatory concept … once a commitment
is made to a central idea, major categories are
related to it through explanatory statements of
relationships” (p. 161).
10.5 Potential pitfalls in applying
grounded theory
Despite its usefulness and practicality, there
are a number of potential pitfalls in the
application of grounded theory as a research
methodology.
Miles and Huberman (1994) are con-cerned
about the flexibility of the conceptual
framework upon which grounded theory
is based and its design validity. While they
acknowledge that its flexibility and inductive
approach is preferred by many researchers,
they submit that “tighter designs … with well-delineated
constructs” (p. 17) provide greater
construct validity, such as the use of multiple
sources of evidence and the establishment of
a chain of evidence. They also point out “that
qualitative research can be out-right ‘confirma-tory’
– that is, can seek to test or further expli-cate
a conceptualization” (p. 17). This can be
considered in practical terms as the fact that
all researchers necessarily analyse and make
sense of data from their own perspective –
influenced by their own life experience as well
as by their prior knowledge of the problem or
issue. While on the one hand “there is a world
of difference between the abstract knowledge
in books and the practical knowledge required
for and acquired in everyday experience –
between reading what to do, seeing others do
it, and doing it for yourself” (Dey, 1999, p.
101), there is also the negative side, that such
life experiences also lead, no matter how hard a
person tries, to personal subjective bias. There
is therefore a consequent risk that in using
grounded theory, with its flexible conceptual
framework, researchers might merely reinforce
and support their own preconceived concepts.
Consequently, it is always beneficial to run
any research past a colleague for their objective
input.
Another potential pitfall is raised by Dey
(1999), who expresses concern that, in using
grounded theory as a research approach, there
is the risk of focusing so much on the minutiae
of coding and categorising the material that the
researcher might lose a more holistic under-standing
of the data, in effect losing sight of
the big picture. Consequently he suggests that
“there are processes that we can only under-stand
if we recognize the forest as a forest and
refuse to analyze it in terms of individual trees”
(p. 100). However, Strauss and Corbin (1998)
counter that a number of these potential pit-falls
are minimised or negated by ensuring the
researcher has a level of theoretical sensitivity,
that is “the ability to give meaning to data, the
capacity to understand and the capability to
separate the pertinent from that which isn’t”
(p. 42).
10.6 Grounded theory in action (1):
a performance audit of counter-terrorism
measures
Although not conforming to what might be
termed more traditional performance audits,
research is being carried out to identify the
effectiveness of counter-terrorism systems
and structures in seven “Western” countries,
supported by the Airey Neave Trust and the
National Police Staff College (Fielding and
Warnes, 2009).
This research is based on over a hundred
generic semi-structured interviews of key
policing, military and security officials in the
case study countries, utilising “how” and “why”
120.
PERFORMANCE AUDIT HANDBOOK
81
based questions regarding the various counter-terrorism
systems and structures the country
has introduced, their perceived effectiveness,
and the impact they have had on civil liber-ties.
Such questions are designed to generate
explanatory knowledge (see Yin, 2003, Chap-ter
2: Designing Case Studies) and the resultant
transcribed interviews are then used as the raw
data, which are being processed through the
use of grounded theory.
Each interview is coded using the system-atic
practical steps described above. In prac-tice
this involves subjecting the transcribed
interview to open coding, where the data are
fragmented into as many categories as emerge.
These are noted and recorded, before similar
categories and sub-categories are integrated
together into wider, overarching categories in
the second stage, axial coding.
These second-stage categories are then for-mally
coded through the allocation of relevant
titles. In the case of the specific research these
have included: Context-History, Organisation-
Structure, Membership-Recruitment, Drivers-
Inhibitors and Tactics-Operations. This has
proved particularly useful where a number
of different interviewees from one country
have identified the same issue, or structure, or
where interviewees in different countries have
identified similar methods or techniques of
responding to the threat of terrorism.
As the research progresses, selective coding
is developing; a single overarching theme
emerges, which effectively covers the measures
and responses introduced by a particular coun-try.
It is hoped that, ultimately, the resultant
material will help identify best practice and
the effectiveness of performance in the fields of
legislation, policing, the military, intelligence
and economics – in essence, those systems,
structures and methods that best mitigate
and counter the threat posed by modern
terrorism.
10.7 Grounded theory in action (2):
informing Lord Darzi’s review
of the National Health Service
A second example is taken from RAND Europe
research on behalf of Lord Darzi’s examination
of innovation in the NHS. A range of NHS
individuals, hospitals and trusts, medical aca-demics
and research institutes, professional
societies and bodies, private sector organisa-tions
and medical charities were consulted. A
number of these provided written responses
to a series of questions regarding three key
areas: barriers to innovation in the NHS,
policy measures to improve such innovation,
and significant challenges to the introduc-tion
of innovation in the NHS. These written
responses and the information they contained
were subjected to a form of grounded theory,
where the allocation of letters for coding was
staggered between researchers to check for
analytic consistency. The constant comparative
method was applied to the responses.
The first iteration of open coding resulted
in over 1,500 codes. Integration through axial
coding resulted in the generation of a code-book
containing 60 codes, which was further
reduced to 35 codes. These codes were then
applied to all the written responses and, as a
means of introducing a quantitative aspect to
the research, the results were quantified and
ranked. The delta was then calculated to see
the extent of the difference in the rankings
between the NHS sector, professional bodies,
academia and the private sector. Finally a cal-culation
was made of the total counts across
all the stakeholders to identify the top five
perceived barriers and the top five perceived
policies in relation to the introduction of inno-vation
in the NHS. This was then utilised as
a briefing tool to inform and focus the wider
research.
121.
RAND Europe 10:Grounded theory
10.8 Summary
Grounded theory provides a great deal of
flexibility in the processing of qualitative
data. Awareness of the pitfalls and concerns
allows researchers to mitigate any possible
impact these might have on the quality of the
research. Given its flexibility and effectiveness
in analysing systems and structures, it is a
useful research tool for performance audits, as
can be seen in the examples above.
82
122.
PERFORMANCE AUDIT HANDBOOK
83
CHAPTER 11
Impact assessment Jan Tiessen
11.1 Key points
Impact assessment is a form of ex-ante
evaluation of possible future policy
actions.
Impact assessment explores and compares
the costs and benefits of different policy
options to determine which is the most
beneficial overall.
Impact assessments are also used
to consult stakeholders, increase
transparency, and build consensus for
future policies.
11.2 Defining impact assessment
Impact assessment, often regulatory impact
assessment, is a formalised form of ex-ante
evaluation that is used to systematically assess
the negative and positive impacts of proposed
and existing regulations and other policy
initiatives. As part of the wider “better regula-tion”
agenda, the use of impact assessments in
government has spread rapidly among OECD
countries over the last decade, and the use of
impact assessment methods is now a common
feature of policymaking processes in many
OECD countries as well as in the European
Commission.
The main purpose of impact assessment
lies in supporting evidence-based decisions
about the best course of future action. Ideally,
an extensive impact assessment enables us to
identify the net benefits or costs of a policy
and compare them with a set of different
policy options in order to identify the option
with the largest net benefit.
An important element of such an analysis
is the quantification and monetarisation of
expected future impacts. In administrative and
political practice, however, impact assessments
are not only used to provide an evidence base
for policymaking, but are also used as a means
of facilitating consultation and consensus
building with stakeholders, and making policy
decisions more transparent.
11.3 When to use and when not to
use impact assessment
Impact assessments are usually conducted
because they are a mandatory element of
the policymaking and legislative process.1
Prominent examples are, for example, the
US, the UK, Australia and New Zealand, but
countries like Ireland, the Netherlands, and
Sweden also use impact assessment. Since
2003, the European Commission has had a
mandatory impact assessment system, which is
applied to all major policy proposals, including
white papers and broad strategy documents
(Radaelli, 2004).2
As impact assessments can be very exten-sive
and require substantial resources, many
countries limit their application. This is either
done by defining the type of proposal for
which they are required, or by formulating
some kind of proportionality principle. In the
US, a full regulatory analysis only has to be
conducted if expected impacts are above $100
million (Office of Information and Regulatory
Affairs, 2003). In the UK, only proposals that
1 (Regulatory) impact assessments are, for example,
compulsory for at least some proposals in Australia, Ger-many,
Ireland, the Netherlands, New Zealand, Sweden, the
UK, the US and the European Commission.
2 For an overview of different IA practices see, for
example, OECD (2004) or The European Observatory on
Impact Assessment (n.d.)
123.
RAND Europe 11:Impact assessment
have a cost effect on business or third parties
have to be scrutinised using an impact assess-ment.
84
The European Commission guidelines
on conducting impact assessments state that
the efforts put into an impact assessment shall
be proportionate to the importance and scope
of the policy proposal (European Commission,
2009). Other systems, like Ireland, attempt to
reduce the burden caused by impact assess-ments
by dividing them into two phases. All
proposals are first subject to a screening impact
assessment, and only if this preliminary analysis
suggests significant impacts does a full impact
assessment need to be conducted (Department
of the Taoiseach, 2005).
If conducting an impact assessment, con-sidering
the proportionality of the work will
thus be an important starting point. Second,
the level of detail of the impact assessment will
vary with the type of policy proposal being
assessed; the more general the proposal, the
more uncertainty there is as to how it could be
actually implemented, and the less precise the
assessment will be.
11.4 Conducting an impact
assessment exercise
Impact assessment is not a method in the
narrow sense; it is more a conceptual frame-work
for use when conducting a specific
type of ex-ante evaluation. This chapter thus
focuses on the analytical steps that need to be
conducted to produce an impact assessment.
Each country using impact assessments as
part of their policymaking process has specific
national guidelines, but nevertheless some key
analytical steps can be identified to provide
guidance on how to conduct an impact assess-ment.
Listed below are the guidelines issued by
the European Commission, which are among
the most comprehensive impact assessment
guidelines internationally (European Com-mission,
2009).
1. Problem definition
2. Definition of the objectives
3. Identification of policy options
4. Analysis and comparison of options
5. Presentation.
Due to the political nature of impact assess-ments
and their consensus building function,
consultation with stakeholders is often consid-ered
to be part of an impact assessment. More
information on this element can be found in
the chapter on stakeholder engagement.
11.4.1 Defining the problem
The first step of an impact assessment is to
describe the problem which the suggested
policy aims to tackle. In an impact assessment,
this step is essential to demonstrate why there
is a need for action at all. Some key questions
will help define the problem:
What is the problem?
What is the scale of the problem?
Why is it a problem?
What are the drivers and root causes of
the problem?
Who is affected by the problem?
At this stage, an assessment of how the prob-lem
might develop if no action is taken and the
status quo maintained might be conducted, to
illustrate the nature of the problem. A more
detailed assessment can, however, be provided
as the “no action” option in the assessment of
policy alternatives (see section 11.4.4).
11.4.2 Defining the objectives
Once the problem is defined, it is time to
clarify the objectives of the interventions to be
assessed. Defining the objectives is essential, as
the objectives of a policy will be the ultimate
yardstick against which to evaluate different
policy options. For the purpose of the impact
124.
PERFORMANCE AUDIT HANDBOOK
85
assessment it will be important to at least dif-ferentiate
between two levels of objectives:
1. High level, strategic objectives. These are
often defined by the broad policy field,
such as “improving the health of the
population”, “ensuring consumers make
safe and informed choices” or “fostering
economic growth”.
2. Low level, operational policy objectives.
These are the immediate effects expected by
the policy intervention, such as an increase
in organ donation rates or a reduction in
the number of misleading food labels.
Sometimes, it might even be helpful to include
medium level objectives. In any case, it is prac-tical
to organise the objectives into a hierarchi-cal
order and to link them together. In some
instances, this may uncover inconsistencies
in the objectives, and conflicting objectives
that might not necessarily be achievable with
the same policy. Trade-offs between these
objectives will need to be discussed later, while
assessing the options. A decision tree model or
similar visual techniques can be used to organ-ise
the objectives (see Figure 11.1).
11.4.3 Identifying policy options
After describing the policy problem and the
policy objectives, the next step is to consider
the policy alternatives or options. Depending
on the assignment, the task will either be to
describe the policy option provided for assess-ment,
or to draft different policy options. In
drafting policy options, international common
practice suggests:1
1. include a “no action” or “no change”
option as a baseline scenario
2. include only realistic, feasible options
3. consider alternatives to “command and
control” regulation, such as:
self-regulation
1 See, eg, IA guidance from Ireland, Australia, Sweden,
the UK and the EC.
Strategic Objective
Intermediate objective
Operational objective
Operational objective
Operational objective
Intermediate objective
Operational objective Operational objective
Figure 11.1: Hierarchy of objectives
125.
RAND Europe 11:Impact assessment
86
co-regulation
economic incentives
information campaigns.
The process of identifying options is best done
in a two-stage process. In the first, open, brain-storming
phase, a wide range of options can
be considered. In the second stage, this wide
range of options can be screened according to
an initial test of feasibility and effectiveness to
arrive at a manageable number of around three
to four policy options.
11.4.4 Analysing impacts of different
options
Having set out the policy problem, objec-tives
and options, the analysis proceeds to the
core of any impact assessment: analysing the
expected impacts of the policy options. The
process of analysing the impacts can be sepa-rated
into four steps:
1. identification of impacts
2. analysis of impacts
3. comparison of impacts between options
4. presentation of comparison.
Identifying the impacts
To identify the potential impacts of a proposed
policy option, a good place to start is to sys-tematically
map potential impacts of the poli-cies
being assessed. In doing so, the following
dimensions of impacts should be considered:
Direct and indirect impacts. Policies
might have not only direct impacts,
but also indirect effects that need to be
considered. For example, making helmets
mandatory for cyclists might reduce
serious head injuries among cyclists,
but at the same time it might lead to an
unwanted reduction in bicycle journeys
and an increase in car traffic.
Stakeholders. Policies are likely to
affect different stakeholders in different
ways. Typical stakeholders are business
and industry, citizens and public
administration. Sometimes it is necessary
to further sub-categorise stakeholders: for
example, businesses can be differentiated
by size or sector, citizens might be
consumers, patients or taxpayers, the
public sector might be affected at the
local, regional or national level.
Type of impact. Impact assessments try
to capture the full range of impacts. It is
thus important that an impact assessment
is not only concerned with economic
impacts, but also with less measurable
and tangible social and environmental
impacts. Most impact assessment
guidance thus stipulates and assesses
the economic, social and environmental
effects of the proposal, with health
impacts subsumed under social impacts.
Cost and benefit. Finally, it is important
to know whether impacts are positive or
negative. Negative impacts are usually
described in terms of costs, positive ones
as benefits.
Using these dimensions, the impacts of the
policy options can be identified. The ques-tions
set out to guide impact assessments
issued by various bodies, such as the European
Commission’s guidance, which provides an
extensive list of questions for all three types of
impacts, can be used (European Commission,
2009, p. 32). Finally, consultation of stake-holders
(often required in conjunction with
impact assessments anyway), might help
uncover further potential impacts.
Analysing the impacts
Once the most important direct and indi-rect
effects of the proposed action have been
captured, it is time to analyse the impacts.
Analysis should be based on a thorough col-lection
of evidence that can include document
126.
PERFORMANCE AUDIT HANDBOOK
87
and literature reviews, interviews with experts
in the field, surveys of the affected stakeholders
or statistical analysis. Analysis aims to compare
the impacts of each policy option against each
other and the status quo. In doing so, the
aim of impact assessment is often to quantify
(express in numerical values) and even mon-etarise
(express in monetary terms) the impacts
to increase comparability. Before starting the
analysis, it might be helpful to sift through
the long list of potential impacts to reduce the
number of impacts for analysis.
For some impacts, in particular economic
impacts, special analysis techniques are avail-able.
The European Commission requires, for
example, that a simplified standard cost model
be used to assess the administrative burden.
Other countries have special requirements to
assess the impact on small and medium-sized
enterprises (SME) (Australia) or competitive-ness
(Ireland).
Comparing options
Ultimately, the analysis will need to allow the
impacts of the different policy options to be
compared. To do this, there are a number of
techniques and methodologies available:
Cost-benefit analysis (CBA) is the
most rigorous technique for assessing
the different policy options in an impact
assessment. CBA aims to express all the
impacts, positive or negative, in monetary
terms and then to sum these up to arrive
at the net benefit of a policy option. It
can be attempted in full for all impacts,
or partially for some impacts.
A cost-effectiveness analysis can be
conducted when benefits are difficult
to quantify and all options attempt to
achieve a clearly defined objective. The
analysis will assess the cost-effectiveness
of the options that achieve the desired
objective.
Multi-criteria analysis (MCA) is a
method that is well suited to the practice
of impact assessment, which is often
plagued by a lack of sufficient evidence.
It does not require a full quantification
or monetarisation of all impacts. MCA
is a way of systematically contrasting
the available information about impacts
for each policy option. This can be, for
example, by stakeholder and impact
type, or by negative or positive impact.
On the downside, this method does not
allow an optimal or best option to be
clearly identified, as different types of
information – monetary, quantitative and
qualitative – have to be weighted against
each other.
An MCA framework can be supplemented by
a scoring exercise. In such an exercise, qualita-tive
information is made more comparable by
scoring each impact according to its severity
on a scale. An example of such a scale can be
found in Table 11.1 below. The scoring would
need to rely on the expert judgement of the
research team, based on the qualitative evi-dence
reviewed.
127.
RAND Europe 11:Impact assessment
Table 11.1: Scoring mechanism to compare non-quantifiable impacts
Score Description
++ Evidence of substantial additional health/economic/social benefits
88
compared to the status quo.
+ Evidence of some additional health/economic/social benefits compared to
the status quo.
≈ Evidence of no additional health /economic/social benefits compared to
the status quo.
- Evidence of some reduction in health/economic/social benefits compared
to the status quo.
-- Evidence of substantial reduction in health/economic/social benefits
compared to the status quo.
? No available evidence to assess changes in health/economic/social
benefits compared to the status quo.
The advantages and disadvantages of all three options are summarised in Table 11.2 below.
128.
PERFORMANCE AUDIT HANDBOOK
89
Table 11.2: Comparison of methods to assess impacts
Method Advantage Disadvantage
Cost-benefit
analysis
Accounts for all (negative and positive)
effects of policy measures.
Allows comparison of the ordering of
costs with the ordering of benefits of
the proposal over time.
Can also be used to rank alternative
(including non-regulatory) proposals
in terms of their net social gains (or
losses).
Cannot include impacts for which
there exist no quantitative or
monetary data.
Needs to be supplemented by
additional analysis to cover
distributional issues.
Cost-effectiveness
analysis
Does not require exact benefit
measurement or estimation.
Can be used to compare alternatives
that are expected to have more or less
the same outcome.
Does not resolve the choice of the
optimal level of benefits.
Concentrates on a single type of
benefit (the intended effect of the
measure), but would lead to an
incomplete result if possible side-effects
would not be assessed.
Provides no clear result as to
whether a regulatory proposal
would provide net gains to society.
Multi-criteria
analysis
Allows different types of data
(monetary, quantitative, qualitative)
to be compared and analysed in the
same framework with varying degrees
of certainty.
Provides a transparent presentation
of the key issues at stake and allows
trade-offs to be outlined clearly;
contrary to other approaches such as
cost-benefit analysis, it does not allow
implicit weighing.
Enables distributional issues and trade-offs
to be highlighted.
Recognises multi-dimensionality of
sustainability.
Includes elements of subjectivity,
especially in the weighting stage,
where the analyst needs to assign
relative importance to the criteria.
Because of the mix of different
types of data, cannot always show
whether benefits outweigh costs.
Time preferences may not always
be reflected.
Source: European Commission (2009)
129.
RAND Europe 11:Impact assessment
Presentation
The final element in comparing policy options
is the presentation of the final result. A tested
approach is to use a set of comparative tables
similar to those of an MCA framework. These
tables can be tailored to the specific needs
of the impact assessment. Table 11.3 below
shows a table summarising some of the ben-efits
90
of European action in the field of organ
donation and transplantation. This table dif-ferentiates
between different types of assess-ment
(qualitative, quantitative and monetary)
as well as providing a score (+ and ++) for
qualitative evidence. Other tables could be
produced to differentiate the impacts on dif-ferent
stakeholders, or to show an overview of
only economic or health impacts.
130.
PERFORMANCE AUDIT HANDBOOK
91
Table 11.3: Example of a summary table
Benefits
Impacts Type of impact
assessment
Option A Option B Option C
Donation rates Qualitative Increase possible, but very
uncertain
+ Increase likely ++ Increase likely ++
Quantitative Between 0 to between 8,000 and
20,000 more organs available per
year
Lower estimate 2,500 and 5,000
High estimate
8,000 and 20,000 organs per
annum
Lower estimate 2,500 and 5,000
High estimate
8,000 and 20,000 organs per annum
Monetary - -
Life years saved Qualitative Gain possible, but very
uncertain
+ Increase likely ++ Increase likely ++
Quantitative Up to 113,000 to 220,000 QUALYs
gained
Lower estimate 38,000 to
51,000 QUALYs gained
High estimate
113,000 to 220,000 QUALYs
gained
Lower estimate 38,000 to 51,000 QUALYs
gained
High estimate
113,000 to 220,000 QUALYs gained
Monetary
Treatment costs
saved
Qualitative Gain possible, but very
uncertain
+ Savings likely ++ ++
Quantitative
Monetary Savings of up to €1.2b for best case
scenario
Lower estimate €132m-€152m
High estimate
€458m to €1.2b
Lower estimate €132m-€152m
High estimate
€458m to €1.2b
Source: Based on Department of the Taoiseach (2005), using information from a study conducted by RAND Europe assessing the impacts of European action in the field
of organ donation and transplantation (RAND 2008)
131.
RAND Europe 11:Impact assessment
These tables will be useful for either
identifying the best policy option or (and
this is more likely) to illustrate the trade-offs
between different, feasible policy options.
For example, a self-regulatory solution might
be less effective in achieving some of the
objectives, but be considerably cheaper to
implement and come with fewer burdens
compared to a stringent regulation.
11.5 Impact assessment in action:
92
quality and safety standards
for organ donation and
transplantation in Europe
In 2008, RAND Europe was commissioned
to support the Directorate for Health and
Consumers (DG SANCO) of the European
Commission in an impact assessment on the
introduction of quality and safety standards
for organ donation and transplantation in
Europe.1
1 It is loosely based on an impact assessment conducted
by the European Commission Health and Consumer
Directorate-General with support from RAND Europe.
See European Commission (2008) and Tiessen et al.
(2008).
1. Defining the problem
The European Commission proposal was
intended to tackle at least two policy
problems:
A shortage of available organs for
transplantation, which exists despite
substantial potential to increase
donation rates in some countries.
There are currently no common
standards of quality and safety in
place in Europe; although cross-border
exchange of organs, the
mobility of organ recipients and
potential donors, and the close
link of organ donation to the use
of human tissues and cells create
major challenges to the diverse and
heterogeneous regulatory landscape as
it exists in Europe at present.
2. Defining the objectives
DG SANCO defined three objectives for
its proposed policies, which could all be
linked back to the ultimate objective of
achieving a high level of human health
protection. Interestingly, there are certain
trade-offs between making organs avail-able
on the one hand and improving the
quality and safety of organs on the other,
Main objective : high level of human health
protection (Article 152 of the Treaty)
Increase organ
availability
Enhance efficiency
and accessibility of
transplantation
systems
Improve quality and
safety of organs
Figure 11.2: Diagram of the three main policy objectives
Source: DG SANCO
132.
PERFORMANCE AUDIT HANDBOOK
93
as the latter might actually lead to an
increased rejection rate due to quality and
safety concerns.
3. Identifying policy options
To address the policy problem, DG
SANCO identified four policy options,
which varied in their scope and their regu-latory
approach:
Option 1: the European Commission
would continue with its current
activities in the field of organ
donation and transplantation, which
primarily involve sponsoring research
and pilot programmes in this field
and participating in international
cooperation such as in the Council of
Europe.
Option 2 proposes a non-regulatory
approach to the field of organ
donation and transplantation. This
option would establish a European
Action Plan on Organ Donation
and Transplantation for the period
from 2009 to 2015. The Action
Plan sets out a cooperative approach
between EU Member States based on
national action plans. This approach
is based on the identification and
development of common objectives,
agreed quantitative and qualitative
indicators and benchmarks, regular
reporting and identification of
best practices (open method of
coordination).
Option 3 combines the Action Plan
described under Option 2 with
a “flexible” directive, supporting
key elements of the Action Plan in
the area of quality and safety. The
regulatory approach of this directive
would be very much a framework
initiative, ensuring that national
legislation was put in place to deal
with key aspects of organ donation
and transplantation, but without
prescribing detailed policy measures.
Finally, Option 4 would combine the
Action Plan described under Option
2 with a “stringent” directive.
During the impact assessment, the options
were only specified in principle. Detailed
draft regulations only existed for Options
2 and 3, reflecting the consensus that the
“no action” or “very stringent directive”
options would not be politically desirable.
4. Analysing the options
To analyse the options, first the most
important impacts were identified and
evidence collected to assess them. The col-lection
of evidence included key inform-ant
interviews, document and literature
review, review of statistics and country
case studies. To structure the collection
efforts, a causal model was drawn up link-ing
the proposed actions to the intended
and unintended impacts of the proposed
policy.
Once identified, the impacts for
each option were analysed. Due to the
uncertainty of the effects of the different
options, this impact assessment resorted
to a combination of benchmarking and
scenario analysis to assess impacts.
The Spanish system of organ dona-tion
and transplantation is considered to
be one of the best systems in the world,
producing very high donation rates. The
policy measures were thus assessed in
terms of their resemblance to the Spanish
model, and in turn how likely it would be
that similar organ donation rates could
be achieved. Table 11.4 shows the results
of this benchmarking.
133.
RAND Europe 11:Impact assessment
Table 11.4: Benchmarking the policy option against the Spanish model
Key element
94
Option 1:
Baseline
Option 2: Action Plan
Option 3:
AP + flexible
approach*
Option 4: AP
+ stringent
directive*
Transplant
coordinators and
coordinating
teams in each
hospital
Variable
within and
across MS
All MS to “promote
the role of transplant
donor coordinators in
hospitals”
All MS to
“promote
the role of
transplant donor
coordinators in
hospitals”
All MS to
“promote
the role of
transplant donor
coordinators in
hospitals”
Reimbursement
of hospitals
to recover
procurement costs
Variable
across MS
Not contained in policy
option
Not contained in
policy option
Not contained
in policy option
A quality
assurance system
(or programme)
in all autonomous
communities, with
two stages of
evaluation
Variable
within and
across MS
All MS to (1) “[p]romote
quality improvement
programmes in
every hospital where
there is a potential
for organ donation,
which is primarily a
self-evaluation of the
whole process of organ
donation, aiming
to identify areas for
improvement”; and (2)
“evaluation of post-transplant
results”
Legal mandate
for (1) quality
programmes,
including quality
systems and
quality standards
in all MS; and (2)
inspections and
control measures,
subject to MS
decisionmaking/
implementation
Legal mandate
for (1) quality
programmes,
including
quality systems
and quality
standards in
all MS and
(2) inspections
and control
measures,
directed by the
EU Commission
Adequate training
for transplant
coordinators and
personnel involved
in organ donation
and procurement
Variable
within and
across MS
Promotion of the
Implementation of
effective training
programmes for
transplant donor
coordinators
Legal mandate
for personnel/
training in all MS,
subject to MS
decisionmaking/
implementation
Legal mandate
for personnel/
training in all
MS, directed by
EU Commission
Public awareness
and proactive
management
of mass media
opportunities
Variable
within and
across MS
All MS to “[i]mprove
knowledge and
communication skills
of health professionals
and patient support
groups for organ
transplantation”
All MS to
“[i]mprove
knowledge and
communication
skills of health
professionals and
patient support
groups for organ
transplantation”
All MS to
“‘[i]mprove
knowledge and
communication
skills of health
professionals
and patient
support groups
for organ
transplantation”
*In addition, all actions foreseen under the Action Plan will be implemented.
MS = Member States; AP = Action Plan
134.
PERFORMANCE AUDIT HANDBOOK
95
To develop an idea of the scope of the
improvements that could be achieved,
RAND Europe then developed four sce-narios
of how the rates of both living and
deceased organ donation might change.
These were subsequently used to identify
the likely health and economic impacts
of the policy proposals. The key scenarios
were as follows:
Scenario 1 is the best-case scenario, with
all countries achieving transplantation
rates equivalent to the currently best-performing
countries – Spain in deceased
and Norway in living organ donation.
Scenario 2 assumes all countries reach at
least European average transplantation
rates.
Scenario 3 assumes a substantial increase
in transplantation across all countries of
30 percent, based on the previous success
of countries in substantially increasing
donation rates.
Scenario 4 is a small increase scenario,
with a 10 percent increase across all
countries.
The scenarios were used to define the scope
of policy outcomes, based on assumptions
about increases in organ donation rates,
and were subsequently used to define the
upper and lower ranges of possible policy
outcomes for each option.
The scenarios allowed RAND Europe
to compare some of the impacts in a quan-titative
way, although expert judgement
was required to link the options to the
scenarios, and substantial amounts of the
data were qualitative, so the research team
resorted to scoring the different impacts as
well.
5. Presentation
The results of the impact assessment
were presented in a multi-criteria analysis
framework, using a set of tables to show
the types of impacts, as well as categoris-ing
them by stakeholders. The overview of
the health impacts can be found in Table
11.5.
11.6 Summary
Impact assessment is an increasingly common
tool for ex-ante assessment of the likely positive
and negative impacts of a policy. In essence,
impact assessments constitute a research
framework in which a multitude of analysis
techniques could be used, depending on the
policy field and the actual proposal.
Despite being methodologically demand-ing,
the major challenges encountered in
impact assessments arise in the most part from
the practice of conducting such a study. Impact
assessments are usually conducted against very
short timelines, there are very limited resources
available and often data availability (within the
short timeframe) is poor. A successful impact
assessment thus needs not only to be well
designed, but also to take into account these
practical constraints.
135.
96
RAND Europe11: Impact assessment
Table 11.5: Comparison of the health impacts of proposed policy actions
Intervention Option 1: Baseline Option 2: Action Plan Option 3: AP + flexible
approach
Option 4: AP + stringent
directive
Donation
rates
Donation rates will con-tinue
to be too low to meet
rising demands for organs;
thus leading to growing
waiting lists
≈
to
-
Depending on Member State
(MS) commitment, zero to sub-stantial
increases are possible:
- 0 to between 7,908 and
21,006 organs
≈
to
++
Medium to high increase pos-sible:
- lower estimate 2,636 and
4,983
- upper boundary 7,908 to
21,006 organs
+
to
++
Medium to high increase pos-sible:
- lower estimate 2,636 to
4,983
- Upper boundary 7,908 to
21,006 organs
+
to
++
QALYs and
life years
saved
No major change expect-ed,
but longer waiting lists
and waiting times might re-duce
the medical outcomes
of transplantation
≈
to
-
Estimates of donation rates will
lead to a range in MS from no
change to significant change:
- lower predictions show no
major change
- up to 119,314 to 231,006
life years saved
- up to 113,348 to 219,456
QALYs gained
≈
to
++
Estimates of donation rates will
lead to:
- lower estimate of 39,771 to
54,320 life years saved
- lower estimate of 37,783 to
51,604 QALYs gained
- up to 119,314 to 231,006
life years saved
- up to 113,348 to 219,456
QALYs gained
+
to
++
Estimates of donation rates will
lead to:
- lower estimate of 39,771 to
54,320 life years saved
- Lower estimate of 37,783 to
51,604 QALYs gained
- up to 119,314 to 231,006
life years saved
- up to 113,348 to 219,456
QALYs gained
+
to
++
Risk to pa-tients
No changes to the cur-rently
diverse regulatory
landscape of quality and
safety standards
≈ Better knowledge about organ
transplantation outcomes will
improve future transplantations
for patients
+ Common quality and safety
standards will ensure equal
health protection in all MS
Adverse event-reporting sys-tems
will improve the quality of
donation and transplantation
++ Common quality and safety
standards will ensure equal
health protection in all MS
Adverse event-reporting systems
will improve the quality of dona-tion
and transplantation
++
++: substantial health benefit; +: some health benefit; ≈: no substantial health impact; - : some additional negative health impact; - - : substantial negative health
impact; ?: no evidence
Continues
136.
PERFORMANCE AUDIT HANDBOOK
97
Table 11.5: Comparison of the health impacts of proposed policy actions (continued)
Intervention Option 1: Baseline Option 2: Action Plan Option 3: AP + flexible
approach
Option 4: AP + stringent
directive
Living dona-tion
No change expected ≈ Will encourage more living
donation
May increase knowledge about
medical outcomes
Increases trust in system
+ Legal standards will supple-ment
measures under the Ac-tion
Plan and make them less
uncertain to occur
+ Legal standards will supplement
the measures under Action Plan
and make them less uncertain
to occur
+
Health
benefits of
cross-border
exchange
Currently only very few
organs are exchanged
outside Eurotransplant and
Scandiatransplant area,
but potential for substantial
health benefits
≈ Improved processes and remov-al
of barriers to exchange of
organs may increase exchange
of organs and benefit small MS
and difficult-to-treat patients
+ Common quality and safety
standards will supplement
measures under the Action
Plan, which may increase
organ exchange and make
it safer
+ Common quality and safety
standards will supplement
measures under the Action Plan,
which may increase organ ex-change
and make it safer
+
Health in-equalities
Evidence suggests health
inequalities in the practice
of organ transplantation
and donation along lines
of gender, ethnicity and
certain specific diseases
≈ Anticipated benefits from im-proved
processes and removal
of barriers to exchange of
organs will not include reduced
health inequalities
≈ Anticipated benefits from im-proved
processes and removal
of barriers to exchange of
organs will not include reduced
health inequalities
≈ Anticipated benefits from im-proved
processes and removal
of barriers to exchange of
organs will not include reduced
health inequalities
≈
++: substantial health benefit; +: some health benefit; ≈: no substantial health impact; - : some additional negative health impact; - - : substantial negative health
impact; ?: no evidence
137.
RAND Europe 11:Impact assessment
11.7 Further reading
Council of the European Union (2004),
98
A Comparative Analysis of Regulatory
Impact Assessment in Ten EU Coun-tries,
2004. As at 6 October 2009:
http://www.betterregulation.ie/eng/
Publications/A_COMPARATIVE_
ANALYSIS_OF_REGULATORY_
IMPACT_ASSESSMENT_IN_TEN_
EU_COUNTRIES.html
EU Impact Assessment Board (IAB), Report for
the Year 2007, 2008.
International Workshop on Conformity
Assessment (INMETRO), Regulatory
Impact Assessment: Methodology and Best
Practice, 2006. As at 6 October 2009:
http://www.inmetro.gov.br/qualidade/
eventoAC/shortall.ppt
Jacobs and Associates, Current Trends in
Regulatory Impact Analysis: The Chal-lenges
of Mainstreaming RIA into Policy-making,
2006a. As at 6 October 2009:
http://www.regulatoryreform.com/pdfs/
Current%20Trends%20and%20Proc-esses%
20in%20RIA%20-%20May%20
2006%20Jacobs%20and%20Associates.
pdf
Jacobs and Associates, Regulatory Impact Anal-ysis
in Regulatory Process, Methods and Co-operation.
Lessons for Canada from Interna-tional
Trends, 2006b. As at 6 October 2009:
http://www.bibliotheque.assnat.qc.ca/01/
mono/2007/04/933268.pdf
Jacobs and Associates, Regulatory
Impact Analysis. Results and Prac-tice,
2006c. As at 6 October 2009:
http://info.worldbank.org/etools/
docs/library/239821/RIA%20in%20
Economic%20Policy%20Jacobs%20
Jakarta%20April%202007.pdf
Meuwese, A.C.M., Impact Assessment in EU
Lawmaking, Austin, TX: Wolters Kluwer
Law Business, 2008.
National Audit Office (NAO), Evalua-tion
of Regulatory Impact Assessments
2005–2006, 2006. As at 6 October 2009:
http://www.nao.org.uk/publications/
nao_reports/05-06/05061305.pdf
National Audit Office (NAO), Evalua-tion
of Regulatory Impact Assessments
2006–2007, 2007. As at 6 October 2009:
http://www.nao.org.uk/publications/
nao_reports/06-07/0607606.pdf
New Zealand Institute for Economic Research
(NZIER), Compliance with Regula-tory
Impact Analysis Requirements: 2007
Evaluation, 2008. As at 6 October 2009:
http://www.med.govt.nz/upload/57459/
riau-nzier-evaluation-report-2007.pdf
Office of Management and Budget (OMB),
Final Bulletin for Agency Good Guidance
Practices, 2007. As at 6 October 2009:
http://www.whitehouse.gov/omb/memo
randa/fy2007/m07-07.pdf
Office of Management and Budget (OMB),
Review of the Application of EU and US
Regulatory Impact Assessment Guidelines
on the Analysis of Impacts on International
Trade and Investment. Final Report and
Conclusions, 2008. As at 6 October 2009:
http://www.whitehouse.gov/omb/inforeg/
reports/sg-omb_final.pdf
Organisation for Economic Cooperation and
Development (OECD), Regulatory Impact
Analysis. Best Practices in OECD Countries,
Paris, 1997.
Organisation for Economic Cooperation and
Development (OECD), Comparison of
RIA Systems in OECD Countries, paper
presented at the Conference on the Fur-ther
Development of Impact Assessment
in the European Union, 2006.
Productivity Commission, Regulation and Its
Review 2005–2006, 2006. As at 6 October
2009:
138.
PERFORMANCE AUDIT HANDBOOK
99
h t t p : / / w w w. p c . g o v. a u / a n n u a l r e
port s / regulation_and_its_review/
regulationreview0506
Productivity Commission, Best Prac-tice
Regulation Report 2006–2007,
2007. As at 6 October 2009:
http://www. p c . g ov. a u / a n n u a l re
port s / regulation_and_its_review/
bestpracticeregulation0607
Renda, A., Impact Assessment in the EU: The
State of the Art and the Art of the State,
Brussels: Centre for European Policy Stud-ies,
2006.
The Evaluation Partnership Ltd (TEP), Evalu-ation
of the Commission’s Impact Assessment
System, 2007. As at 6 October 2009:
http://ec.europa.eu/governance/impact/
key_docs/docs/tep_eias_final_report.pdf
139.
RAND Europe 12:Key informant interviews
CHAPTER 12
100
Key informant interviews Aasha Joshi
12.1 Key points
Key informant interviews provide insight
into selected experts’ understanding of
the implementation, utility and efficacy
of a programme.
Key informant interviews require skilled
interviewers if they are to yield useful
information.
12.2 Defining key informant
interviews
Key informants are those people within an
organisation who have “specialized knowl-edge,
skills, or expertise” (McKernan, 1996,
p. 131). Thus interviewing key informants can
be a useful method for understanding the par-ticular
contexts in which programmes are (or
will be) implemented and how those contexts
may shape the depth and extent of programme
implementation within an organisation.
Although the information garnered from
key informant interviews cannot necessarily
be generalised to the organisation at large, it
allows interviewers access to in-depth percep-tions
which are not easily accessible through a
random selection of interview respondents.
Key informant interviews can provide gen-eral
descriptions of the process of programme
implementation, and can provide interview-ers
with particular insights into informants’
understanding of a particular problem or
programme, including a programme’s viewed
objectives, structure, implementation, utility
and different outcomes. In the course of the
interview, the informants will probably men-tion
various phenomena including their beliefs,
values, roles, experiences, behaviours, and rela-tionships
to others within an organisation, all
of which can be important in understanding
the area of investigation (Bryman, 2001, p.
319).
12.3 When to use key informant
interviews
Interviews with key informants are most
useful as a data collection method when the
research objective is to understand informants’
(possibly differing) views of a programme or
common setting, to document their experi-ences
in implementing a programme, or to
describe differing outcomes across people or
sites.
They are not as useful as a stand-alone
method when the primary research objective
is to measure outcomes across an entire setting
or programme, or to determine the cause or
effects of an implemented programme.
12.4 How to conduct key informant
interviews
Successful key informant interviews depend on
choosing the best way to ask questions for the
required research objective, and on the skills of
the interviewer in getting the most informative
and detailed answers to those questions.
Deciding how to ask interview questions is
contingent on why and about what the ques-tions
are being asked; the kinds of information
needed to answer the audit’s research questions
will determine how to collect relevant infor-mation
from the informants. To collect this
information, one of the goals for the interview
should be “to provide a framework [of ques-tions]
within which people can respond in a
way that represents accurately and thoroughly
their point of view about a programme”
140.
PERFORMANCE AUDIT HANDBOOK
101
(Patton, 2002, p. 21). For performance audits,
this framework takes on two general interview
forms: structured and semi-structured.
Structured interviews require that inter-viewers
ask all of the informants an identical
set of questions, which should be piloted for
clarity and ease of understanding prior to the
interview (Office of Auditor General of Canada,
1998, p. 30). Structured interview questions
can be closed-ended, that is, the interviewer
asks a question and offers the informants a set
of possible answers from which to select their
response, or they can be open-ended, that is,
the interviewer asks a question and informants
give their own impromptu responses.
An interviewer should choose the format
of the questions depending on the type of
information sought. For example, auditors
may be interested in exploring collaboration
patterns of customer service representatives.
A possible closed-ended question might be:
“Which of the following best describes your
working behaviour?” The answer choices
presented to the informant could be (1) “I
never work alone”; (2) “I work alone less than
half the time”; (3) “I work alone most of the
time” (Zikmund, 1997, p. 388). A possible
open-ended question might be: “How often
do you work directly with your colleagues?”
Informants would then offer their immediate
response to the question.
Asking all of the informants the same
questions has two primary advantages. First,
answers to specific questions can be easily com-pared
across all of the interviews. For example,
for the questions above, auditors would be
able to see immediately how often each of the
informants worked with his/her colleagues,
allowing them to identify possible patterns in
work behaviour. Second, the standard format
does not require interviewers to be highly
practised or skilled, although they do need
to be sufficiently trained to be aware of how
they ask the questions and record responses, to
avoid encouraging particular answers from the
key informants.
A fundamental limitation of structured
interviews is that the questions and answers
do not allow sufficient, detailed access into
the informants’ points of view. With regard to
the collaboration example, responses from the
structured questions do not elaborate on the
circumstances that influence certain behaviours
(such as office location, nature of the work task
or formal opportunities to exchange informa-tion
with one another). It is these views that
are integral to understanding the programme
under investigation.
Semi-structured interviews attempt to
address this limitation. They are particularly
useful when trying to clarify a complex issue,
such as determining if a programme was
planned, implemented and managed in an
appropriate way respective to time, cost and
service outcome. Interviewers often use a mix
of closed-ended and open-ended questions;
they use the latter to respond, probe, and
follow-up informants’ answers. An initial set
of pre-determined questions, which again have
been piloted for clarity, are used as a guide-line
for discussion. Although all of the topics
addressed in the pre-determined questions
should be covered by the interviewer, the ways
in which the questions are phrased, as well as
the order of the questions themselves, is not
limited.
The hallmark of semi-structured inter-views
is the flexibility they give the interviewer
and the informant during the interview proc-ess.
This flexibility relies on interviewers being
able to listen attentively and to quickly discern
when an informant should be prompted for
further discussion after an initial response has
been given. These prompts can take various
forms, some of which are explained in depth
by Kvale (1996) in InterViews: An Introduction
141.
RAND Europe 12:Key informant interviews
to Qualitative Research Interviewing. The
described prompts include introducing ques-tions,
102
probing questions, specifying questions,
direct questions, indirect questions, inter-preting
questions, structuring questions, and
silence. Each can be helpful to the interviewer
in patterning the interview into an informa-tive
data collection tool (rather than into an
exercise in desultory maundering).
Table 12.1: Types of interview prompts
Prompt Example
Introducing
questions
Interviewer: “What does
your role in the department
entail?”
Probing
(elaborating)
questions
Interviewer: “Can you say
something more about
that [referring to a specific
topic within the informant’s
response]?”
Specifying
questions
Key Informant: “It’s just not
helpful to people.”
Interviewer: “Have you
experienced that yourself?”
Direct
questions
Interviewer: “Are you
pleased with the quality
of the customer service
training?”
Indirect
questions
Interviewer: “How
are customer service
representatives trained in
the department?”
Interpreting
questions
Interviewer: “I want
to make sure I am
capturing what you are
saying. I have heard you
say [recapitulation of
informant’s responses]. Is
this a fair characterisation?”
Structuring
questions
Interviewer: “We’ve talked
a bit about [general topic],
and I’d like to introduce a
slightly different topic now.”
Silence Silence can provide the
informant the necessary
time to reflect and construct
a complete answer to a
question
Source: Adapted from Kvale (1996), pp. 133–135
Deciding when to use a particular prompt in
a semi-structured interview relies exclusively
on the discretion of the interviewer. Such dis-cretion,
in order to be exercised successfully,
assumes that the interviewer possesses several
particular qualities (Kvale, 1996). The effective
interviewer:
is gentle with informants, allowing them
to complete their sentences and answer
questions in their own timeframe
is critical, addressing inconsistencies in
the informants’ answers
is clear, asking simple, jargon-free
questions
is open, responding to themes noted as
important by the informant
is sensitive, attending and responding to
verbal and non-verbal cues given by the
informant
understands the purpose of the interview
and knows the overall study
structures an interview so that its purpose
and format are apparent to the informant
steers interviews to keep to their intended
purpose
remembers previous answers and refers to
them during the interview
summarises (without imparting meaning)
the informants’ answers by asking for
clarifying and confirming information
when needed.
Ideally, the qualified interviewer will ensure
that they ask the informant the sort of ques-tions
that will elicit the necessary information
to answer the audit’s overarching research
142.
PERFORMANCE AUDIT HANDBOOK
103
questions, the ultimate purpose of the
interview.
If the interview questions are designed
appropriately and they (and their accompany-ing
prompts) are asked skilfully, the semi-struc-tured
interview should generate rich informa-tion
about the topics under examination.
However, with this abundance comes the
potentially limited ability to compare responses
directly across all of the interviews. Given the
leeway granted to interviewers in phrasing
and ordering questions, as well as the possibly
varying response styles of informants (rang-ing
from discursive and verbose to concrete
and reticent), answers to particular interview
questions or even to the topics discussed will
require an attentive eye during analysis.
Irrespective of the type of interview
conducted – structured or semi-structured –
there are some common pitfalls that should
be avoided, such as conducting the interview
in a noisy setting or leading the informants’
responses (no matter how unintentionally).
The interviewer should try to schedule the
interview in a setting with minimal distrac-tion,
preferably a room with a closed door,
in which only the interviewer and the key
informant will be able to hear each other. If
others can hear the informant, she or he may
feel inhibited in offering candid responses.
Before the interview even begins, the
interviewer should explain the interview proc-ess
and its purpose. This explanation should
address the scope of the interview, describing
its general purpose (eg, to learn more about
how a specific programme is working out; to
figure out if any improvements need to be
made to a particular process), and any topics
that will be discussed (eg, programme need,
costs, or achievements). Before the interviewer
asks any interview questions, confidential-ity
(eg, if the informant’s name or any other
identifiable information will be made known
to anyone outside of the auditing team)
should be talked about, and the interviewer
should encourage the informant to ask any
clarifying questions about how any informa-tion
obtained from the interview will be used.
Finally, the interviewer should provide his/her
contact information so that the informant can
discuss any new concerns about the interview
after it has concluded.
Table 12.2: Examples of common
pitfalls in interviewing
Interruptions from outside (eg, telephone
calls or visitors walking into the room)
Competing distractions (eg, loud noises)
Nervousness in interviewer or key
informant
Interviewer jumping from one topic to
another
Interviewer instructing the informant (eg,
giving advice)
Interviewer presenting their own
perspective on a situation
Source: Adapted from Field and Morse (1989),
referenced in Britten (1995)
During the interview itself, the interviewer
should record the informant’s responses by
taking detailed notes and preferably audio-taping
the interview. After the interview, the
notes should be written up, noting the ques-tions
answered or the topics discussed and the
informant’s responses, using the informant’s
own words as much as possible. To capture
the informant’s view accurately, the interview
write-up should reference the audio-recording
extensively.
Any unresolved contradictions in the
informant’s responses should be noted, along
with their answers. Ideally, the audio-tapes
should be transcribed in their entirety. The
transcripts offer a verbatim record of both the
143.
RAND Europe 12:Key informant interviews
interviewer questions and informant answers,
enabling more precise analysis. Recognising
that transcription is time- and cost-intensive,
the minimum requirement is that those sec-tions
104
of the interview directly relevant to the
audit’s research questions should be quoted
verbatim from the audio-recording in the
interviewer’s write-up.
The auditors will draw conclusions based
on analysis of the interview notes or interview
transcripts. Refer to the grounded theory sec-tion
of this handbook for guidance on one
approach to analysing interviews.
12.5 Key informant interviews in
action
Key informant interviews are often a contrib-uting
part of a research project; RAND Europe
has used them in a number of projects. They
can be used to:
gain understanding of a specific area
get views on practice in an area
get perceptions or opinions on specific
topics
arrive at recommendations.
In many cases, semi-structured interviews do
all these and are thus exploratory, but also look
at potential views and recommendations that
interviewees would have on particular topics.
Most interviews that RAND Europe under-takes
are semi-structured. For instance, on a
project for the National Audit Office, trying to
understand the UK hidden economy in com-parison
with other countries, we presented
interviewees in international tax authorities
with a detailed research template. This allowed
respondents to give the interviewer insights on
each topic that needed to be covered but also
enabled them to take the template and provide
more detailed responses via e-mail. Using both
approaches allowed for more sustained inter-action
and thus avoided confusion over the
questions in the research template. Moreover,
it provided the researcher with more detailed
information. The research template appeared
as follows:
1. General overview of the revenue system
a. Structure of tax administration
Organisational features of tax
administration (special attention
on units/directorates involved with
hidden economy)
b. Taxation
Breakdown of main revenue/
tax streams (special attention on
particular country-specific taxes)
Overall tax burden
Balance between direct and indirect
taxes in overall revenue
c. Resources within tax administration
for dealing with hidden economy
2. Definitions of hidden economy
a. How is the hidden economy defined
by tax administration?
b. What is the size of the hidden
economy? (using national estimates
or those produced by the tax
administration for all or a part of
the hidden economy) – Are these
estimates broken down further into
subgroups? If the tax administration
does not produce any estimates on
the size of the hidden economy
– what are the reasons for this?
(difficulty/ complexity) In the
absence of estimates, is there any
qualitative assessment?
c. Trends in the size of hidden economy
d. Causes identified by tax
administration and in the literature
for the size of the hidden economy
3. Strategy of tax administrations
a. What is the objective of the tax
administration in dealing with the
144.
PERFORMANCE AUDIT HANDBOOK
105
hidden economy?
b. What priority does the tax
administration give to the hidden
economy compared with the other
risks it is tackling? (Eg, is tackling
the hidden economy in the top 10
priorities? Why has it been given this
priority compared to other risks?)
c. What research has the tax authority
carried out into the motivations of
those in the hidden economy and
how has it used the results?
d. What are the main risk groups
identified by the tax administration
(including concerns for the future)
and the reasons? For example:
labour providers
construction
buy to let
young people
e-commerce
vulnerable low skilled
taxpayers with offshore holdings, eg
bank account deposits
etc.
4. Key initiatives of the tax authorities
What are the main initiatives used in the
tax administration in the areas of:
a. Encouraging people and businesses
into the formal economy? (through
helping people join the formal
economy such as simplifying tax
requirements for micro/small
businesses, understanding and
influencing behaviour, providing
help to people to encourage them
to transfer to the formal economy,
voluntary disclosure schemes)
b. Detection approach? (eg hotlines,
data matching, internal referral,
referrals by other organisations and
the way detected cases are handled
such as writing/telephoning initially
to encourage businesses to register/
investigation of cases)
c. Sanctions? (interest/surcharges/
financial penalties / prosecution/
numbers and amounts involved)
d. Other?
e. Are there examples of joint working
across the public and private sectors
in dealing with the hidden economy?
5. Results achieved by initiatives
a. Measurement of impact of initiatives
used in tax administration (using
targets/ monitoring trends/
evaluations and other sources)
b. Cost-effectiveness of initiatives (do
tax administration report on cost-effectiveness;
are there independent
evaluations)
c. Monitoring the compliance with tax
requirements of those previously in
the hidden economy.
12.6 Summary
Key informant interviews allow us to gather
perceptions about a particular programme
from experts who have in-depth understand-ing
of the problems and issues involved. They
can yield information that might not other-wise
be accessible through more randomised
data collection methods.
145.
RAND Europe 13:Logic models
CHAPTER 13
106
Logic models Lidia Villalba van Dijk
13.1 Key points
Logic models are graphic representations
of the essential elements of a programme.
Logic models encourage systematic
thinking about the programme and its
underlying assumptions.
Logic models can be used to identify
causality and expose gaps in a
programme.
13.2 Defining the logic model
A logic model represents graphically the “key
ingredients” or elements of a programme
(inputs, activities, outputs and outcomes).
Logic models make their users think system-atically
about the different elements of a pro-gramme,
about the assumptions underlying
the programme and potentially about other
external factors affecting the achievement
of the ultimate outcomes. By facilitating the
identification of and linkages between the ele-ments
of a programme, logic models provide a
better understanding of what may be achieved
through the programme, and whether the pro-posed
links between the different elements flow
logically towards the intended outcomes. As a
result, logic models can serve as an ideal guide
to planning, monitoring and evaluation.
Until recently, logic models were widely
used in the area of health and social welfare
programmes. However, increasingly they are
also being used in public sector work and
in NGO work, mainly as a tool to dem-onstrate
accountability through improved
performance.
The most basic logic model depicts how a
programme works. It is a graphical represen-tation
that describes how inputs or resources
feed into a sequence of activities, and how
these activities are linked to the results a
programme is expected to achieve. In simple
terms, a logic model illustrates the connection
between Planned work, which describes the
types of resources (or inputs) and the activities
that need to happen to carry out a programme,
and Intended results, which includes all the
programme’s results over time; outputs, out-comes
and impacts (W.K. Kellogg Founda-tion,
2001).
McCawley (n.d.) suggests that even before
populating the logic model, it is important to
reflect on the situation of the programme –
the statement of the problem, a description of
who is affected and who is interested in the
problem. Reflecting on the situation will give
the evaluator an opportunity to communicate
the relevance of the project, identify who
has been affected, and provide a baseline for
comparison to determine whether change has
occurred. Then, we can start populating the
elements of the logic model based on:
1. Planned work
Inputs are the resources needed
to operate the programme. They
typically include human resources
(staff, volunteers, partners, etc),
financial resources (funds, grants,
donation, user fees, etc), other inputs
such as facilities and equipment,
involvement of collaborators (eg
local and national agencies) and
so on. It is possible to monetise
all inputs, converting them into a
certain currency value. Evaluations
that compare programme costs
146.
PERFORMANCE AUDIT HANDBOOK
107
with outputs (technical efficiency)
or programme outcomes (cost-effectiveness),
or compare costs to
monetised values of outcomes (cost-benefit
analysis), all require estimates
of inputs in a common currency.
Activities or clusters of activities
that are needed to implement a
programme. The activities can
be organised in work groups for
each type or cluster of activities,
or they can be organised so that
activities are performed by different
administrative units. How activities
are organised and performed depends
on the nature of the programme,
the structure of the organisation,
and the environment in which the
programme operates.
2. Intended results
Outputs are the direct product
of programme activities, and are
typically tangible and countable.
Outputs generally refer to what
is being done or what is being
produced. The type of output will
depend on the programme under
consideration. For example, the
outputs of an advertising campaign
might typically include the number
of local press adverts, number of TV
adverts, website activity and so on.
Outcomes are the intended (and
often unintended) results that are
linked to programme objectives.
They answer the question: “What
happened as a result of the
programme?” These can take the
form of changes in a participant’s
behaviour, knowledge, skills and
status. Typically, outcomes tend to
be categorised into short-, medium-,
and longer-term programme results.
Short-term outcomes range from
one to two years, whereas medium-term
outcomes typically cover three
to seven years. The logic progression
to long-term outcomes should
be reflected in the impact of the
programme.
Outputs and outcomes are often confused.
Although they both indicate specific changes
associated with activities, outputs are defined
as the direct results of those activities, while
outcomes refer to desired or wider intended
(or unintended) results. Outcomes are one
step ahead in the logic model chain. Outcomes
are generally the consequence of a group of
outputs that have been previously produced.
The problem is that outcomes, which reflect
programme success or failure, are often longer
term in nature. It is best to identify the short-and
medium-term outcomes first, before
going on to identify and assess the long-term
outcomes in order to understand the overall
progress on the project or programme.
Impacts are the fundamental direct and
indirect effects of programme activities
over a long-term period (7–10 years)
on the wider community/environment.
These include changes in economic/
financial conditions, in social conditions
(eg reduced violence or increased
cooperation), or in environmental and
political conditions (e. participation and
equal opportunities).
Thinking ahead about the external factors that
might influence the impact of a programme is
useful because it helps us to identify realistic
and accurate evaluation measures. The intended
results of a programme are influenced by the
programme environment. As programmes
operate in open systems, environmental factors
147.
RAND Europe 13:Logic models
can both augment the likelihood that the
programme will succeed and at the same time
impede the success of that same programme.
Thus, specifying and thinking ahead about
these influencing factors is a step forward in
developing a logic model.
108
Figure 13.11 shows a basic logic model.
Although the logic model itself reads from left
to right, developing it should follow a retro-spective
approach. In other words, the evalu-ator
should first start by specifying what will
happen (the outcome/ impact), and then work
backwards to identify the various elements of
the logic model. Once the initial logic model
has been developed, the evaluator might want
to validate and identify potential gaps or weak-nesses
by following the chain from left to right
and testing it step by step.
As well as providing a graphical represen-tation
of inputs, processes and outcomes, logic
models allow auditors to connect the elements
of the programme sequentially and establish
causality between the parts. For instance,
reading Figure 13.1 from left to right, we
can observe that activities can only be imple-mented
if there are enough resources. If activi-ties
are completed, the intended output should
be the result. Hence, logic models make it
conceptually easier to understand the causal
connections. However, the causal links are
not always obvious. Consequently, additional
thinking might be needed to create “link-ing
constructs” (McDavid and Hawthorn,
2006). Linking constructs can be conceptually
thought of as transitions from the work done
by the programme to the intended outcomes,
or as processes that convert planned work into
intended results.
Basic models rely heavily on linear causal
links. Nevertheless, linking constructs can
1 Adapted from the Kellogg Logic Model Development
Guide (W.K . Kellogg Foundation, 2001).
be non-linear, multi-dimensional and have
significant feedback loops. Hence, it is impor-tant
to recognise that no one-size-fits-all logic
model exists. In fact, there are alternative ways
of graphically representing the structure of a
programme, the activities of a programme,
how these in turn produce results, and how the
different elements of a programme are linked
together. It is up to the evaluator to craft a
logic model that fits the particular features of a
programme. Furthermore, in some situations,
it may be unclear whether a given part of a
programme fits into a particular category of
the logic model, or just what the cause and
effect linkages are. Developing a logic model
is not a one-off process, but rather an iterative
process between the evaluator’s professional
judgement and stakeholder consultations,
aimed at eventually obtaining the best possible
representation of a programme.
13.3 Why use a logic model?
The purpose of a logic model is to provide a
roadmap illustrating a sequence of related
events connecting the need for a planned pro-gramme
with the programme’s desired results.
The graphical nature of logic models
has multiple benefits. First, in a broad sense,
logic models allow evaluators to think more
systematically about the different programme
elements and how these link together. Con-sequently,
strengths and weaknesses as well
as gaps in the programme can be detected
at the outset, hence contributing to better
programme design and results. Second, by
providing a succinct visual image of how a
programme is expected to achieve its intended
outcomes, evaluators can provide a more
functional and practical way of categorising
and describing programme processes and out-puts.
Visual models replace a thousand words,
and describe in universal terms the purpose,
components and sequence of activities and
148.
PERFORMANCE AUDIT HANDBOOK
109
accomplishments of a programme, making
communication and understanding easier
(W.K . Kellogg Foundation, 2001).
The flexibility and openness that logic
models offer also means that stakeholders
can at least have some influence over how
their work is described. Engaging stakehold-ers
actively in logic model development can
improve the precision and objectivity of logic
models.
In addition to the benefits outlined above,
the Kellogg Development guide expands
further on the benefits of using logic models
(W.K. Kellogg Foundation, 2001):
Logic models better position programmes
for success.
By helping to organise and systematise
programme planning, management and
evaluation functions, logic models can
contribute to a programme’s success.
Logic models strengthen the case for
programme investment.
The structure and visual nature of logic
models, together with the organised
approach to collecting and collating
information, generally provide a clear
picture of what you planned to do
and why. This feature of logic models
enhances the case for investment in a
particular programme.
Logic models reflect group process and
shared understanding.
Ideally, logic models should be
developed in conjunction with the
various stakeholders of the programme.
The involvement of stakeholders is not
only key to reviewing and refining the
programme concepts and plans, but
also contributes to getting everybody’s
involvement and buy-in.
There are also potential limitations with using
logic models:
Logic models cannot always be applied to
programmes (McDavid et al., 2006).
For example, this could be the case with
particularly turbulent programmes.
Under such circumstances, developing
logic models might not be a useful
and effective way of understanding
the dynamics of a programme, nor of
how planned work relates to intended
outcomes.
Logic models cannot capture the
counterfactual.
Another limitation of logic models is
their inability (on their own) to capture
the counterfactual. Logic models do not
show what would have happened without
the intervention in place, or if another
intervention had been implemented.
Like programmes, logic models are
dynamic and time-limited.
It should not be forgotten that logic
models are only an instant picture of
a programme at a specific moment in
time. In other words, as the programme
develops and changes, so too will the
logic model. A logic model is a work
in progress, a working draft that can
be refined as the programme unfolds.
If a logic model is not updated, it
may become obsolete and, potentially,
misleading.
Logic models may miss feedback loops.
Logic models are linear and might
therefore miss feedback loops and fail
to reflect learning across initiatives. To
communicate these feedback loops,
evaluators may highlight them during
interviews or workshops. However,
occasionally, it might not be possible to
capture or understand feedback loops
directly through logic models, since logic
149.
110
RAND Europe13: Logic models
Figure 13.1: The basic logic model
Certain resources
are needed to
operate your
programme
If you have access to
them, you can use
them to accomplish
your planned
activities
If you accomplish
your planned
activities, then you
will hopefully deliver
the amount of
product and/or
service that you
intend
If you accomplish
your planned
activities to the
extent you intended,
then your
participants will
benefit in certain
ways
If these benefits to
participants are
achieved, then
certain changes in
organisations,
communities or
systems will be
expected.
Resources/ inputs Activities Outputs Outcomes Impact
What is invested? What is done? What is produced?
What are the short-and
medium-term
results?
What is the ultimate
impact?
Your planned work Your intended results
Situation
150.
PERFORMANCE AUDIT HANDBOOK
111
models combine goal hierarchy and time
sequence.
Logic models sometimes identify
programme “reach” poorly. In fact, logic
models treat the “who” and the “where”
on a rather secondary level, focusing more
on the causal chain between the different
elements of the logic model than on
reach. Montague (1998) identifies some
problems when models focus poorly on
reach:
By not paying enough attention to
reach (stakeholders), impacts tend to
be more narrowly defined.
By not addressing reach in logic
models, people will confuse outputs
and outcomes. For example,
Montague mentions that “improved
access” is confusing: does it mean
available access or usage by the
target group? “Service quality” is
also ambiguous: does it relate to
conformity to a standard set or
does it mean satisfaction of user
needs? Including reach as part of the
thinking process in a logic model
helps to distinguish outputs from
outcomes.
13.4 When to use logic models
Conceptually, logic models are helpful tools
for framing evaluation questions, programme
planning and implementation, and pro-gramme
evaluation.
13.4.1 Framing evaluation questions
A logic model is a simple, but representative
tool for understanding the context in which
a programme works. By addressing questions
that explore issues of programme relation-ships
and capacity, evaluators will be able to
better understand how the programme relates
to the wider economic, social and political
environment of its community. Furthermore,
logic models are a helpful tool for identifying
potential gaps or issues during implementa-tion
that need to be addressed to deliver the
programme as planned (Programme Planning
and Implementation), and determine the pro-gramme’s
progress towards desired changes in
individuals, organisations, systems and com-munities
(Performance Evaluation).
13.4.2 Programme planning and
implementation
One of the most important uses of the logic
model is in programme planning and imple-mentation.
A logic model illustrates how a
programme will work, identifies the factors
that potentially will affect the programme,
and enables the planner to anticipate the data
and resources (inputs and activities) needed to
achieve success. It forces the evaluator to clar-ify
its theory of action. At the same time, by
providing a good conceptual ‘snapshot’ of the
programme, the logic model serves as a useful
planning tool for developing an adequate pro-gramme
strategy. This will include the identi-fication
and collection of data for programme
monitoring.
13.4.3 Performance evaluation
Performance in the private sector is often
measured in terms of financial benefit or
increased sales. Traditionally, governments also
used to describe programmes in terms of their
budgets. However, financial resources spent
on a project do not necessarily reflect on the
programme’s success or failure. Consequently,
governments and NGOs have adopted new
ways of assessing performance and understand-ing
what progress has been made towards the
intended outcomes. A programme logic model
can provide relevant indicators, in terms of
output and outcome measures of performance.
151.
RAND Europe 13:Logic models
It is a useful tool for presenting information
and progress towards goals previously set.
13.5 How to develop a logic model
13.5.1 Factors to be taken into account
112
before developing a logic model
Before starting to develop a logic model,
some important factors need to be taken into
consideration:
Logic models are best used to depict
major, recurring items within a
programme, rather than individual items.
The logic model should provide a macro
perspective as well as an overview of
the interactions between the different
programme elements. As a result,
focusing too much attention on the
small details of the programme might be
distracting and ineffective.
The size and the level of detail of a logic
model can vary, but overall it should be
such that readers can easily study the
model without extensive reference. One
author suggests a logic model should
be one or two pages long (McNamara,
n.d.). Detail should only go so far as to
communicate the major items of the
programme to the reader.
13.5.2 Specific steps in logic modelling
To create a logic model, the first step is to
reflect on the situation of the programme. As
explained earlier, an outline of the situation
should provide a good overview of the rel-evance
of the project, that is, a statement of the
problem, a description of who is affected and
which other stakeholders might be interested
in the programme.
Once the elements of the programme
situation have been identified, it is important
to reflect on what is ultimately intended by
the programme, in other words, the intended
outcomes and impacts. Then there is a back-ward
process linking the various elements of
the logic model.
To populate the logic model, data need to
be collected in advance. To collect such data,
the following steps should be considered:
Review any documents that describe
the programme and its objectives. These
can include policy documents, working
papers, memoranda, etc.
Meet and interview programme managers
and programme stakeholders to learn
more about the purposes and activities of
the programme, as well as to get further
information about how the programme
will meet the intended outcomes.
Construct a draft logic model based on
the information collected during the first
two steps, (eg following the structure of
Figure 13.1).
Present the draft logic model to
programme managers and stakeholders
(ideally the same people interviewed)
as part of an iterative process. It may be
necessary for the evaluator to explain
what a logic model is and how it clarifies
the structure of the programme and its
objectives. Once the model has been
presented, discussion with programme
managers and stakeholders should help to
fill any information gaps and, if necessary,
to fine-tune the model.
Finally, after completing and reviewing the
draft logic model with the stakeholders, it
should be revised and validated as a workable
model of the intended processes and outcomes
of the programme. This would be the final
logic model. The evaluator must remember
that a logic model can be represented in multi-ple
ways (eg different levels of detail), so there
may not always be a common understanding
of how the model should look.
152.
PERFORMANCE AUDIT HANDBOOK
113
Document reviews, interviews and focus
groups are most commonly used to populate
a logic model. However, there are obviously
other methods that could also be employed.
Regardless of the method selected, the devel-opment
of a logic model always involves a
significant amount of professional judgement.
13.6 A logic model in action:
combating benefit fraud
In collaboration with the National Audit
Office (NAO), RAND Europe examined six
initiatives to combat fraud in the Department
for Work and Pensions (DWP) in 2007.
The initiatives represented different aspects
(prevention, detection and deterrence) of an
integrated strategy to tackle fraud, operated by
different parts of DWP. The initiatives selected
for the analysis are represented in Table 13.1.
Table 13.1: DWP initiatives selected for
analysis
Initiative Area Responsible
within DWP
“Targeting
Fraud”
advertising
campaign
Deterr-ence/
Prevention
Communi-cations
Directorate
National
Benefit Fraud
Hotline
Detection
Contact
Centre
Directorate
Data Matching
Service Detection Information
Directorate
Fraud
Investigation
Investig-ation
Benefits
Service
Directorate
Customer
Compliance Prevention
Customer
Services
Directorate
Administrative
Penalties
and Criminal
Prosecutions
Correction Solicitors’
Branch
Each of the above initiatives was investigated
in detail following the same method. For each
of the initiatives, a logic model of relevant
inputs, activities, outputs and outcomes was
constructed, with the aim of relating the
resources invested to actual outcomes. Logic
models were used to provide a structure for
these.
Below, we describe the use of logic
models for the “Targeting fraud” advertising
campaign.
Background: A description of
the initiative “Targeting Fraud”
advertising campaign (the intervention
studies)
In a bid to discourage active benefit fraud and
make fraud socially unacceptable, DWP sought
153.
RAND Europe 13:Logic models
to increase the general public’s awareness of
the negative implications of fraud through two
advertising campaigns via the national press,
television and radio, and other media.
114
The first of these campaigns centred on
the phrase “Targeting Benefit Fraud”. It ran
from March 2001 to March 2006. The second
campaign focused on the message “No ifs,
no buts”, and launched in October 2006.
This campaign was designed to appeal to the
individual’s sense of responsibility, differing
from the earlier “Big Brother” approach. In
addition, it aimed to raise awareness to reduce
customer error as well as fraud. To understand
what was invested, what was done and what
the outcomes of the initiative on the advertis-ing
fraud campaign were, a logic model was
developed.
Developing the logic model for the
initiative
In a first phase, preliminary models were con-structed
on the basis of desk research using
published literature and internal documents
provided by the DWP. In a later stage, logic
models were completed and validated in a
series of workshops run jointly by RAND
Europe and the NAO with selected DWP staff.
These workshops included interviews and a
group workshop. Both the interviews and the
workshops were structured around the four
principal areas of logic modelling: Resources/
Inputs, Activities/Processes, Outputs, and
Outcomes. The resulting practitioners’ input
informed the more detailed construction of
the logic model set out below (Stolk et al.,
2007) (Figure 13.2).
Developing logic models with staff respon-sible
for delivering the initiatives allowed a
“thick narrative” to be developed and agreed,
highlighting complexities and challenges as
well as revealing both formal and informal ways
in which these were overcome. As pointed out
by Stolk et al. (2007), the visual representation
of the “theory of action” makes understanding
between participants easier.
13.7 Summary
Logic models are graphical representations
of the inputs, activities, outputs, outcomes
and impacts of programmes or projects.
Logic models allow users to think systemati-cally
about a programme’s elements and how
they link together, identifying potential gaps,
developing a common understanding of the
programme among stakeholders and organis-ing
information in a practical and structured
way. Therefore, logic models are appropriate
for framing evaluation questions, programme
planning and implementation as well as per-formance
evaluation. Yet logic models are con-text
specific. If programmes are particularly
complex, with significant feedback loops and
highly changing dynamics, the evaluator might
want to consider using a different approach.
13.8 Further reading
Devine, P., Using Logic Models in Substance
Abuse Treatment Evaluations, Fairfax, VA:
National Evaluation Data and Techni-cal
Assistance Center, Caliber Associates,
1999.
Hernandez, M. S. Hodges, Crafting Logic
Models for Systems of Care: Ideas into
Action, Tampa, FL: University of South
Florida, The Louis de la Parte Florida
Mental Health Institute, Department of
Child Family Studies, 2003.
W.K. Kellogg Foundation, W.K. Kel-logg
Foundation Evaluation Hand-book,
1998. As at 6 October 2009:
http://www.wkkf.org/Pubs/Tools/Evalua
tion/Pub770.pdf
154.
PERFORMANCE AUDIT HANDBOOK
115
Figure 13.2: Logic model “Targeting Fraud” advertising campaign
Activities/Processes
a) Creative development
b) Comments on creations
c) Data used for end result
d) ‘Hands on’ production
e) Campaign strategy
f) Meetings: physical / virtual
g) Stakeholder relationship
h) Contacting suppliers
i) Brief for agency pitch
j) Project planning
k) Delivery plan
l) QA Analysis
m) Joining up links / other
countries
n) Selection of media
o) Evaluation / re-evaluation
feedback to kk )
p) Fraud Campaign 2006:
‘NO IFS NO BUTS’
Outputs
a) Advertising Campaign
Out of home poster
advertising
Local press adverts
Washroom posters
Bus interiors
Door drops
Other ambient
advertising
Local authority poster
TV advertising
b) TV programme themes
(‘Soap Operas’ ); influence
BBC programme
c) Website
d) Specific PR activity:
Cheat Sheets,
Pack of Lies,
Love Cheat,
Horror-scopes
e) Campaign launch/Delivery
f) Campaign which delivers
object
g) Research showing
effectiveness (feedback to
kk)
Short-term outcomes
a) Expenditure targets met
b) Heighten public profile of
fraud
c) Evaluate against original
objectives and learn
lessons for future
campaigns
Medium-term
outcomes
a) High public agreement that
fraud is wrong (feedback
to dd)
b) Change in attitudes to
benefit fraud amongst
DWP customers
c) Increased reporting of
benefit fraud
d) Support delivery of PSA
target to reduce fraud
(feedback to ee)
Long-term Outcomes
a) Less money lost , more
accurate claims , fraud
deterred
b) Legitimacy and trust
shown to benefits
Advertising
Resources/Inputs
a) DWP Communications
Directorate
b) 7.5 Million pounds funding
Campaign 2005-6
c) 7.3 Million pounds
projected spend for
2006-7
dd) Grabiner Report impact :
attitudes to fraud
ee) PSA targets/goals
f) Ministerial , departmental
policy directives
g) Knowledge/Skills
h) Statistical Data
i) Staff/ experience
j) Customer research
kk) Prior campaign evaluation
l) Communication skills
155.
RAND Europe 14:Network analysis
CHAPTER 14
116
Network analysis Priscillia Hunt
14.1 Key points
Network analysis explores the
relationships between individuals or other
actors, and the information flows between
them, numerically and graphically.
Network analysis describes networks
systematically and compactly.
Network analysis can identify key
influencers.
14.2 Defining network analysis
Network analysis is the “mapping and measur-ing
of relationships and flows between people,
groups, organizations, computers, web sites,
and other information/knowledge processing
entities” (Krebs, 2004). The patterns of con-nections
between individuals and groups form
a network and the structure of such networks
influences social and economic trends and
outcomes.
The aim of network analysis is to describe
networks systematically and compactly. The
amount of information in network analysis
needed to describe patterns, even in small
networks, is vast. By formally representing all
the necessary information through the rules of
network analysis, a researcher can synthesise
connections in an efficient and systematic way.
It is a method to gauge visually interactions
and to assess the power of relationships.
Network analysis has been used in many
applications, such as disease transmission,
terrorist networks, innovation diffusion, tacit
knowledge in organisations, the world wide
web, and international trade. Network analy-sis
provides answers the following types of
questions:
Who are the central members of a
network?
Who are the peripheral members of a
network?
Which people have the most influence
over others?
Does the community break down into
smaller groups and, if so, what are they?
Which connections are most crucial to
the functioning of a group?
14.3 When to use network analysis
Researchers conduct extensive investigations
of networks in economics, mathematics, soci-ology
and a number of other fields, in an effort
to understand and explain network effects.
The technique allows for predictions about the
behaviour of a community, as a function of the
parameters affecting the system.
The main aims of network analysis are to:
illustrate a complex system
create understanding of relationships
identify problems with the flow or
existence of a network.
Illustrate a complex system
Social network analysis allows us to identify
how to best use knowledge and promote the
flow of knowledge or commodities. When a
public or private organisation seeks to provide
a visual illustration of how ideas are shared or a
commodity flows from one person to another,
it is helpful to use network analysis.
Understand relationships
As access to information and the maintenance
of relationships becomes more sophisticated,
network analysis provides an empirical
156.
PERFORMANCE AUDIT HANDBOOK
117
framework to evidence social and economic
interactions.
Identify problems
In order to sustain a successful start-up com-pany
or provide effective public services, prob-lems
must be identified to assess and improve
transmission of knowledge.
14.4 When not to use it
Network analysis is not an instrument for
normative assessments. That is, it is not used
to describe the way something ought to be
done. There are two specific reasons for this
– network analysis does not illustrate why rela-tionships
exist nor how the interactions take
place.
Social network analysis does not provide
details about why actors perform tasks in a
particular manner or why they feel connec-tions
or do not. The underlying reason for
the relationship is not illustrated in a network
graph or matrix. Therefore, it is inappropriate
to use network analysis to suggest how things
ought to work in a network – even if it appears
that the entire network will be more efficient if
two people without an established relationship
develop one, it does not necessarily mean such
a relationship can be built. There may be an
underlying reason why one does not already
exist. Further to this point, it is possible that
the development of other relationships results
from a lack of relationships elsewhere in the
system.
In addition, network analysis does not
capture how relationships function on a daily
basis. Although the suggestion that certain
relationships within a network ought to have
links elsewhere may in itself be true from an
efficiency and effectiveness point of view, the
practical implications of adjusting or adding
relationships may not be feasible because net-work
analysis does not take into account how
the link operates. For example, it does not
identify that two people use email frequently
whereas two others are more likely to speak on
the telephone.
14.5 How to conduct network
analysis
The four key steps to network analysis are:
1. define the boundaries
2. collect the data
3. design the network
4. analyse the network.
Step 1: Define the boundaries
The initial step in social network analysis is to
determine the population under investigation.
This seems relatively straightforward; however,
in many instances, it is difficult to separate the
relevant from irrelevant actors.
There are two approaches to defining the
boundaries of the actor set: realist and nomi-nalist
(Laumann et al., 1989).
The realist approach focuses on actor-set
boundaries and membership as perceived by
the actors themselves. For example, an artist
club can be a social entity because individuals
involved acknowledge themselves as members
of the club.
The nominalist framework is defined by
the researcher for the needs of the research, so
the list of relevant actors is a construct of the
researcher. In the example of an artist club, the
researcher may be interested in the impact of
new arrivals on the club, and so confine the
boundaries to new members.
157.
RAND Europe 14:Network analysis
Step 2: Collect the data
The collection of data entails gathering infor-mation
118
from a variety of sources and managing
all the information in an efficient and effective
way.
Gathering
The first stage of data collection involves
developing a complete picture of the connec-tions
between people. This is achieved through
discussions with those involved and reviews of
relevant reports. Empirical evidence is acquired
using various methods, including:
interviews
questionnaires
observations
archival records
snowball sampling
ego-centred studies
experiments.
The type of data to collect depends on the
nature of the study and the boundaries set.
There are two types of data: structural and
composition variables. Structural variables
measure the relationships between pairs of
actors. Composition variables measure actors’
attributes and are defined at the individual
level. Examples of composition variables
include gender, race, age, ethnicity and geo-graphic
location.
Managing
Once the evidence has been gathered, it is
likely to be in various forms and relatively dis-organised.
The data needs to be gathered into
a spreadsheet to identify gaps and organise
what is probably a large quantity of informa-tion
into a documented format. Generally, all
attributes (quantitative and qualitative) are
arranged for each individual or group under
investigation. Table 14.1 is an example of
information gathered on four individuals and
the number of relationships they report with
other individuals in the sample.
Table 14.1: Summary of data
Name
Sex
Age
Relationships
Person A Male 30 2
Person B Female 28 1
Person C Female 51 3
Person D Male 45 1
Source: Author
Step 3: Design the network
There are two approaches for developing
and analysing networks: matrix and graph
theories.
Matrix formation allows a researcher to
compare subjects’ attributes for similarities
and dissimilarities. There are two basic matrix
formulations, rectangular data array and
square array, which depend on the number
of rows and columns. The matrix comprises
rows and columns that are cases, or subjects.
The relationship between a particular row and
column is represented as an element in a cell
(quantitative or qualitative). Relationships are
expressed as a score in the cells of a matrix.
This type of matrix is most commonly illus-trated
as a table.
Social network analysis also makes use
of concepts from graph theory. A graph, also
known as a sociogram, is composed of points,
called nodes or vertices, and lines connecting
them, called edges. A node is an actor and an
edge is the relationship. A line joining two
nodes represents a relationship between those
two nodes. A graph may represent a single type
158.
PERFORMANCE AUDIT HANDBOOK
119
of relationship among the nodes (simplex),
Examples of a multiplex can be friendship and
business partnership.
Matrix
Matrices are used to keep information in a
compact form. The matrix used in network
analysis is termed an adjacency matrix, often
denoted as the matrix A. For example, Table
14.2 illustrates a four-by-four adjacency matrix
(four rows, four columns) with elements indi-cating
whether or not there is a relationship
between two actors, as chosen by the row actor
(“Chooser”). These elements are binary (0
= no relationship, 1 = otherwise). Note that
the standard convention is to label actors by
capital, bold-type letters.
Table 14.2: Reported working
relationships
Choice:
Chooser:
Person A
Person B
Person C
Person D
Person A --- 0 1 1
Person B 1 --- 1 0
Person C 1 1 --- 1
Person D 0 0 1 ---
Source: Author
The adjacency matrix can either be symmet-ric
or asymmetric, which is intuitive because
two people do not necessarily feel the same
way about each other. Person A may feel close
to Person B, yet Person B does not feel close
to Person A. As seen in Table 14.2, Person B
reported no link to Person A and Person A
reported a link to Person B. This is an asym-metric
adjacency matrix; formally, where i and
j are nodes of the row and column, asymmetry
is Aij ≠Aji.
Other than binary measures (0,1), the
level of measurement can be signed or valued.
Signed distinguishes how a relationship is
valued. A subject can like (+), dislike (-), or
not care (0) about another subject. A valued
measure is a rank ordering of responses.
Graphing
The first step is to plot the nodes in a sample
space, as seen in Figure 14.1. The nodes can be
different colours, shapes or sizes to represent
particular attributes. In this example, white
circles are female, black circles are male.
Figure 14.1: Simple graph nodes
Person A
Person B
Person C Person D
Source: Author
The next step is to introduce lines to express
ties and arrows to express the direction of
those ties. A line segment indicates a “bond”
in which the two nodes have indicated close-ness.
This requires more descriptive informa-tion,
such as signed or valued. Arrows express
information about a tie and require binary
information. A double-headed arrow indicates
a reciprocated tie. In Figure 14.2, we illustrate
the direction of ties (based on information
provided in Table 14.1).
159.
RAND Europe 14:Network analysis
Figure 14.2: Multiplex relations
120
Person A
Person B
Person C Person D
Source: Author
Figure 14.3 shows how peripheral relationships
exist that can initiate a network. This is often
found for suppliers to an industry, or external
regulators, for example.
Figure 14.3: Social network – a “Kite
Network”
Person A Person B
Person C Person D
Person E
Person F
Source: Author
The most widely used software for social net-work
analysis is UCINET. There are many
other software packages available; network
analysis websites will provide the most up-to-date
reviews.
Step 4: Analyse the network
Analysing a network provides insights into
the most influential actors. Influence can be
thought of in a number of contexts – having
the greatest number of relationships, having
the highest number of close relationships, or
being the go-between or connector for many
relationships.
These concepts all come under the head-ing
of “Centrality”. Centrality measures are
the most fundamental and frequently used
measures in network analysis. The four most
notable centrality measures are:
degree centrality – number of
relationships
betweenness centrality – level of control
in relationships
closeness centrality – familiarity within
relationships
eigenvector centrality –strength of
relationships.
Who are the central members of a network?
Degree centrality (also known simply as
“degree”) measures the number of relation-ships.
Generally speaking, a node with many
edges is an influential actor because more
choices increase the number of opportuni-ties.
In most social and economic settings, the
individuals with the most connections have
the most power and influence. Therefore, the
degree of a node in a network is the number of
edges (or lines) attached, which is calculated as
the sum of edges from vertex i to j:
Σ=
k =
A
i ij n
j
1
where A is the adjacency matrix of size n × n,
n is the number of nodes in the network, and
160.
PERFORMANCE AUDIT HANDBOOK
121
k is the total number of relationships. This is
a relatively straightforward equation and yet
quite powerful as an effective measure of the
influence of a node.
The next two concepts, “betweenness”
and “closeness”, are both concepts of network
paths. A path in a network is a sequence of
nodes traversed by following edges from one
to another across the network. These paths
are “geodesic” – a geodesic path is the short-est
path, in terms of number edges traversed,
between a specified pair of nodes. There is no
reason why there cannot be two paths that are
both the shortest.
Which connections are most crucial to the
functioning of a group? Betweenness measures
the fraction of information (or any other com-modity)
that flows through a node on its way
to its destination. Suppose the flow between
nodes in a network takes the shortest route,
a node with substantial influence will have a
high level of betweenness, either by being in
the middle of the network or by being between
other nodes on the way to the destination
node.
Which people have most influence over
others? Closeness centrality is lower for verti-ces
that are more central, because they have a
shorter network distance on average to other
vertices. Closeness is generally defined as the
average geodesic distance to all reachable verti-ces,
excluding those to which no path exists.
Lastly, the relatively more complex ver-sion
of analysis is eigenvector centrality, which
is another measure for finding which people
have the most influence over others. Eigenvec-tor
centrality incorporates the idea that not all
relationships are the same. That is, some rela-tionships
are stronger than others, in which
case the edges are weighted and represented
through thicker or thinner lines. The persons
having more influence than others, in this
context, are the persons with contact who also
have influence. To allow for this effect, the
equation to solve is:
Σ=
x =
A x
i ij j n
j
1
1
m
where μ is a constant. Therefore, x is propor-tional
to the average of the centralities of i’s
network neighbours.
14.6 Summary
Network analysis is a quantitative way of
exploring the relationships in a network. The
mathematical and graphic tools used illustrate
how quantitative analysis can help us to under-stand
complex patterns of interaction. Social
network analysis can then be used to develop
perspectives, models and paradigms for rela-tionships
where the links between people in a
network are the focus, rather than the charac-teristics
of the people involved.
14.7 Further reading
Hanneman, R. and M. Riddle, Introduction
to Social Network Methods. Riverside, CA:
University of California, Riverside, 2005.
Hawe, P. and L. Ghali, “Use of Social Network
Analysis to Map the Social Relationships
of Staff and Teachers at School”, Health
Education Research, Vol. 23, No. 1, 2007,
pp. 62-69.
Scott, J., Social Network Analysis: A Handbook,
Thousand Oaks, CA: Sage, 2000.
Wasserman, S. and K. Faust, Social Network
Analysis: Methods and Applications. Cam-bridge:
Cambridge University Press,
1994.
161.
RAND Europe 15:Online tools for gathering evidence
CHAPTER 15
122
Online tools for gathering evidence
Neil Robinson
15.1 Key points
Online surveys are widely used in both
the public and private sectors.
Online surveys can be used to target
specific stakeholder groups.
Online surveys need to be carefully
designed through a partnership
between the researchers and web-survey
implementers.
15.2 Defining online surveys
Online tools have become an extremely cost-effective
method of conducting fieldwork for
scientific, social, business and policy research,
and include web-surveys, opinion surveys,
stated preference, online Delphi exercises and
more open-ended forms of e-consultations
(see Shonlau et al., 2002, Chapter 3 for a
good overview). In the consumer area, these
tools are frequently used by market research
companies to study likely markets for certain
products and services through opinion surveys
or general omnibus studies.
This chapter discusses the use of online
tools in a specific policy research context.
This context is not the same as fieldwork for
policy research among a sample of a general
population of citizens or consumers (or those
that are not familiar with the technicalities
and principles of policymaking processes) but
rather as a tool for evidence gathering from
stakeholders who have more direct interaction
with policymaking.
Although it is difficult to characterise
from a theoretical point of view, various types
of stakeholder may be considered as relevant
targets for this form of evidence gathering. For
example:
civil servants and members of
administrative departments, agencies
and public bodies – so-called policy
practitioners, they will have knowledge
of the policy domain that such tools are
being used to investigate and will be
familiar with the terminology
private sector representatives
experts
academics
civil society stakeholders.
Surveys can be conducted in a panel format,
with a known sample that is carefully scoped
to be representative of a greater population,
or using an unknown sample size, where the
survey is conducted purely on a best effort basis
with no guarantees as to the relationship of the
respondents to the total population size.
15.3 When to use online surveys
In the policy context, online survey tools are
especially useful for gathering honest views
of practitioners, as the respondent feels that
they are talking to a computer rather than a
person.
The successful use of online data gather-ing
techniques is, like many methodologies,
a compromise among a number of factors.
The main consideration will be that of under-standing
the implications of more complex
instruments given the specificities of using
more traditional forms of data collection.
162.
PERFORMANCE AUDIT HANDBOOK
123
Online surveys are particularly suitable in the
following circumstances:
When the boundaries and
characteristics of a topic or subject
can be easily determined in advance.
In this instance, it should be easier for
those developing the survey instrument
to represent questions in an “important
/ not important” or “agree / disagree”
manner, thereby permitting extensive
question sets. This method is particularly
useful when trying to simplify questions
that could be answered qualitatively (eg
what do you think about…?) so that
they are presented quantitatively (please
indicate the extent to which you agree /
disagree with the following…).
When there is a large or unbounded
sample. Online survey tools may be
appropriate when considerations of
robustness of sample size to population
are of lesser importance.
When fast turnaround is necessary.
Surveys can be developed extremely
quickly, especially when an existing
survey platform is established.
Furthermore, some tools permit
automated data extraction.
When budget is limited. Online tools
may be a cost-effective alternative to more
expensive forms of data collection (eg via
telephone surveys), as they are relatively
cheap to implement.
When there are known characteristics
about respondents. Online tools
are likely to work best where the
characteristics of respondents are known
in advance. Examples include a known
sample size (eg number of civil servants
in a department) or use of a particular IT
set up. The latter, in particular, helps to
address technical bugs and inconsistencies
caused by myriad varieties of computing
platforms.
15.4 When not to use online surveys
Online policy research is generally not suit-able
in especially complex policy environ-ments,
where other written evidence must be
cross-referenced to understand the context of
responses.
Web surveys (one form of online research
method) are not well suited to gathering
responses where the boundaries and structure
of the domain are not known in advance. This
is because web surveys are generally at their
most effective when using closed questions,
which keep the respondents’ attention. Online
consultations or more open-ended techniques
(using email or forms delivered via email, for
example) are better suited to solving these
problems.
Challenges exist in regard to self-selection,
bias and where the relationship between the
sample size and total population size cannot
be robustly quantified or determined in
advance. These may not be as relevant where
the respondent is likely to be knowledgeable
about the topic or subject. Such challenges are
more common where surveys are, for exam-ple,
conducted on a sample of the national
population.
The most common problems with online
surveys, in order of importance, are:
When the survey instrument is
especially long or complex. This is
the most crucial factor. All too often,
questionnaires are developed by one
part of a study team and then handed to
a web-survey developer to implement.
Experience shows that the earlier those
responsible for translating a questionnaire
or instrument into an online format are
engaged with the project team actually
drafting the questionnaire, the better.
163.
RAND Europe 15:Online tools for gathering evidence
124
Generally, this will involve finding
a suitable compromise between the
survey designers and those charged with
implementing it online.
Where iteration is required (which has
a negative impact upon response rates).
Online tools are not generally particularly
effective at multi-stage Delphi-type
exercises, since the repeated interaction
and iteration, which can only be achieved
via the respondent revisiting a web page
or survey site, tends to negatively affect
response rates. The limited exception to
this is for a Delphi conducted via email,
due to its directness.
Where the evidence and the evidence
gathering process is closely integrated,
for example focus groups). Unless a
computer-aided technique is used (eg
an interviewer going through a survey
with a respondent via the telephone),
online tools are not suited to those
forms of evidence gathering that seek to
understand how consensus is formed in
a dynamic, real-time fashion, since it is
impossible to observe how the responses
are arrived at.
Where complex forms of interaction
(eg trying to identify a position on a
process timeline or map) are required.
This may be technically difficult to
implement, although new non-textual
forms of collecting data (eg via mouse
clicks) are starting to deal with such
challenges.
Where language and cultural issues
play a crucial role. The English language
is dominant on the web, particularly
in the implementation of Unicode
characters for many forms of online
communication. For those surveys where
there are unique character sets (eg Cyrillic
or pictogram based languages such as
Japanese and Mandarin), the complexity
involved in developing and testing
an instrument to be used in such an
environment may outweigh the benefits
afforded by this technique.
15.5 Conducting online surveys
There are a number of important contextual
factors to consider regarding the scope and
design of a data gathering instrument to be
used as the basis for online deployment.
The success of any online data collection
may be largely determined by the character-istics
of the underlying instrument or set of
questions – how complex the questions are
(eg questions that may have dependencies or
piping from one question to another), how
many questions there are, and the mode of
the questions (eg open-ended vs. Likert Scale).
Certain measures can mitigate these risks, for
instance following up survey invitees, care-fully
considering survey design with regard to
usability, and utilising previous experience in
conducting online fieldwork.
The various steps associated with imple-menting
online tools are described below.
164.
PERFORMANCE AUDIT HANDBOOK
125
Figure 15.1: General process of implementing online data collection tools
Source: RAND Europe
Optional
Technical knowledge
Domain knowledge
Stage 1
Review
survey
Stage 2a
Review
technical
applicability
Stage 2b
Review
phrasing
of questions
Stage 3
Implement
online tool
Stage 4
Test
internally
Stage 5
Deploy
Online tool
Stage 4a
Conduct
pilot
Stage 6
Follow up
respondents
Stage 7
Collate and
Hand-over
data
Stage 7a
Conduct
analysis
Continuous task: Regular liaison with client to keep informed of progress
165.
RAND Europe 15:Online tools for gathering evidence
Stage 1: Review survey
Initially, the data-gathering instrument is
reviewed to answer the following questions:
What is the structure of the online instrument
required? How many sections/questions does
it contain? How complex are the questions?
How many stakeholder groups are expected
to be addressed and are there different surveys
for each? The answers to these questions will
impact both on the details of implementation
and the expected response rate. In general,
as online data collection tools get longer and
more complex, the response rate drops. It is
good practice not to try to deploy something
that will take longer than a maximum of
15–20 minutes for a response, otherwise the
response rate declines considerably.
Stage 2a: Review technical applicability
The online instrument is reviewed and refined,
bearing in mind the technical advantages and
disadvantages of such tools. For example, web-based
126
surveys can be constructed with yes/no,
radio-button, drop-down list and open-text
questions, questions where user information
is “piped” from one question to the next and
“condition”-based questions that are only pre-sented
if certain preceding answers have been
given. Conditioned questions are of critical
importance, as they can be used to reduce the
effective length of a survey. A web interface also
limits the type of questions that can be used.
For example, complex, graphical questions
may need to be adjusted to allow for answers
to be supplied with a drop-down list.
Stage 2b: Review phrasing of questions
The phrasing of survey questions is of critical
importance, as misinterpretations and loss of
nuance can often lead to erroneous results.
This is a far greater challenge than the techni-cal
implementation of an online tool. The aim
in this phase is, where possible, to use domain
knowledge to adjust the language and question
phrasing and thereby reduce the possibility of
confusion, bias or misunderstanding in the
response. This stage is critical to ensuring that
the survey gets the results that the study team
require. The refinements of stages 2a and 2b
would ideally be discussed with the project
sponsors at an interim meeting, to agree the
form and function of the online instrument. At
this meeting some of the mechanics for imple-menting
the survey should also be discussed
and agreed. For example, requiring respond-ents
to log in, any introductory text outlining
the survey (an important part of maximising
responses), links to documents required or any
other material for the respondents to review,
numbers of different surveys targeted at spe-cific
groups and any other associated issues.
Stage 3: Implement online tool
Following agreement with the project team,
the survey is then implemented on the online
platform. While a full discussion of the various
survey tools is beyond the scope of this chapter,
various factors should be considered, includ-ing
the particular requirements of the project
(eg whether respondents will be expected to
complete the questionnaire in one sitting, how
invitations will be distributed), the complexity
of the instrument (eg multiple choice questions
or those requiring non-textual interaction),
robustness of the selected platform (eg number
of version), and experience of those required to
use and implement the instrument in the plat-form.
At a general level, the 80/20 rule holds
for the online part of the implementation; it
takes 20 percent of the effort to implement 80
percent of what functionality is required. Any
remaining problems usually require significant
effort to solve, negotiate or find a suitable way
to work around them.
166.
PERFORMANCE AUDIT HANDBOOK
127
Stage 4: Test internally
Once the survey is implemented, internal test-ing
is conducted. It is at this stage that email
invitations and embedded hyperlinks are
checked, the performance of the instrument
in various web-browsers (eg Opera, Internet
Explorer and Firefox) is checked, and data
collection verified (whether the instrument is
recording data in the appropriate way). These
checks will reduce the occurrence of problems
with the survey both at the pilot and deploy-ment
stages. When this stage is completed, a
link to the final survey instrument is sent to
the project team for a final opportunity to
review.
Stage 4a: Conduct pilot
Following internal testing, the online instru-ment
is then piloted with a small sample to test
understanding amongst likely respondents and
iron out any final technical issues. The objec-tive
here is to ensure, to the greatest degree
possible, that the respondents understand
the questions in the same way as the creators.
Details on the pilot group would be provided
by the Supreme Audit Institutions (SAI), and
would comprise a small, representative subset
of respondents. Piloting would involve deploy-ing
the survey to the pilot group, asking them
to complete the survey and then conducting a
cognitive telephone interview with respondents
to determine any complications. The piloting
is used to validate the internal testing, to check
phrasing of the questions and to address, where
possible, any technical interface issues. This
stage may be omitted or shortened depending
on the number of intended participants.
Stage 5: Deploy online tool
After successful piloting, the instrument is
deployed across the sample of stakeholders.
Names of participants can be provided either
by the SAI or determined independently;
however, enough resource must be dedicated
to this task. A particularly useful form of
deployment that has worked well in the past
is via intermediary organisations (eg member-ship
organisations which count stakeholders as
members), that can act as force multipliers for
the distribution of the instrument. It is always
good practice to establish a clear feedback
mechanism for technical support queries.
Stage 6: Follow up respondents
Once the survey has being deployed for a short
time period, non-respondents are followed
up. Depending on the number of responders
outstanding, this will be either via email or
telephone. This follow-up is intended to max-imise
response rates.
Stage 7: Collate and hand over data
Once the survey is completed, the data can
be collated and exported in a suitable format,
either electronic (eg .csv, .xml, SPSS, .xls, .rtf )
or paper-based.
Stage 7a: (optional) Conduct analysis
Using the data collated from the survey,
analysis is conducted to extract results and
conclusions. The numerical data can also be
presented in a graphical form, allowing for
easy understanding. It is useful to provide a
workbook of tabulated results, indicating the
questions, responses and analysis in a logical
manner.
15.6 Online surveys in action:
reviewing impact assessments
RAND Europe was asked by the European
Commission to review the process of impact
assessments (the EC formal ex-ante evalua-tion
process) across a number of Directorates
General. The study used an electronic survey,
implemented on RAND Europe’s online
platform, ClassApps SelectSurveyNet version
167.
RAND Europe 15:Online tools for gathering evidence
2.8.2 (ClassApps, n.d.). Initially, a number of
iterations were required between the project
team and lead technical architect responsi-ble
128
for implementing the instrument in the
platform, which illustrated the need for close
liaison between those developing the ques-tions
and those required to translate them into
something that would be usable in an online
environment and maximise response rates.
Another interesting characteristic of this
survey was in regard to the different types of
stakeholder. Respondents were grouped into
different classes of stakeholder and slightly dif-ferent
questions were asked of each grouping.
The use of an online electronic tool made this
easier, since a base instrument was created and
then copied and adjusted to reflect the slightly
differing questions.
Following internal agreement on the
survey instrument and testing, the link was
sent to the European Commission for verifi-cation.
Minor changes were requested, which
were implemented directly on the online
instrument. Due to limited resources, a full
pilot was not conducted (the testing with the
client being considered as a pilot). The link was
then distributed to relevant groups within each
Directorate General for completion. As this
was an unbounded sample (ie it was done on a
best-effort basis) no statistical quantification of
the relationship between respondents, sample
size and population size was conducted.
Respondents were given two weeks to
complete the survey and follow-up was via
email (but telephone might have increased
the response rate). Drop off or completion
rate (the difference between the numbers that
clicked the survey, answered the first question
and answered all of the questions) was in line
with expectations at around 40 percent.
Data was extracted directly into Excel and
analysed, following which a report was pro-vided
to the client.
15.7 Summary
Online surveys can provide an efficient way of
collecting information from different stake-holder
groups, anonymously if necessary. Best
results are achieved if the auditors and those
implementing the online survey collaborate in
developing the survey from an early stage.
168.
PERFORMANCE AUDIT HANDBOOK
129
CHAPTER 16
Payback framework Sonja Marjanovic
16.1 Key points
The Payback framework is used to assess
the impacts of research.
The Payback framework categorises and
determines indicators for research benefits
and uses a logic model to assess those
benefits.
16.2 Why do we need to evaluate
research?
Evaluation can be defined as “a systematic and
objective process designed to assess the rel-evance,
efficiency and effectiveness of policies,
programmes and projects” (Fahrenkrog et al.,
2002, p. 15). There are a number of reasons
for evaluating research (cf Brutscher et al.,
2008)1:
To ensure that researchers, policymakers
and funding bodies are transparent and
accountable for the way research funds
are spent.
To evaluate whether milestones have
been reached and help steer the research
process towards desired outcomes by
facilitating timely remedial actions.
To provide a means for advocacy, for
example by using the results of an
evaluation to signal the ability to conduct
research, or the credibility to fund it.
To provide an input into the research
management process via learning from
the past experience of research projects.
Over time, a number of research evaluation
frameworks have been developed. They all
1 For an alternative (more narrow) list see: Georghiou,
et al. (2005).
attempt to provide a template and guide for
conducting evaluations, while also facilitating
the use of multiple sources of evidence and
analysis methods, and increasing the validity
and reliability of conclusions from an evalu-ation
(Buxton and Hanney, 1996, Wooding,
Anton et al., 2004, Brutscher et al., 2008).
16.3 Defining the Payback
framework
The Payback research evaluation framework
was developed by the Health Economics
Research Group at Brunel University (Buxton
and Hanney, 1996), and subsequently refined
in collaboration with RAND Europe (eg
Wooding et al., 2004, Hanney, Grant et al.,
2004).
The framework consists of (1) a multi-dimensional
categorisation of benefits from
research and (2) a logic model of how to assess
them. It is a tool for evaluating a comprehen-sive
range of potential outputs from research,
and (unlike most other research evaluation
frameworks) also provides a way of conceptu-alising
the process by which outputs are created
(ie the logic model).
169.
RAND Europe 16:Payback framework
Box 16.1: Categories of benefits from research in the Payback framework
A. Knowledge production
Advancements in knowledge on a topic, produced through the research
B. Benefits to future research and research use
Better targeting of future research (knowledge produced by prior research can indicate
130
and sometimes dictate new research agendas)
Human resource capacity building: staff recruitment, training and professional
development benefits
Physical infrastructure capacity building: lab and office space, equipment, technology
Critical capacity to utilise existing research appropriately, including that from overseas
C. Informing policy and product development
Improved information bases on which to make policy decisions: research findings can be
used to develop new policy, change policy or maintain existing policy
Feeding research findings into product and technology development efforts (eg science
commercialisation)
D. Health and health sector benefits
Increased effectiveness of healthcare provision leading to improved population health
Cost reduction in the delivery of existing services
Qualitative improvements in the process of service delivery
Improved allocation of healthcare resources, better targeting and accessibility, issues of
healthcare equity
E. Broader socioeconomic benefits
Economic benefits from a healthy workforce
Economic gains associated with science commercialisation and innovation
16.3.1 Categories of benefits (Payback)
and associated indicators
In the context of health research, within which
the Payback framework has most commonly
been applied, the framework considers five
categories of benefits, or paybacks: knowledge
production; benefits for future research and
research use; informing policy and product
development; health and health sector benefits;
and broader socioeconomic benefits. Box 16.1
summarises the various benefit categories and
their components. Box 16.2 highlights some
of the indicators that can be used to assess each
category.
170.
PERFORMANCE AUDIT HANDBOOK
Box 16.2: Some indicators of potential benefits from research (within a Payback
framework category)
131
A. Knowledge production
Number of publications from the research
Bibliometric measures (based on citation analyses)
Patent data
B. Benefits for future research: research targeting and capacity building
Citation analysis indicates influence of research on future studies
Information on funding sources and grant sizes can be useful for securing finance for
follow-on studies
Numbers of researchers trained and empowered through the research (eg higher degrees,
professional promotions)
Evidence of new or improved research infrastructure (eg equipment, facilities)
C. Informing policy and product development
Research cited in policies and guidelines
Researcher advisory roles on policy panels
Research cited in patent claims
Licensing out intellectual property rights
Number of products receiving regulatory approval
Contract research work for industry
Joint ventures
Inputs into private enterprise creation (eg founding or advisory roles)
D. Health and health sector benefits
Quality and Disability Adjusted Life Years
Reductions in visits to doctors and hospital days
Changes in mortality and morbidity statistics
Evidence of cost savings for the health sector
Evidence of quality gains in service provision
E. Broader economic benefits
Science commercialisation: profits resulting from the exploitation of intellectual
property, spin-off companies and licences
Revenue gains and/or cost savings resulting from export and/or import substitution
attributable to an innovation from the research
Human capital gains (eg reduction in productivity loss through illness or injury due
to innovations from the research; new employment opportunities resulting from the
exploitation of research findings)
171.
RAND Europe 16:Payback framework
16.3.2 The logic model in the Payback
132
framework
The second element of the Payback evaluation
framework is the logic model (Figure 16.1).
The logic model describes various stages and
interfaces in the process through which research
can generate impacts, including: research topic
identification; project specification and selec-tion;
inputs into research; the research process;
primary outputs from research; dissemination;
secondary outputs (the impact of research on
policymaking and product development, the
adoption of research findings by practitioners
and the public); and final outcomes. The logic
model can serve as a roadmap for conducting
research evaluations. The phases of the model
also enable an evaluator to examine whether
and how input, process and output and/or
outcome variables relate, which is important
for informing future research strategies.
The reality of research processes is likely to
be more complex than presented in the logic
model, and there is likely to be considerable
feedback between various stages: the logic
model helps facilitate assessments of research
impact through time, rather than pretending
to be a precise model of how research utilisa-tion
occurs.
Box 16.3 summarises the key elements
of each stage in the logic model that can be
examined during a research evaluation.
172.
PERFORMANCE AUDIT HANDBOOK
133
Figure 16.1: The logic model in the Payback framewor
Source: Hanney et al. (2004)
RAND Europe 16:Payback framework
Box 16.3: A summary of issues to consider in evaluations, within each stage of
the Payback logic model
Stage 0: Topic/issue identification
Examine how the idea for the research was born. Various drivers can exist (eg researcher’s
134
intellectual curiosity and interest, a known need in the research community, a solicited
call for the research).
Interface A: Project specification and selection
Examine the nature of proposal development (eg individual, team) and the peer review
process, including potential modifications to a proposal post-review.
Stage 1: Inputs into research
Examine the resource inputs into a project (eg financial resources, human resources, physical
resources, collaborators).
Stage 2: Process
Consider key factors that can affect the research process (eg the appropriateness of the
research design and methods for answering the scientific question; the difficulties or
challenges encountered during the research; facilitating or impeding factors; research
efficiency; interactions with the potential users of the research; any potential early
research dissemination or adoption activities occurring as milestones are reached).
Stage 3: Primary outputs from research
Consider the following payback benefit categories: knowledge production (category A),
and benefits for future research – research targeting and capacity building (category B).
Interface B: Dissemination
Identify types of dissemination mechanisms (eg conference papers and presentations;
seminars; audience-specific briefs; personal networking for research knowledge exchange;
education activities; interactions with the media – usually more active than the mere
production of academic publications).
Consider the time-scales over which dissemination occurs (during and after project work
completion), the levels of geographic and sectoral outreach.
Stage 4: Secondary outputs – policymaking and product development
In assessing secondary outputs, focus predominantly on research contributions to
informing policy and product development (benefit category C).
Research findings can be used in various ways (eg to develop new policy, change policy
or maintain existing policy), across different levels of the system, and with varying
degrees of impact.
Stage 5: Adoption by practitioners and public
Adoption of research findings is central to their translation into health and
socioeconomic benefits.
Consider behavioural changes (eg by practitioners, the public).
Examine adoption or take-up rates.
It is important to explore how far a behavioural change can be attributed to the specific
research findings, as opposed to other factors (such as a more general change in climate)
Stage 6: Final outcomes
The stage when health and health sector benefits (category D) and broader socioeconomic
benefits (category E) surface and can be examined.
178.
PERFORMANCE AUDIT HANDBOOK
135
16.4 When to use the Payback
framework for research
evaluation
Other methodological frameworks have been
adopted in evaluation research, but few are
as comprehensive and multidimensional as
the Payback model1. Brutscher et al. (2008)
suggest that the choice of an appropriate
research evaluation framework is influenced
by the evaluation objectives, the measures to
be used for assessing research outcomes, the
level of aggregation, and the timing of the
evaluation2.
16.4.1 The Payback framework and
evaluation objectives
Buxton and Hanney (1996) identify three
main reasons for undertaking an evaluation
with the Payback framework:
The Payback framework has most commonly
been used to justify spending resources on health
research; to assist with the prioritization of future
expenditure, and to indicate ways to improve
the conduct and management of research so as
to increase the likelihood or magnitude of subse-quent
beneficial consequences.
16.4.2 Measures used in the Payback
framework
The benefit categories and measures used in the
payback framework were summarised above.
The Payback framework should be used when
evaluators want to consider input, output, out-
1 For a review of various evaluation frameworks see:
Brutscher et al. (2008).
2 In addition, the authors suggest that the choice of ob-jectives
influences the measures used for assessing research
outcomes, which in turn influence thinking about the right
level of aggregation and timing. In addition, the choice of
the level of aggregation influences the choice of methods
used.
come and impact measures in their evaluations
of research.
The Payback framework considers a diverse
range of measures for assessing the benefits
from research, including input measures, which
capture the resources consumed (eg physical,
financial and human resources, collabora-tions);
output measures, which capture the
direct results of the research (eg publications,
patents, career development outputs); outcome
measures, which reflect the initial impact of
research (eg impacts on policy and product
development); and impact (final outcome)
measures, which capture longer-term impacts
(eg broader socioeconomic benefits). A range
of methods can be used to assess individual
research output categories, as well as a number
of indicators.
16.4.3 The Payback framework and
levels of aggregation
The level of aggregation in an evaluation can
be (i) low (individual researcher, research
group or research project), (ii) intermediate
(faculty or research programme) or (iii) high
(research discipline, research council, charity,
industry or university).
The Payback framework is most suitable for low
(individual researcher, research group or research
project/grant), and intermediate levels (faculty or
research programme) of aggregation.
The Payback framework is generally imple-mented
through case studies and concen-trates
not only on assessing the benefits from
research, but also on understanding the proc-ess
through which the research and its benefits
unfolded, and the variables integral to the
process. This allows the logical flow between
inputs, outputs, outcomes and impacts to be
captured and investigated in detail. However,
179.
RAND Europe 16:Payback framework
using the Payback framework for evalua-tions
136
at high levels of aggregation would be
very time consuming and costly. Evaluations
at higher levels of aggregation tend to adopt
macroeconomic and/or microeconomic mod-elling,
and/or productivity analyses that focus
less on process, and more on outcomes. This is
not to say that such modelling methodologies
could not be applied to a Payback framework-based
evaluation, but they have not been to
date. Other frameworks exist for higher levels
of aggregation (eg research discipline, research
council, charity, industry or university)1.
16.4.4 The Payback framework and the
timing of an evaluation
The timing of an evaluation relates to the
time interval between the completion of the
research and evaluation.
The Payback framework has been applied and is
suitable for both cross-sectional and longitudinal
evaluations, and can be used at various times
after primary research has been completed.
Timing considerations in evaluations based
on the Payback model have varied across
applications. For example, the Payback evalu-ation
conducted for the Arthritis Research
Campaign (Wooding et al., 2005) covered
impacts 10–12 years after the completion of
examined research. Project Retrosight – an
examination of the returns from cardiovascular
research in three countries – covered a period
of 10–20 years after the completion of research
projects. On the other hand, the evaluation of
the ESRC Future of Work programme looked
1 These include the Vinnova framework of the Swed-ish
government agency for innovation systems; the UK
Department for Innovation, Universities and Skills (DIUS)
evaluation framework; and the European Commission
Framework Programme 7 evaluation framework.
at the benefits from research projects over a
shorter time frame (3–6 years following com-pletion
of the research).
Lastly, it is worth noting that not all cat-egories
of the Payback framework will apply
equally (in terms of relevance) across diverse
research types. For example, when evaluating
the outcomes from basic science research in
a healthcare context, knowledge production
outputs are likely to be more relevant than
outcome measures such as informing policy
(at least relative to clinical research). At a
minimum, longer time frames are needed to
study the contributions of basic research to
more downstream outputs and socioeconomic
impacts.
16.5 How to use the Payback
framework
The Payback framework is implemented
through case studies.
Gathering evidence: The case studies are
based on multiple sources of evidence, which
all feed into deriving conclusions from an
evaluation, and are used to test confidence in
the conclusions. The main sources of evidence
include grey and peer-reviewed literature
and archival documents, semi-structured
key informant interviews, which can also be
complemented by surveys, and bibliometric
analysis. Anecdotal evidence suggests that
those being evaluated (by and large) agree with
the evaluation outcomes.
Write-up of case-study narratives: When
evaluating the payback from research, the first
step in the analysis process generally involves
writing up case study narratives. The core
categories (phases) of the Payback logic model
serve as themes when organising the case study
write-ups. They ensure a requisite level of
180.
PERFORMANCE AUDIT HANDBOOK
137
consistency in data reporting across individual
case studies.
Comparing and synthesising data from
multiple case studies: There are a number of
techniques that can help triangulate data from
multiple case studies. They include coding and
scoring case study data to assist in compari-sons,
and drawing inferences from the broader
outputs and impacts of projects/programmes,
in addition to expert workshops.
A coding scheme can be developed to
provide a way of facilitating cross-case data
comparison. The coding process helps capture
and organise data that emerges from the inves-tigations.
It is in essence a way of enabling the
quantitative representation and comparison
of qualitative evidence. This is an important
step towards the abstraction and prioritisation
of overarching policy relevant themes and
the more salient features influencing research
processes and their impacts. The key categories
of the Payback logic model, and the associated
questions explored in interviews, can serve as
coding themes. Each coding category should
be designed in a way that minimises the need
for investigator judgement, and ensures that
the coded data is an objective feature summary
of each case.
Scoring projects described in the case stud-ies
on a series of dimensions that reflect the
Payback benefit categories can be generated
through a consensus scoring technique that
provides a means of collapsing the complex-ity
of the case studies to produce “summary
output statistics”. Scoring can help towards
making sense of outputs, against the types of
research conducted and against the variables
influencing research processes.
Drawing conclusions: A study team can
then review the narrative case studies and
the cross-case analyses of coded and scored
data to extract recurring themes and explore
the links and potential contradictions across
cases. The strength and resilience of themes
can be assessed, and grouped and prioritised
accordingly. Attention should also be devoted
to ensuring that pertinent data is not omitted
from analyses, including considering “outlier”
(eg more rare) themes or variables that may be
particularly important for a distinct type of
research or organisational context.
A final step in the evaluation of research
using the Payback framework can involve the
triangulation of empirical evidence against the
broader policy and institutional context within
which the investigated research occurred
(during a study timeframe). Expert workshops
can assist in the process. They allow a study
team to test and discuss the findings and infer-ences
from the evaluation against the contex-tual,
specialised knowledge of experts, and to
consider the implications of the findings from
an evaluation in more detail – through a par-ticipatory
and stakeholder inclusive research
approach.
16.6 The Payback framework in
action
The Payback framework has been applied in
a number of different contexts. Buxton and
Schneider (1999) explored applying it to a
Canadian research organisation that funded
basic biomedical and early clinical studies,
alongside health services research1. The model
has also informed analysis of health research
systems on behalf of the World Health
Organization (Hanney et al., 2003; Pang et al.,
2003). It has most recently been used in assess-ments
of the payback from Health Technology
Assessment programmes in the UK (Hanney
et al., 2007) and the Netherlands; to explore
1 Prior to this, the framework was generally applied to
health-service research in the UK context only.
181.
RAND Europe 16:Payback framework
the payback on arthritis research funded by
the Arthritis Research Council (Wooding et
al., 2004, 2005, Wooding et al., 2005) and the
research of the Irish Health Research Board
(Nason et al., 2008), and to investigate the
payback on cardiovascular disease research in
three countries (Australia, Britain and Canada),
and the pathways through which this payback
is generated (i.e. Project Retrosight).
138
Increasingly, other researchers are also
applying the Payback framework to assess
programmes of research in the UK and inter-nationally.
These include studies of the full
range of health services research funded by
the Alberta Heritage Foundation for Medical
Research (AHFMR, 2003); the full range of
basic and clinical research funded in Cata-lonia
by the TV3 telethon (Berra and Pons,
2006); the range of health services research
in the UK funded by the Service Delivery
and Organisation programme (Peckham et
al., 2006); examples of primary care research
in Australia (Kalucy et al., 2007); and the full
range of research funded by the Health Serv-ices
Research Fund of Hong Kong (Kwan et
al., 2007).
The Payback framework is adaptable, and
has also been successfully applied outside of
health-related research contexts, such as in
the social sciences. One example is the evalu-ation
of a social science research programme
of the Economic and Social Research Council
(ESRC) (Nason et al., 2007). Over the past
decade, a culture of accountability had grown
around government spending. This climate
led ESRC to investigate the most effective
ways to evaluate social science research and
demonstrate the wider impact of its research
on society. RAND Europe examined how the
ESRC Future of Work (FoW) programme
(which investigated future prospects for paid
and unpaid work in the UK) influenced policy
and professional practice. The programme’s
goal was to provide evidence-based research to
help policymakers, practitioners and research-ers
interpret the changing world of work in an
era of rapid social, technological and economic
change.
RAND Europe carried out four case stud-ies
to explore the wider impacts of selected
research projects within the FoW programme,
using the Payback framework. The data sources
used in each of the case studies included: the
grant application, peer review comments on
the grant, the Programme Director’s final
report; papers and publications attributed to
the grants, survey data, face-to-face interviews
with PIs, telephone interviews with other
researchers associated with the grant; telephone
interviews with policy and practitioner users;
initial key informant interviews and reviews of
relevant policy documents.
Evidence from the cases studies was
compared and synthesised to make infer-ences
about the impact of the programme.
An analysis workshop was then conducted,
and brought together the project team and an
ESCR project manager to discuss the findings
and jointly reflect on emergent themes.
The project schematic adopted in evalu-ating
the FoW programme is summarised in
Figure 16.2.
RAND Europe 16:Payback framework
For the purposes of this project, the ben-efit
140
categories of the Payback framework were
adapted to a social science context. For exam-ple,
health and health-sector benefits (benefit
category D) were not considered, and the wider
socioeconomic benefits (benefit category E)
considered factors such as social or economic
effects that change society (including impacts
on public opinion and media coverage as proxy
for public opinion), rather than health sector
related socioeconomic benefits. Box 15.4 sum-marises
the Payback benefit categories adapted
for the evaluation of the FoW projects1. The
logic model element of the Payback framework,
used to capture the research narrative, could be
effectively applied without modification.
Box 16.4: Revised Payback categories
for social science
A. Knowledge production
B. Benefits for future research and research
use
C. Impacts on policy
D. Impacts on practice
E. Wider socioeconomic benefits
Source: Adapted from Wooding et al. (2007)
The Payback evaluation showed that the FoW
programme had significant impacts on: knowl-edge
and research (in the form of publications,
presentations and changes in relevant fields of
research); policy (through seminars, network-ing,
informing policy debates and contributing
1 In modifying the health-related categories, RAND
Europe chose to generalise them rather than to alter their
specificity to relate to employment. This was done because
the project was the first time the applicability of the
Payback framework to the social sciences in general was be-ing
examined, using the employment sector as a test case.
This raises the issue of whether it may be useful to classify
impacts by whether they fall within the same sector as the
research: health in our initial work, employment in this
work. In this project, RAND Europe wished to explore
wider impacts in as general a sense as possible, so chose not
to make sector distinctions.
to policy formulation); and the career devel-opment
of FoW programme researchers
(including network formation and promo-tions).
Adopting the range of data sources and
methodologies outlined in Box 16.4 allowed
RAND Europe to identify a range of benefits
from research within the FoW programme.
The benefits from research (in each of the
four case-studies conducted) are summarised
in Table 16.1 below.
16.7 Summary
There are a number of reasons for evaluating
research. These include ensuring transparency
and accountability for research spend, advo-cacy
purposes, to help steer research processes
towards desired outcomes, and to assist in the
management of research processes through
learning from past experience.
RAND Europe 16:Payback framework
Table 16.1: The payback from research in case studies of the
Future of Work programme
142
Case study A Case study B
Knowledge
production
Three peer-reviewed papers (more
forthcoming)
Three further academic papers
commissioned by the PI within
government
Four book chapters, one book
25 presentations to academic
audiences
12 peer-reviewed papers
Book chapter for Managing
labour in small firms
Six presentations to academic
audiences
Research
targeting
Ongoing dialogue with other
researchers in FoW
Ongoing debate about agency/
constraint in women’s employment
decisions
Interdisciplinary contribution to
PI’s academic research
Constructive academic-policy
crossover affecting policy; policy
needs feedback into PI’s research
of findings
Research method recognised by
DTI as the most appropriate for
studying small firms
Successful ongoing collaboration
between PI and senior researcher
Follow-up research for the LPC,
DTI, Work Foundation and ESRC
Researcher career advancement
and achievements (eg OBE)
Informed research on the minimum
wage in Manitoba, Canada
Impacts on
policy
White Paper on Work and
Families (2003)
Work and Families Bill (2003)
Key Indicators of Women’s
Position in Britain (2003, 2005)
Women and Work Commission
Report (2006)
Green Paper on Work and Parents
Various EOC documents on work
and families, 2001–2006 (10
cite PI)
Five non peer-reviewed articles
and numerous presentations to
policymakers
Report to LPC providing evidence
on the NMW
Informed policymakers at the DTI
and LPC about the situation in
small firms
One case study organisation was
investigated in a LPC review
Helped the ERD at DTI to
understand the situation with small
firms in the UK
Graduate course content is now
different
One non peer-reviewed
article and a presentation to
policymakers
Source: Adapted from Wooding et al. (2007)
186.
PERFORMANCE AUDIT HANDBOOK
143
Case study C Case study D
Three peer-reviewed papers
One management book of Phase II
Upcoming academic book
A forthcoming book chapter
Over 16 presentations to academic
and non-academic audiences
Nine peer-reviewed papers
14 book chapters
One upcoming book by the PI and two of the
researchers
17 presentations to academic audiences
Formed new collaboration between
research groups
Foundation for grant in Phase II
Other researchers’ publications
citing papers from the project
Data set used for additional work
by team and available to other
researchers in ESRC archive
Installation of the PI as Chair of the TUC
Partnership Institute Advisory Committee
Further research by the PI and others on the
grant would not have occurred without FoW
Career progression of academic lawyer on
team
Creation of new researcher networks for the PI
and research team members
Informed Health and Safety
Commission work on work-related
stress and work–life balance
Use by Work Foundation relating to
job satisfaction
Reinforced the policy line of the CIPD
Equal Opportunity Commission
research drew on the project work
One organisation changed its policy
regarding junior staff workloads,
the behaviour of managers, and the
structure of the career ladder
Four non peer-reviewed articles
and numerous presentations to
policymakers
Referenced in House of Lords Judgement
Input into an employer–union deal with a
major UK employer
Movement of the junior researcher into ACAS
ACAS taking on board the results of Phase II
DTI, Work Foundation and TUC claimed the
work had shown the ‘lie of the land’
Two researchers submitted evidence to DTI
review of the Employment Relations Act 1999
Reports to the ILO and Labour Relations
Commissions Review
12 non peer-reviewed articles, 6 presentations
to policymakers
Continues
187.
RAND Europe 16:Payback framework
Table 16.1: The payback from research in case studies of the
Future of Work programme (continued)
144
Case study A Case study B
Impact on
practice
The “planning finding” taken up
by various corporate practitioners
to negotiate decisions around
maternity leave and return to work
Contribution to discussions on
introduction of paid paternity
leave
Informed small firm owners/
managers of the likely impacts of
the NMW, but difficult to know if
they changed behaviour due to
that information.
Wider
social and
economic
benefits
Six articles in local and 11
articles in national newspapers,
numerous magazine articles
Four radio interviews
One BBC TV appearance
Reduction of gender segregation
and pay gap if flexible working
available for women returners
No media outputs registered
Impossible to attribute any socio-economic
benefits to the project
Source: Adapted from Wooding et al. (2007)
Over time, a number of research evaluat000ion
frameworks have been developed and serve as
guides for conducting research evaluations.
This chapter discussed the Payback framework,
its purposes, when and how to use it. Payback
is a tool for evaluating a comprehensive range
of potential outputs and impacts from research
and (unlike many other research evaluation
frameworks) also provides a way of conceptu-alising
the process through which outputs are
created (ie the logic model).
As with all research evaluation frame-works,
caution needs to be exercised by evalu-ators
when attributing impacts of research
to a person, grant, project or programme.
Approaches such as bibliometric analysis (cita-tion
analysis) have attempted to assist attribu-tion
efforts. However, when (as is generally
the case) a product, policy change or socioeco-nomic
impact is generated through contribu-tions
from diverse research projects over time,
attribution is by no means straightforward.
16.8 Further reading
Arnold, E. and P. Boekholt, “Measuring ‘rela-tive
effectiveness’”. In Boekholt, P., Inno-vation
Policy and Sustainable Development:
Can Innovation Incentives make a Differ-ence?
Brussels: IWT Observatory, 2002.
188.
PERFORMANCE AUDIT HANDBOOK
145
Case study C Case study D
Research was discussed with
advisory group; could have led to
changes in practice by members
Research was fed back to study
organisations; could have led to
changes in practice in studied
organisations
Research was fed back to study organisations
as part of the clearance process, but there are
no known practice impacts from this
The way a major UK employer conducted itself
in the negotiations of a new partnership deal
Increased awareness of workplace
issues and equality through extensive
media coverage (use of findings by
FoW media fellow; 20 articles in
national and 50 in local newspapers
15 in magazines and features in TV)
Impossible to attribute any socio-economic
benefits to the project
Three pieces in local newspapers about the
Phase I research.
Three items in magazines (trade press)
Impossible to attribute any socio-economic
benefits to the project
189.
RAND Europe 17:Process mapping
CHAPTER 17
146
Process mapping Jan Tiessen
17.1 Key points
Process mapping is a tool for graphically
representing a series of tasks or activities
that constitute a process.
Process mapping enables better
understanding of the process examined,
including gaps, bottlenecks and other
problems.
Process mapping is particularly useful for
visualising and understanding complex
processes.
17.2 Defining process mapping
Evaluations in the public sector often involve
analysing processes. Processes can be thought
of as a series of tasks and activities conducted
by one or several actors, which transform a
number of inputs into an output, either a serv-ice
or a good. A common methodology used
to support such analysis is process mapping.
Process mapping aims to identify all the steps
and decisions that occur as part of a process
and to produce a graphical representation of
that process. Process mapping can be used in
an evaluation context as:
a descriptive tool to create a better
understanding of an existing process
an analytical tool for identifying problems
within a process, such as process
bottlenecks, redundant process steps and
inefficiencies
a tool to communicate the complexity of
a process, the potential for improvement
and what an improved process might look
like.
In many cases, process mapping will also be
a first step before applying more sophisticated
analytical techniques, such as activity-based
modelling.
The graphical representation, ie the proc-ess
map itself, can take many different forms.
There are at least two broad types of process
maps:
flowcharts, which show the sequencing
of activities and tasks performed within a
specific process
process definition charts, which show
the necessary inputs and resources for
each activity, the resulting outputs, and
the controls that are used to direct the
process.
17.3 When to use and when not to
use process mapping
In principle, process mapping can be used to
analyse a wide range of processes in a variety
of organisations and settings, ranging from
the manufacturing process (eg assembling a
car) and service delivery (eg paying out child
benefits) to political decisionmaking processes
(eg deciding to increase alcohol taxes). Given
the resources required to conduct a thorough
process mapping exercise, process mapping
might best be applied to processes that are:
client facing – produce a service or
product for an external client, eg
providing housing benefits or treating a
patient
complex – consisting of many steps and/
or involving a multitude of actors that
need to interact
high volume – are repeated often, eg
application of unemployment benefits or
lottery grants
190.
PERFORMANCE AUDIT HANDBOOK
147
standardised – are executed according
to some kind of standard operating
procedures and are not adjusted ad hoc
on a case-by-case basis.
We can expect the improvement potential for
these processes to be greater than for processes
that are fluid, very flexible and conducted on
a case-by-case or ad hoc basis, such as some
political decisionmaking processes. While a
process map might still help to understand the
specific process, and allow us to answer “Who
did what when?”, it will not be of great value
in analysing the process or suggesting improve-ments,
as process steps might not be taken in a
similar way again (some process steps might be
taken in another order, others might be omit-ted
altogether).
17.4 How to conduct process
mapping
Including a process mapping exercise in an
evaluation requires a number of steps, of which
the actual drafting of the process map is only
one. Considerable effort and care have to be
devoted to gathering the evidence for drafting
the process map. This section will explore six
key steps and choices that must be considered
when conducting a process mapping exercise.1
Step 1: Clarify the objective and define the
boundaries of the process to be studied
It is essential to clarify the objective of the
process map before starting the research. What
will it be designed to do?
Describe a process?
Create better understanding of a process?
Communicate with the people involved?
1 More detailed guidance can be found in Damelio
(1996), Hunt (1996), George et al. (2005) or the excel-lent
summary of the Scottish Audit Commission (Audit
Scotland, 2000).
Identify problems, inefficiencies and
shortcomings of a process?
Improve a process?
Value, cost and quantify activities?
The ultimate objective of the process map will
influence both the best type of map to produce
and the evidence gathering stage.
In addition, the boundaries of the process
to be studied should be defined. That means
defining a clear starting point (eg receipt of an
application for a lottery grant) and end point
(eg applicant receives lottery grant). This will
help to focus the process map once the draft-ing
begins.
Step 2: Choose a process map type
Common types of process maps are:
flowcharts (high level , activity level or
task level)
deployment or swim lane flowcharts
process definition charts
value stream maps
data flow diagrams.
Each of these types of process map has spe-cific
advantages and disadvantages and allows
researchers to answer a specific set of ques-tions.
Table 17.1 provides a summary of the
key characteristics that need to be considered
in choosing the type of process map to use.
191.
RAND Europe 17:Process mapping
Table 17.1: Choosing a process map
Type of
map
148
Description Questions Advantage Disadvantage
Flowchart
Breaks down a
process into se-quential
steps and
decision points;
depending on level
of analysis high-lev-el,
activity level, or
task level flowcharts
are used
What are the steps of
the process?
In which order do they
occur?
When are decisions
taken?
Intuitive way of presenting
a process, thus easy to
conduct
Provides a very good
overview of a process
Allows identification of
redundant process steps
Can become
very tedious if
high level of
detail
Requires very
high level
of process
knowledge
Deployment flowchart
Breaks down a
process into sequen-tial
steps and deci-sion
points;
highlights the role of
different actors in a
process
What are the steps of
the process?
In which order do they
occur?
When are decisions
taken?
Who is involved in the
process?
Makes it easier to suggest
the department which
needs to make changes
Allows identification of
responsibilities
Easy to produce when
flowchart is already
available
May lose
focus on
problematic
tasks or
decisions
Process definition chart
Focuses attention
on the context of a
process by looking
at inputs and out-puts,
resources and
controls
What are the inputs of
the process?
What are the outputs of
the process?
What resources are
needed?
How is the process
controlled?
Achieves breadth of a
subject matter, discusses
also resources and
constraints
Includes information about
resources and controls;
integrates the context into
the process
Approach less
intuitive
Difficult to
pinpoint what
is driving
down value in
a system
Value stream map
Adds information
attributes such as
time and costs to the
analysis of proc-esses
How much does a
process step cost?
What parts of a process
add value?
What parts of the
process adds costs?
Where do delays occur
in the process?
Allows quantification of
process improvements
Collects a wide range of
information
Conceptually
complex
Resource
intensive
Data flow
diagram
Shows the flow
of data through a
complex system
How are processes /
activities linked?
How does the data flow
through an IT system?
Where and when is
data stored?
Improves understanding of
how data is managed
Shows how sub-processes
are interconnected
Very little
information
about the
processes
and activities
themselves
Source: RAND Europe
192.
PERFORMANCE AUDIT HANDBOOK
149
Step 3: Conduct fieldwork
The type of process map determines the type
and amount of information that should be col-lected
during fieldwork, which in turn influ-ences
the methods used during the fieldwork.
The information required for each map type is
listed in Table 17.2.
To gather this information, a number of
research methods might be considered. In
conducting a process mapping exercise it is
essential to capture the actual or “as is” process
rather than an idealised “should be” version of
it. It is thus recommended that several research
methods are used to triangulate findings. To
gather the evidence needed, well-known quali-tative
research methods can be applied, such
as:
Table 17.2: Types of information collected in different map types
Type of map Information required
Flowchart and deployment
flowchart
Basic process information
What starts the process?
What are the key steps/tasks of the process?
In which order are do these steps occur?
When are decisions taken?
Who is involved in each step?
Process definition chart In addition to the above:
What are inputs and outputs of each process step/task?
What are the resources needed to perform a process
steps/task?
Who/what controls the process steps/tasks, and how?
What are the constraints of the process/tasks?
Value stream map In addition to the above:
How long does it take to complete the process step/task?
What is the overall length of a process step/task?
What are the costs associated with the step/task?
Does the step add value to the product/service?
How does the information flow through the production
process?
How do materials flow through a production processes?
Data flow diagram
In addition to the above:
How does data flow between different process steps?
Where and when is data stored in a process?
Source: RAND Europe
document analysis
key informant interviews
focus groups /workshops
process observation.
For a typical process mapping exercise, the
analysis might start with reviewing available
documents to get a basic understanding of the
process, before conducting an observation or
walk through of the process and supporting
interviews with key staff, such as product/serv-ice
managers, desk officers, support staff, etc.
In gathering evidence, it is important to
engage people from all involved units in an
organisation and all involved organisations,
as well as staff from different organisational
levels. Observation can be considered the
193.
RAND Europe 17:Process mapping
Table 17.3: Methods for gathering evidence
Method Advantage Disadvantage
Document
analysis
methodological gold standard for process map-ping;
150
however, time and resource constraints
might mean that a less resource-intensive
approach must be used. 17.3 provides an over-view
of available methods and their advantages
and disadvantages. More details about how to
execute some of these methods can be found in
the other chapters of this handbook.
Step 4: Produce and validate a draft process
map
Once the evidence about the process to be
mapped has been collected, drafting can begin.
Drafting a process map is usually done in two
stages:
production of a first, brown paper draft
validation meetings.
In the first stage of drafting, an outline draft
of the process is produced by first listing all
the steps identified, and then sequencing the
steps according to the information retrieved.
A common method for this is to use a white-board
or large piece of brown paper, and attach
Post-it® notes to it, each note representing a
process step.
When the draft map is satisfactory,
validation meetings should be arranged with
a selection of staff from the organisation(s)
being analysed. These meetings are held to
correct the map and agree on the final process
map by asking whether steps are in the right
order, whether all steps have been depicted
and whether responsibilities for each step have
been recorded accurately.
Quick to conduct
Few resources required
Little audit burden for
analysed organisations
Danger of capturing an idealised
process rather than the actual/real
process in the organisation
Does not allow capturing views
of employees and managers of
potential problems in the process
Key informant
interviews
Allows in depth discussions
with people involved in the
process
Allows gathering of individual
views on process
Helps identify problems of
the process through close
interaction with staff
People usually can’t provide
accurate assessments of time frames
taken to complete tasks
Relatively resource intensive
Focus groups /
workshops
Very interactive
Help build consensus around
the process maps very early
Fewer resources needed than
for interviews
Some members of staff might not
speak up openly if different levels of
hierarchy are present at workshop
Do not allow for a very detailed
discussion of tasks
Process
observation
Allows the researcher to
experience the real process
Allows the collection of data,
eg on time taken, as process
moves on
Resource intensive
High audit burden
Source: RAND Europe
194.
PERFORMANCE AUDIT HANDBOOK
151
Step 5: Draw the process map
With the draft process map agreed, the final
process map can be drawn. Different types of
process maps follow different drawing conven-tions.
Three of the most commonly used proc-ess
mapping types are:
flowcharts
deployment flowcharts
process definition charts.
Drawing a flowchart
Flowcharts are distinguished according to the
level of analysis – high, activity or task. The
deployment or swim lane flowchart is a special
way of arranging a flowchart. All these flow-charts
use a small set of standardised symbols
to illustrate main process steps and show the
flow of the process. Table 17.4 shows the most
common process mapping symbols.
195.
RAND Europe 17:Process mapping
Table 17.4: Standard flowchart symbols
Symbol Use
Activity or task
152
The activity or task rectangle is one of the most central elements of
the map. It represents a step in the process in which an action is
taken (ie send application, sign off on budget, etc). The generally
accepted methodology for wording in the boxes is to enter a verb
+ noun
Arrows are used to indicate the flow of the process. Arrows
should not intersect but pass over and under each other to ensure
you can trace the process accurately.
yes
no
Decision
A diamond shape is used to illustrate decision points. There are
two ways of continuing – one direction for a yes answer and
another for no. It is important, therefore, to write the question
in the decision diamond in such a way that it can be answered
with a simple yes or no. Then, arrows can extend towards the
corresponding step in the process. If your map flows top down it
is convention to let the yes arrow point down; if your map flows
from left to right it should point right.
Start / End
A terminator is used in task level flowcharts to identify the start
and end point of a process, eg application received as a start
point and payment made as the end point.
Source: RAND Europe
These symbols are used to draw the process
map. A single box is used for each step of the
process, labelled with a verb + noun combina-tion
(eg check eligibility; stamp letter, etc) and
boxes are connected using arrows. The deci-sion
and terminator symbols are commonly
only used in task level flowcharts.
Figure 17.1 below shows examples of
high-, activity- and task-level flowcharts. It also
illustrates how different levels of flowcharts
can be used to describe a process at different
levels of detail. In this case, the high-level
flowchart outlines a process to improve staff
skills through training. One of these steps, the
implementation of a training programme (step
5), is then outlined in more detail using an
activity-level chart. One of the activities of the
implementation is to book accommodation
for a training course (5.4). This activity is now
broken down again into activities, using a task-level
flowchart.
196.
PERFORMANCE AUDIT HANDBOOK
Figure 17.1: Examples of high-, activity- and task-level flowcharts for a process
of assessing staff skills
153
Identify the skills
staff will need to
deliver the service
plan
1
High-level flowchart
Assess the current
skills and
competencies of
staff
2
Agree and
prioritise the
training needs of
staff
3
Develop
programme of
training events to
meet these needs
4
Implement
programme of
training events
5
Monitor and review
impact of training
events
6
Confirm budget
available
5.1
Book catering
5.5
Activity-level flowchart
Book
Accommodation
5.4
Arrange dates
5.3
Book trainer
5.6
Run events
5.10
Recharge costs to
service budget
5.11
Source: Adapted from Accounts Commission (2000)
Task-level flowchart
Start
End
Training manager
provides event
details
Admin assistant
completes facilities
request form
Request form
signed by Training
manager
Form sent to
Facilities manager
Booking recorded Yes Room available ? Notify admin
assistant
Admin assistant
notifies Training
manager and
services
Notify finance
department of
charges
No
Admin assistant
notifies Training
manager
Training manager
notifies service
manager
Organise new
date?
Yes
No
Connect to
process for
booking
external
facilities
Agree attendance
numbers for each
event
5.2
Photocopy training
material
5.8
Book equipment
(OHP, flipcharts)
5.7
Notify participants
5.9
197.
RAND Europe 17:Process mapping
Drawing a deployment flowchart
A deployment flowchart focuses on the inter-action
154
between and the responsibilities of
different actors in a process. It uses the same
symbols, but arranges the steps in functional
bands or swim lanes. So in the final chart, all
actions of the same actor will be in the same
column or row, depending on the orientation
of the chart. The process flow will now criss-cross
between the functional bands. Figure
17.2 below shows how transforming a task
level flowchart into a deployment flowchart
would look.
Figure 17.2: Example of a deployment
flowchart
Process Name
Dept. A Dept. B Dept. C
Source: RAND Europe
Drawing a process definition chart
Process definition charts differ from flowcharts
by focusing on the inputs and outputs of
a process, as well as taking into account the
resources needed and the controls active in a
process. Process definition charts are graphi-cally
very simple and only consist of boxes
that describe the process or activity, and a set
of arrows that indicate the influences on this
process, as shown in Figure 17.3.1
Figure 17.3: Terminology of process
definition charts
Controls
Process
or
Activity
Inputs Outputs
Resources/
mechanisms
Source: RAND Europe, based on IDEF0 standards
The rectangular box represents an activity
or process, and is labelled using a verb/verb
phrase.
Arrows represent different aspects of the
process depending on where they enter/
leave the box: Arrows entering the left
side of the box are inputs. Inputs are
transformed or consumed by the function
to produce outputs.
Arrows entering the box on the top are
controls. Controls specify the conditions
required for the function to produce
correct outputs.
Arrows leaving a box on the right side
are outputs. Outputs are the data or
objects produced by the function.
Arrows entering the box at the bottom
are resources or mechanisms. These
are some of the means that support the
execution of the function, but are not
1 Process definition charts are based on the IDEF0
specifications, which provide very detailed guidance on
how to draw process maps (see Draft Federal Information
Processing Standards, 1993).
198.
PERFORMANCE AUDIT HANDBOOK
155
consumed or transformed during the
process.
The basic concept of process definition charts
is that the process/activity box is used to
label a process of transformation of inputs into
outputs. An un-reviewed document (input)
is, for example, transformed through the
review process (activity) into a reviewed docu-ment
(output). This process follows review
guidelines (controls) and needs the time of a
reviewer (resources).
This basic notation is used to build a
process definition chart. A very basic A0 chart
would just comprise a single box and define
the whole process. A larger process can, how-ever,
also be broken down in a number of sub-processes,
each represented by a process box
and the respective arrows. Figure 17.4 gives an
example of a process definition chart for the
process of ordering and producing a pizza for
home delivery.
As for flowcharts, process definition charts
can also be produced for different levels of
detail. In this case, each sub-map would illus-trate
exactly one box of the parent chart.1
1 For details, see Draft Federal Information Processing
Standards (1993) or Hunt (1996).
199.
156
RAND Europe17: Process mapping
Figure 17.4: Example of a process definition chart (Pizza delivery)
Menue
Hungry Taking an order
customer
Source: RAND Europe
Producing pizza
Shipping pizza
Delivering pizza
Pizza
ready
Pizza
shipped Delivered
pizza
Ingredients,
packaging
Kitchen equipment
motorbike
Customer info
Waiting customer
Satisfied
customer
Recipes
Staff
Customer info
Production
request
Staff
Telephone
Staff
Customer payment
200.
PERFORMANCE AUDIT HANDBOOK
157
Step 6: Analysis and reporting
The visual representation of the process being
studied can now be used to analyse the proc-ess.
Some of the worst problems linked to a
process often become immediately apparent
once a process has been mapped out, but
there are also more formal ways of analysing
a process. One more structured way, termed
critical examination, is described in the
Environmental Protection Agency’s (2009)
process mapping toolkit. It consists of using
the primary questions – What, How, When,
Where and Who – to first define what is actu-ally
happening (“as is” analysis), and then to
identify alternatives (“could be” analysis) and
to recommend improvements (“should be”
analysis). Table 17.5 provides an overview of
suitable critical examination questions.
While conducting such an analysis, typical
process problems are often uncovered, such
as:1
1 See also Hunt (1996), Damelio (1996) or George et
al. (2005).
Table 17.5: Critical examination questions
“As is”
analysis
“Could be” analysis “Should be”
analysis
PURPOSE
What is achieved?
Why? What else could be
achieved?
What should be
achieved?
MEANS
How is it achieved?
Why that way? How else could it
be achieved?
How should it be
achieved?
SEQUENCE
When is it
achieved?
Why then? When could it be
achieved?
When should it be
achieved?
PLACE
Where is it
achieved?
Why there? Where else could it
be achieved?
Where should it be
achieved?
PERSON
Who achieves it?
Why that person? Who else could
achieve it?
Who should
achieve it?
Source: CPS (2004)
bottlenecks and resulting backlogs
endless “do-loops” where rework is
common
unclear responsibilities and roles
delays between steps
redundant, non-value-adding steps.
The final step of the process mapping exercise
is to report the findings, which can be done
using different approaches:
An evaluation approach focuses on the “as
is” analysis, laying out the current process
and flagging up the problematic aspects.
The comparison approach is used if the
main objective is to improve a process
and implement suggested improvements.
The process map of the current process
is supplemented with a map of how the
ideal process should work.
A benchmarking approach is used if the
study included several processes that
201.
RAND Europe 17:Process mapping
158
need to be compared against each other.
This helps to flag up differences between
processes and identify good and best
practice.
17.5 Process mapping in action:
awarding grants in the culture,
media and sport sector
In 2008 the NAO, supported by RAND
Europe, conducted a study into the efficiency
of making grants in the culture, media and
sport sector (National Audit Office, 2008). In
this study, process maps were used to achieve a
better understanding of the processes, to iden-tify
key stages of the process, to inform activity-based
costing, and to compare different grant
programmes. To gather the evidence, the study
team reviewed available documentation from
the organisations, conducted interviews with
the people involved in each step of the proc-ess,
and validated the findings in collaboration
with the audited organisation.
Figure 17.5 shows how a task-level dia-gram
was used to show the tasks involved in
the grantmaking process. This map appears
rather crowded, as the flow of the process has
been drawn both up and down as well as from
left to right to capture as much of the richness
of the process in as little space as possible. In
addition, this map contains more information
about actors through marked process boxes
and a system of colour-coding.
Figure 17.6 shows a second process map
from this report, comparing activity level
flowcharts. In this map, several grantmaking
programmes from various bodies are com-pared.
It can be seen, for example, that some
bodies only have a one-stage application proc-ess,
while others aim to sift out a large number
of applicants earlier on in a two-stage process.
Some programmes seem to invest more in the
applications by also being involved in project
development.
202.
PERFORMANCE AUDIT HANDBOOK
159
Stage 1 Stage 2 Case Development Decision Award
Applicant
Considers applying for a
grant under the
Community Investment
Fund
Applicant
Registers with Sport
England’s online
application portal and
starts to apply
System
determines
eligibility after first
questions
not eligible
System Process
Applicant is provided
with information about
other funding
Applicant
Fills in and submits
Stage 1 application
System Process
Assesses potential
based
on overall scoring
Case Developer
- gets assigned
to application
- reviews application
Case Developer
determines
potential
Email to encourage full application
Case Developer
Email sent to applicant
discouraging them to submit
a full application, information
about alternative sources
provided
elig ible
Applicant
Fills in and submits
Stage 2 application
Case Developer
Reviews application and
supports Applicant in
building a case for the
project
recommendations
Revised application
Applicant
Revises application and
provides additional
information
Applicant
Submits revised
application
Case Developer
Reviews application
Issues recommendation
Peer Review
Discuss application and
issue recommendation
Peer review might recommend further development
Board
Receives and considers
case details
Board
Takes decision on the
case
Requires revision/
more information
Case Developer
Applicant is informed of
unsuccessful application
Case Developer
Applicant is informed of
successful application
discourages
No override
no appeal
appeals
Appeals Assessor
decides upon appeal
Appeal upheld new CD assigned
denied
Case Developer
Sends out award letter,
signed by Regional
Director / member of
executive team
Applicant
decides within 2 month to
accept
Applicant
decides to appeal
Decision Manager
Finalises
recommendations
Applicant
exercise right
to override?
Chooses to override CD’s recommendation
Board
Decommitment
withdraws/
rejects offer
Applicant
Sends written
acceptance of the terms
of the grant
Case Developer
Agrees on extending the
acceptance period
Applicant
withdraws/
rejects offer
Actor
process
Application
unsuccessful
Pre-Application
Solicited application shortcut
Applicant / Project
System
Case Developer (CD)
Peer Review (PR)
Board (regional or
national)
Appeals Assessor
Finance
Actor and Process
Actor and Decision
Process flow
Figure 17.5: NAO example of a task-level flowchart of a grantmaking
processs
Source: NAO/RAND Europe (2008)
203.
RAND Europe 17:Process mapping
Figure 17.6: Benchmarking processes: NAO study on efficiency of grantmaking in
the culture, media and sports sectors
Source: NAO/RAND Europe (2008)
160
204.
PERFORMANCE AUDIT HANDBOOK
161
17.6 Summary
Process mapping has been shown in various
applications and studies to be a very useful
research tool and methodology. It is particu-larly
useful for visualising a process, increas-ing
understanding of complex processes and
developing a shared understanding of the
status quo.
Process mapping can also be used to show
inefficiencies and potential for improvement,
in particular if combined with further analysis
techniques.
Conducting a process mapping exercise
can, however, be resource-intensive and slow.
To justify potentially large expenses, it is thus
essential to embed process mapping in a well-thought-
through research strategy.
17.7 Further reading
Ad Esse Consulting, Value Stream Mapping,
London, 2007. As at 6 October 2009:
http://www.idea.gov.uk/idk/aio/6329981
Cheung, Y. and J. Bal, “Process analysis tech-niques
and tools for business improve-ments”,
Business Process Management Jour-nal,
Vol. 4, No. 4, 1998, pp. 274-290.
Collins, P., “Using process mapping as a qual-ity
tool”, Management Services, Vol. 41,
No. 3, 1997, p. 24.
Fenton, E.M., “Visualising Strategic Change:
The Role and Impact of Process Maps as
Boundary Objects in Reorganisation”.
European Management Journal, Vol. 25,
No. 2, 2007, pp. 104–117.
Leavengood, S. J. Reeb, Performance Excel-lence
in the Wood Products Industry –Statis-tical
Process Control – Part 4: Flowcharts.
Corvallis, OR: Oregon State University,
2002. As at 6 October 2009:
http://extension.oregonstate.edu/catalog/
pdf/em/em8772-e.pdf
Lee, R.G. B.G. Dale, “Business Process
Management: A Review and Evaluation”,
Business Process Management Journal, Vol.
4, No. 3, 1998, pp. 214–225.
Office of Government Commerce, Category
Management Toolkit – Process Mapping,
London, 2006. As at 6 October 2009:
http://www.ogc.gov.uk/documents/Proc
ess_Mapping.pdf
Strategos, Strategos Guide to Value Stream
Process Mapping. How to Do It What to
Do with It, Kansas City, MO, 2009. As at
6 October 2009:
http://www.strategosinc.com/vsm_map
ping_guide.htm
Walsh, S., Making Change Happen, Business
Transformation Programme – Business Proc-ess
Mapping (BPM) – a Guide for Sedgefield
Borough Council’s Modernisation Taskforce.
Spennymoor, UK, 2006. As at 6 October
2009:
http://www. b i p. rcoe.gov. u k / rc e /
aio/48988
Yourdon, E., Just Enough Structured Analysis,
New York, 2006. As at 6 October 2009:
http://www.yourdon.com/jesa/jesa.php
205.
RAND Europe 18:Quantitative techniques in performance audit
CHAPTER 18
162
Quantitative techniques in
performance audit Alaa Shehabi
18.1 Key points
Quantitative analysis uses data to test a
theory, or estimate the relation between
a set of variables through an econometric
model.
Econometric modelling can take a
macroeconomic or microeconomic
dimension; more recent approaches try to
combine aspects of both.
Choice of method and availability and
robustness of data are important factors
in successful quantitative modelling.
18.2 Defining quantitative methods
The common distinction in evaluation
research is between quantitative and qualita-tive
techniques. Increasingly these methods are
seen as complements rather than substitutes,
and combining both types of techniques to
triangulate the research is considered to be
good practice.
The drawbacks of qualitative research –
difficulty in drawing generalisations from find-ings,
low possibility of independent verification
and subjectivity – make it preferable to check
if empirical models can be used to quantify the
identified impacts. It is important to note that:
“Firstly, not everything that can be quantified is
important. Secondly, not everything that is being
quantified at present should be, if this cannot
be done robustly. Finally, not everything that is
important can be quantified: rigorous qualitative
research will still be needed for a thorough assess-ment”
(Mindell et al., 2001). Overall, a mixed
method approach to evaluation, which utilises
both quantitative and qualitative approaches,
is preferable (Rao and Woolcock, 2004).
Quantitative methods are therefore an
important part of the armoury of evaluation
tools used to assess the systemic and dynamic
impacts of policy interventions. Quanti-fied
assessments are necessary for economic
appraisal or for other explicit trade-offs: some
policymakers may give more weight to those
outcomes that can be measured (such as traffic
levels or estimates of deaths caused by injuries)
than to qualitative statements (such as ‘‘access
to healthcare will be impeded’’) (Joffe and Min-dell,
2005).
There are many types of quantitative meth-ods,
and they span the statistical, mathemati-cal
and econometric disciplines. For evaluation
purposes, we are interested in methods and
techniques that allow us to empirically assess,
validate and evaluate the impacts of a policy
intervention, often over time and across popu-lations.
Econometric modelling is one of the
main quantitative methods employed to do
this. Econometric models use empirical data
drawn from primary or secondary sources, to
test credible theories of causality. They can be
dynamic, ie associated with the understanding
of how economic, institutional, social, politi-cal
and environmental sub-systems interact
and evolve over time. Models can be used to
extrapolate to the future, or to generalise to
other settings.
But causal analysis can pose significant
methodological challenges that require inno-vative
techniques to address them. At best
we can only estimate causal effects rather
206.
PERFORMANCE AUDIT HANDBOOK
163
than measure them. For example, the fall in
childhood head injuries following compul-sory
cycle helmet legislation in Australia was
at least partly due to decreased cycling rather
than to the mechanical protection of helmets.
Thus, some health benefits of cycling for the
population were lost because of the legislation
(Mindell et al., 2001). This poses challenges
when trying to estimate the overall effects of
the intervention.
A model that can establish cause, effect and
the direct impact of the intervention would
provide the strongest robust evidence; how-ever,
in practice, given the difficulty of tracing
and attributing effects, this may be difficult to
do. Often, empirical research cannot establish
causation and can only establish significant
relationships, correlations and associations
among variables. One important point to note
is that the analysis may need to consider the
financing of policies, where the impact of the
chosen means of funding must be taken into
account. The same is valid for policies trigger-ing
expenditure in the private sector, as this
might be endogenous to the model itself.
Many of the methodological advances in
causal quantitative analysis over the last two
decades have been in the field of programme
evaluation of labour policies; however, other
fields have developed quantitative methods
specific to their needs, eg quantitative health
impact assessments (HIAs) used in public
health and valuation analysis used in transport,
among others. We have tried to find a general
approach that spans disciplines.1
1 We will not discuss the technical aspects of carrying
out econometric analysis. The following econometric
techniques can be employed in a combined approach as
needed; matching, instrumental variables, difference in
differences and natural experiments, randomised control
trials, estimating structural economic models. These
approaches either try to estimate the actual direct impact
of policy or try to understand the mechanism of how and
why things work in the system as a whole. The use of eco-nomic
models is thus more ambitious in that it attempts to
Box 18.1: Causality and the notion of
ceteris paribus
The objective of the audit evaluation will
often be to infer the causal effect of one
variable (eg education, skills and training) on
another variable (eg employment). We should
never forget that Association ≠ Causation. The
notion of ceteris paribus (latin for “all other
things being equal”) plays an important role
in scientific inquiry and, specifically, in most
economic questions. For example, in analys-ing
demand for housing we are interested in
knowing the effect of changing house prices
on the quantity of housing units demanded,
while holding all other factors – such as
income, cost of mortgages, and employment
– fixed. The key question in most empirical
studies is: Have enough other independent
factors been held fixed to isolate the depend-ent
variable and therefore make a case for
causality? In most realistic applications, the
number of factors that can affect the variable
of interest, such as wages or crime rates, is
very large and the isolation of any particular
variable may seem impossible. However, we
can still simulate a ceteris paribus experiment
with a well-designed application.
18.3 The range of quantitative
techniques
Econometric modelling can take a macr-oeconomic
or a microeconomic dimension,
although more recent approaches try to com-bine
aspects of both. Different audit bodies
focus on and tend to use different models.
The NAO tends to approach the value-for-
money question with microeconomic
models when evaluating direct and specific
address the underlying mechanisms.
207.
RAND Europe 18:Quantitative techniques in performance audit
impacts, rather than relating the intervention
to bigger impacts such as social welfare and
other aggregate factors that would require a
macroeconomic approach. For example, the
NAO evaluated the Skillseekers Training for
Young People (National Audit Office, 2000)
and, through quantitative regression analysis,
concluded that the underlying market failure
rationale for Skillseekers was valid – that the
labour and training markets for young people
could be made to operate more effectively.
18.3.1 Macro models
Macro models describe the operation of a
national or regional economy, and especially
the dynamics of aggregate quantities such as the
total amount of goods and services produced,
total income earned, the level of employment
and the level of prices (Wikipedia, n.d.). They
use input factors (such as labour and capital)
for a production model to look at issues like
maximising social welfare, assessing the oppor-tunity
164
cost of publicly funded services or the
management of the macroeconomy itself. The
most important elements of macro models
are:1
Data requirements: aggregated data
from national accounts or sector level
information.
Good for: evaluating large, economy-wide
policies expected to have spillover
effects and economic impacts, and where
the performance indicators that represent
tangible effects are clearly measured and
specified.
Bad for: specific local or regional policies
that are differentiated across the country.
When given, expected effects attributable
to specific initiatives are likely to be very
small when compared with the total effort
1 See European Commission (2009) Impact Assessment
Guidelines for more details.
invested by the whole economy; general
aggregate models are unlikely to be useful
for the impact assessment of specific
policies (eg impacts of RD policy).
Strengths: capable of assessing the
impact on output, overall employment
or employment by sector or region, price
levels, productivity.
Weaknesses: the process of model
development is data- and resource-intensive
and may miss the complexity
of interactions and changing dynamic
relationships that link the programme
inputs with relevant outcome indicators.
If building a system model, the process
requires large, long-term data sets
covering many different indicators. These
could only be developed at great cost.
Simpler, more general macroeconomic
models, eg relating RD investments
with growth, would suffer from the
“black box” syndrome: we can conjecture
that a relationship exists, but we cannot
identify the mechanisms through which
the possible impact has taken place.
Examples of macro models that measure social
impacts are:
computable general equilibrium models
(CGE)
partial equilibrium models
sectoral models
macro-econometric models.
Computable general equilibrium (CGE)
models
CGE models calculate a vector of prices such
that all the markets of the economy are in
(demand and supply) equilibrium, implying
that resources are allocated efficiently. CGE
models try to capture all economic and tech-nological
interrelationships, possibly reflecting
policy influences on prices, multiple markets
208.
PERFORMANCE AUDIT HANDBOOK
165
and interacting behaviour of economic agents
(consumers/ workers/ businesses). They are
based on economic theory and theoretical
coherence (that is, the Walrasian representa-tions
of the economy). Therefore, parameters
and coefficients are calibrated with math-ematical
methods and not estimated, as in
econometric modelling. They can be static –
comparing the situation at one or more dates –
or dynamic, showing developments from one
period to another. CGE models require a social
accounting matrix that is built by combining
input–output tables (to model interrelations
between productive sectors) with national
account data.
Strengths:
They are good for analysing general
economic policies like public finance,
taxation and social policy, and their
impact on longer-term structural change.
They have internal consistency; ie they
allow for consistent comparative analysis
of policy scenarios by ensuring that in all
scenarios the economic system remains in
general equilibrium (however, extensions
to model market imperfections are
possible).
They integrate micro-economic
mechanisms and institutional features
into a consistent macro-economic
framework. All behavioural equations
(demand and supply) are derived from
microeconomic principles.
They allow for the evaluation of
distributional effects across countries,
economic sectors and agents.
They consider feedback mechanisms
between all markets.
Data requirements are limited; since CGE
models are calibrated to a base year data
set, data requirements are limited even if
the degree of disaggregation is high.
Weaknesses:
The two main theoretical weaknesses
in econometric analysis based on CGE
modelling relate to the validity of two key
assumptions: the neoclassical concepts
of optimisation and rationality of
individuals and the general equilibrium
assumption based on market clearing.
This is a somewhat tautological
construction (all results are implicitly
linked to the assumptions and calibration
made). The result is that CGE models
are complex, and results are often
highly sensitive to model structure and
hypothesis.
CGE models typically lack a detailed
bottom-up representation of the
production and supply side. Since top-down
models rely on the assumption
that all best available technologies have
already been installed, the calculated
cost of, for instance, a specific emission
reduction measure is typically higher than
in bottom-up studies.
A CGE model can take a significant amount of
time and expertise to build and develop. There
are many globally integrated CGE models that
have been constructed by various national and
international organisations such as the EC,
IMF, the Bank of England and other research
institutes.1 An example of a freely avail-able
model (International Futures, n.d.) is the
International Futures model, which covers ten
building blocks, as illustrated in Figure 18.1.
1 Examples of global CGE (computable general equi-librium)
models: NEMESIS, ERASME, MULTIMOD,
QUEST, NiGEM, Oxford World Macroeconomic Model
and the BAK Oxford New IIS(NIIS) Model; GEM E-3
Model, International Futures System (IFS). Examples of
EU-funded CGE models: EDGE; GEM-CCGT; GEM-E3;
OECDTAX; PACE; WORLDSCAN.
209.
RAND Europe 18:Quantitative techniques in performance audit
166
%
Figure 18.1:Building blocks of the International
Source: University of Denver website1
1 http://www.ifs.du.edu/introduction/elements.aspx .
Accessed June 2009
223.
PERFORMANCE AUDIT HANDBOOK
167
l Futures CGE model
Sectoral/partial equilibrium models
When the effects of the policy are quite cir-cumscribed
to a specific sector (eg transport) or
sub-defined system, and the general impact on
the economy (feedback and spillover effects) is
negligible, a partial equilibrium approach may
be a better way for the goal of evaluation. These
models are constructed on the equilibrium of
one specific sector of the economy.1
Strengths:
They focus only on one economic
sector and thus enable a relatively high
degree of disaggregation and a detailed
representation of the specific economic
and institutional factors.
Sectoral models are often very detailed
since they are sometimes complemented
by more specific (eg engineering-economic)
bottom-up models. The latter
are advantageous since they, for example,
are able to handle nonlinearities.
Weaknesses:
An inability to capture the effects on
other markets and the feedback into the
specific market under consideration.
Macroeconometric models
Macroeconometric models are designed to
evaluate macro-sectoral impacts of economic
policies, although they have been extended
to incorporate environmental dimensions,
human and social capital. 2
1 Examples of EU funded sectoral models. En-ergy:
PRIMES, POLES, SAFIRE. Transport: ASTRA,
EXPEDITE, SCENES, TREMOVE, TRANSTOOLS,
Agriculture: CAPRI. Emissions Trading: SIMAC.
2 Examples of EU funded macro-econometric models:
E3ME; NEMESIS; QUEST II; WARM.
Strengths:
The validation of the equations of the
model with statistical methods.
The model’s ability to provide short- to
medium-term forecasting and to evaluate
the impact of policies.
These models also ensure a coherent
framework for analysing inter-linkages
between variables.
Weaknesses:
Difficulty in capturing longer-term
phenomena, since the equations on which
they are based are linked to a given time
framework.
The degree of sectoral disaggregation
is usually smaller than in calibrated
CGE models due to extensive data
requirements.
Behavioural assumptions do not always
rely on microeconomic theory.
18.3.2 Micro models
Micro models investigate and test assumptions
about economic agents, their decisions, and
interactions (individuals, households, firms/
businesses) and how these affect supply of and
demand for goods and services. It can answer
questions such as: How frequently should
screening for breast cancer be offered? What
are people willing to pay for a better train serv-ice?
Does a new road offer sufficient savings
of time and reduction of accidents to justify
its cost?
Data requirements: disaggregated data
or microdata, such as survey data from
individuals, households or firms.
Good for: evaluating the efficiency-specific
policies that are designed to affect
individual, household or firm behaviour
(eg minimum wage or travel choices),
or where the policy impact is limited to
a particular group, sector or region (eg


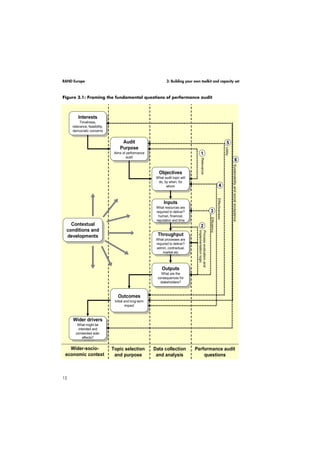
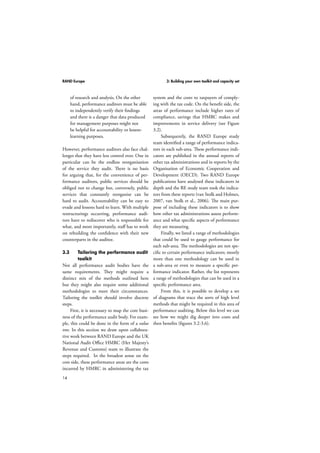
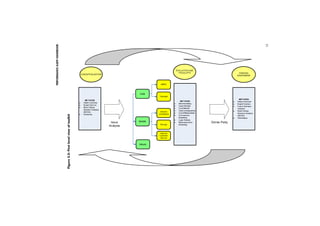
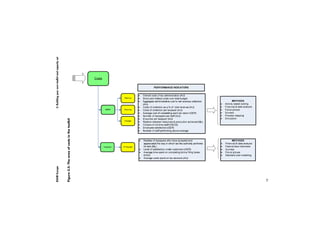
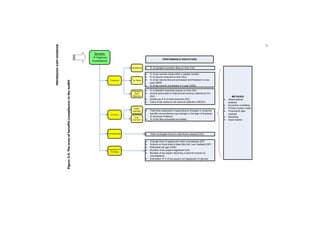
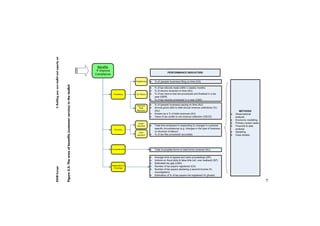
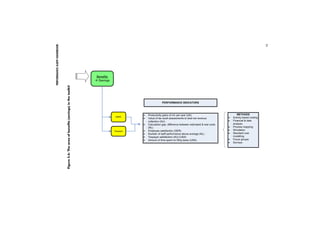

![PERFORMANCE AUDIT HANDBOOK
21
CHAPTER 4
Benchmarking Philip-Bastian Brutscher
4.1 Key points
Benchmarking is a method of comparing
performance or processes across and
between organisations, policies or policy
systems, and across or between countries.
Benchmarking in the public sector is used
to identify and learn from best practice.
Benchmarking follows a five-step
procedure, and is an iterative process.
4.2 Defining benchmarking
The traditional definition of benchmarking is
“the continuous process of measuring [outputs
and processes] against the toughest competitors
[…]”. We expand that to describe benchmark-ing
as a way of comparing outcomes, processes
or systems. The core idea is to learn through a
structured process of comparison.
Benchmarking originated in the private
sector in the 1980s, when the Xerox Corpora-tion
realised they had to study their competi-tors
to find out why they were losing market
share. The disturbing results led to the com-pany
adopting a systematic process of compar-ing
factual data across a range of performance
dimensions (How big is the gap?) and practices
or processes (What are they doing differently
– and better – than us?). The impact of this
approach on Xerox is widely held to have been
critical, not least because it warned “of a crisis
before that crisis actually overtook and inca-pacitated
the firm” (Bessant and Rush, 1998).
The main objectives of using benchmark-ing
in the public sector context are:
to get a general idea of what is being
done, how and with what outcome across
different public sector organisations/
policies/policy systems
to compare the specific performance/
processes of certain public sector
organisations/policies/policy systems
to generate ideas of what can be done,
how and with what outcomes.
There are several types of public sector bench-marking,
the most prominent being:
performance benchmarking, which
compares the performance (in terms
of outputs and outcomes) of different
entities and assesses whether they
make efficient and effective use of their
resources compared to similar entities
process benchmarking, where the
processes and procedures of entities that
are likely to lead to different outputs and
outcomes are analysed and compared
domestic benchmarking, which compares
the performance and/or processes of
similar entities within one country
international benchmarking, which
compare entities from different countries.
Another way of looking at benchmarking
is in terms of the subject of the evaluation.
Groenendijk (2004) distinguishes between the
benchmarking of public sector organisations,
public policies and policy systems, and points
out that the focus of benchmarking public
sector organisations is typically on processes
and/or outputs, whereas benchmarking public
policy is concerned with policy outcomes
(such as economic growth, unemployment,
etc). The main difference between benchmark-ing
public policies and benchmarking policy
systems is that policy systems deal with a
multitude of policy outcomes, whereas policy](https://image.slidesharecdn.com/performanceaudithandbook-141017113305-conversion-gate01/85/Performance-audit-handbook-36-320.jpg)
![RAND Europe 4: Benchmarking
benchmarking typically involves a single set of
coherent policy outcomes.
4.3 When to use benchmarking and
22
when not to use it
Benchmarking is applicable in any situation
where separate entities or activities need to be
compared in order to identify and learn from
best practice. The key question is what type of
benchmarking is most appropriate, and will
yield the most useful information.
4.3.1 Performance vs process
benchmarking
The question of whether to use performance
or process benchmarking depends largely on
the objective of the evaluation. If the objec-tive
is to compare the overall performance of
similar organisations/policies/policy systems,
then performance benchmarking is the more
appropriate choice. If, on the other hand, in
the objective is to examine and compare stand-ard
processes (such as the way complaints are
handled), process benchmarking is a better
method.
However, evaluation objectives are not the
only consideration when deciding between
performance and process benchmarking.
Another factor is the complexity of the out-come
being benchmarked – the more compli-cated
the outcome, the less likely it is that we
can rely on standards or results benchmarking
alone, and the more important it is that we go
into the process or processes that contribute to
performance. For instance, while it may be dif-ficult
to benchmark illiteracy, it is far easier to
benchmark the performance of public librar-ies.
Similarly, it is easier to benchmark dif-ferent
organisations involved in conventional
training than to benchmark unemployment.
4.3.2 Domestic vs international
benchmarking
The main reasons for using international com-parators
include:
a lack of similar domestic comparators
evidence of exceptional international
examples (in terms of performance/
processes)
the goal of the benchmarking exercise
being to generate ideas of what can be
done, how and with what outcomes.
There are a number of potential problems
with international benchmarking. One is
that, whereas the institutional environment
in which the different units operate in domes-tic
benchmarking is identical or similar, the
same cannot be claimed for international
benchmarking. As a result, the findings from
an international benchmarking exercise must
be analysed more carefully and implications
should be drawn with caution.
Another potential problem of inter-national
benchmarking is that it requires
greater attention to data issues than domestic
benchmarking, since “definitions, concepts,
ways of data collection differ largely between
... countries (notably between the US, Japan
and Europe)” (Polt et al., 2002). This problem
is aggravated by the fact that internationally
comparable statistics are not available for most
processes underlying the development of per-formance.
One implication, therefore, is that
international benchmarking must aim at being
cooperative. In cooperative benchmarking, the
parties involved exchange first-hand informa-tion
with the aim of mutually beneficial learn-ing.
In competitive benchmarking, on the
other hand, one is often restricted to secondary
sources of information and statistics. Polt et al.
(2002) find that “[c]ountries often hesitate to
enter benchmarking exercises if they fear to be
ranked in league tables”.](https://image.slidesharecdn.com/performanceaudithandbook-141017113305-conversion-gate01/85/Performance-audit-handbook-37-320.jpg)


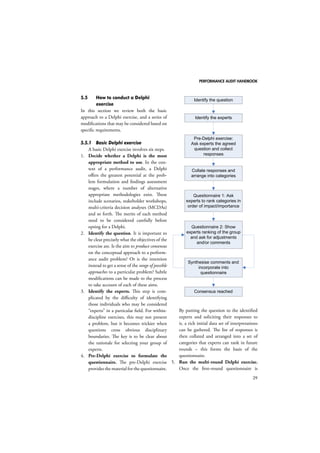


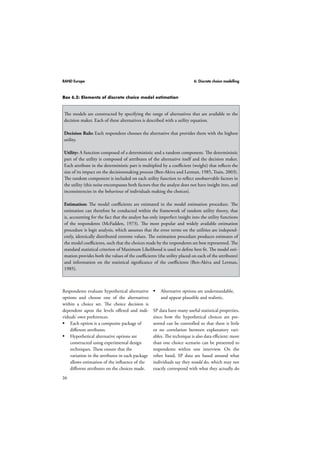
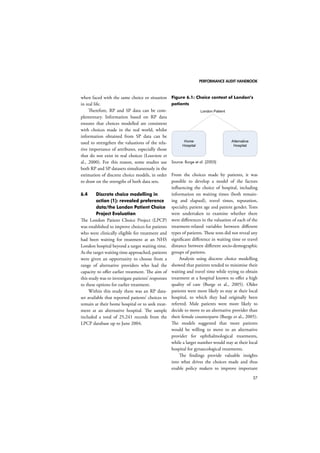

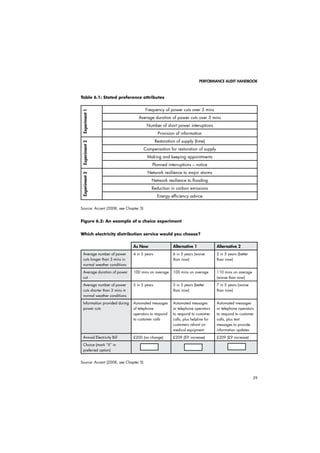


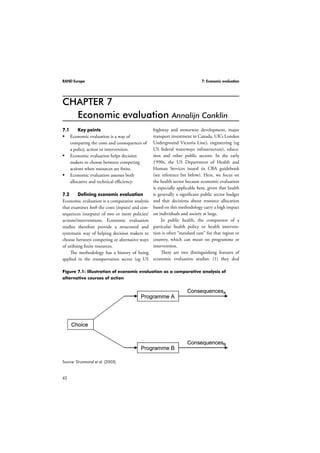


![RAND Europe 7: Economic evaluation
Box 7.1: The same economic evaluation
technique can produce different ratios
48
Suppose a healthcare programme had costs and consequences as
follows:
Costs Consequences
C1 healthcare costs health improvement
$1,000,000
C2 costs in other U (in preference scores) 10 QALYs
sectors $50,000
C3 patient/family W (willingness-to-pay) $2,000,000
resources $5,000
C4 lost productivity S1 healthcare savings $25,000
$100,000
S2 savings in other sectors $20,000
S3 savings in personal resources
$12,000
S4 savings in productivity $100,000
V (other value created) $0
The following ratios could be calculated:
1. Cost-utility ratio (healthcare resources only)
(C1 – S1) / U = $75,000 per QALY
2. Cost-utility ratio all resources used)
(C1 + C2 + C3 + C4 – S1 – S2 – S3 – S4) / U = $77,300 per QALY
3. Benefit-cost ratio (including all consequences in the numerator as
benefits)
[(W + S1 + S2 + S3 + S4) / (C1 + C2 + C3 + C4)] = 2.163
4. Benefit-cost ratio (treating resource savings as cost-offsets deducted from
the denominator)
[W / (C1 + C2 + C3 + C4 – S1 – S2 – S3 – S4)] = 2.587
Source: Drummond et al. (2005), p. 22](https://image.slidesharecdn.com/performanceaudithandbook-141017113305-conversion-gate01/85/Performance-audit-handbook-63-320.jpg)


![RAND Europe 8: Focus group interviews
Suppose, for example, that a department
within an organisation wants to revamp its
employee review process, in which employees
currently meet with their supervisors once a
year for a performance review. The organisa-tion
56
wants to identify what aspects of the
review process are relevant to work quality.
Using Krueger’s framework, possible questions
for a focus group with current employees in
the department might include those shown in
Table 8.1.
Table 8.1: Five types of questions and
examples
Question Type Example
Opening
question
Tell us your name and
how long you have been
with the company.
Introductory
question
How are you currently
given feedback about
your work?
Transition
question
How do you feel about
this?
Key question How would you
characterise helpful
feedback from your
supervisor?
Key question How would you
characterise helpful
feedback from your co-workers?
Key question How are these kinds of
feedback reflected in
your annual review?
Key question What affect does the
current structured review
process have on how
you do your job?
Key question What affect does
the current structured
review process have
on your professional
development?
Key question Which features of the
review process are
particularly useful to
you?
Key question Which features of the
review process are
particularly unhelpful to
you?
Ending question Suppose you were in
charge, what changes
would you make to the
current review process?
Ending question [Offer a brief summary
of the key questions.] Is
this summary accurate?
Ending question The goal of this focus
group was to explore
what you think about
the employee review
process. Have we missed
anything?
Notice that none of these example questions
asks “Why?” Questions beginning with “Why”
may make participants feel that they are
required to justify, on the spot, their views or
behaviours, making them defensive to further
prompts. Instead, questions should focus on
attributes (ie, characteristics and features of the
programme or practice), as well as influences
(ie, the impetus of a practice or programme).
For example, instead of asking participants
“Why is the review process unhelpful to you?”
the moderator can ask “What features of the
review process are unhelpful to you?” or “How
does the review process inhibit your work?”.
Although the difference appears small, the
“What?” and “How?” questions help set the
participants at ease (Krueger, 1998). In gen-eral,
focus group questions should be clear (ie,
jargon free and worded in such a way that they
will not be interpreted in different ways by the
different participants), unbiased (ie, not favour
one particular kind of response over another),](https://image.slidesharecdn.com/performanceaudithandbook-141017113305-conversion-gate01/85/Performance-audit-handbook-71-320.jpg)
![RAND Europe 8: Focus group interviews
in the protocol for the focus group discussions
included:
1. Please take a turn and tell us briefly your
58
age, rank, and how long you’ve been in the
service. [Moderator and Notetaker. Record
left participant as 1 and number partici-pants
clockwise.]
2. How did you become interested in a career
in the Armed Forces? Probe to clarify the
most important reasons. Prompt if necessary:
a. In a previous study we were
told that travel, friends and family
influence, or job security were factors.
Which of these were important to
you, or was there another reason?
[Moderator, if necessary, attempt
to differentiate between childhood
aspirations and the more deliberate
step of considering employment.]
3. What made you finally decide to join
the Armed Forces? Probe to clarify the
most important reason. [Moderator and
Notetaker: In this and subsequent questions
record, when appropriate, whether partici-pants
individually or collectively show con-currence
I, dissension (D), or argument (A)
with any noted comments.]
4. Did you consider any of the other services?
If so, which ones and why?
5. Thinking about what you were told
during the application process, perhaps by
recruiters, how does the reality of Service
life compare? Does anything stand out as
being particularly different to that which
you were expecting? Probe (if necessary):
a. Were you prepared for the discipline
expected in basic training?
b. Did you receive enough information
about the physical demands of
Service life?
6. Some of you mentioned [FEEDBACK]
as reasons for joining. Now that you have
been in for a short while, what do you
see as the positive aspects to being in the
Armed Forces? Are there other benefits or
rewards?
7. What are the negative aspects to being in
the Armed Forces?
8. What factors are influencing or will influ-ence
your decision on whether to stay in
the Armed Forces? Prompt (if necessary):
a. Perhaps you have always intended to
leave at your first break point?
b. Or you want reach specific
professional goals that will take time?
c. Are finances a consideration?
d. Career options outside the military?
e. Family issues/dependents?
9. [Notetaker record particularly any partici-pants
who specifically mention child educa-tion
allowances (possibly as CEA or BSA)
and the context of their comments.]
10. As I mentioned at the beginning, this is
a review of the impact of pay and allow-ances.
With that in mind what do you
think about the levels of your current pay,
future pay and your allowance package?
11. [Preamble from SP(Pol) regarding the recent
operational pay announcement – a sentence
up to a short paragraph to set the scene, eg It
has recently been announced that members
of the Armed Forces deployed to Afghanistan
and Iraq will be paid additional money.]
12. Does this make operational deployments
more attractive? How will it affect you if
you are not deployed? Probe:
a. Would deployment pay influence
your decision to stay in the Armed
Forces?
b. Would you accept more frequent
deployments so long as you received
the additional deployment pay?
13. How do you think being in the Armed
Forces will affect your decision to buy a
home? [Moderator: consider the oral answers
to previous questions to challenge answers.](https://image.slidesharecdn.com/performanceaudithandbook-141017113305-conversion-gate01/85/Performance-audit-handbook-73-320.jpg)
![PERFORMANCE AUDIT HANDBOOK
59
For example, look for contradictions between
intended time in service, purchase aspirations
and the answers offered to this question.]
Prompt:
a. Do you think job security will help
with your house purchase?
b. Would you want to live in your new
home?
c. How do you think the demands
of service life will affect home
ownership?
14. What message would you like to convey to
the leaders and policymakers in the Armed
Forces?
8.6 Summary
Focus groups are far more structured and pre-pared
than many people expect. Simply sitting
down with a few people and asking for their
opinions will be of little benefit to an auditor.
Participants in a focus group must be carefully
selected, the questions and their sequence
prepared well in advance, and the moderator
should be skilled at asking the right questions
in the right way. Useful information is only
revealed once the notes and transcripts of the
focus group interviews have been analysed in
detail.](https://image.slidesharecdn.com/performanceaudithandbook-141017113305-conversion-gate01/85/Performance-audit-handbook-74-320.jpg)


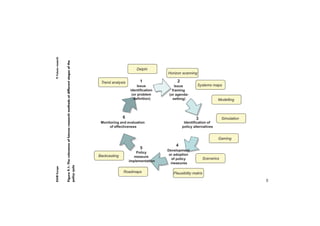
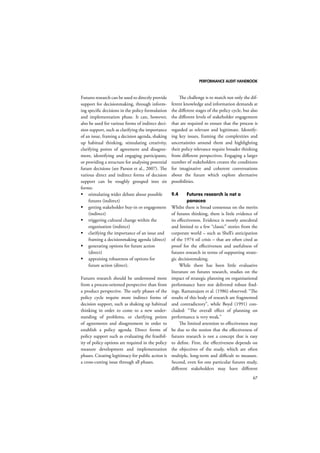


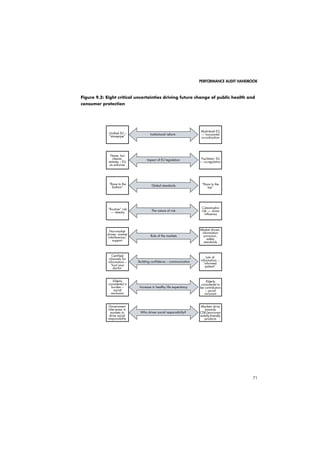

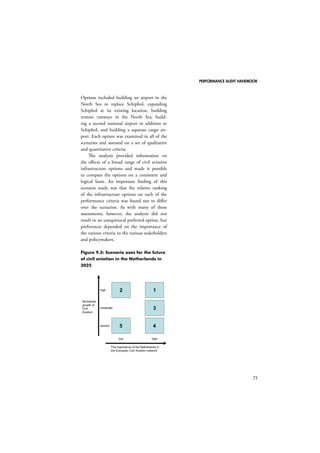


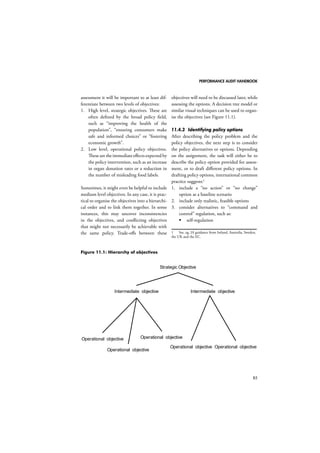
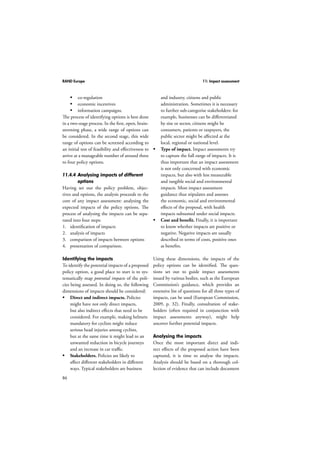


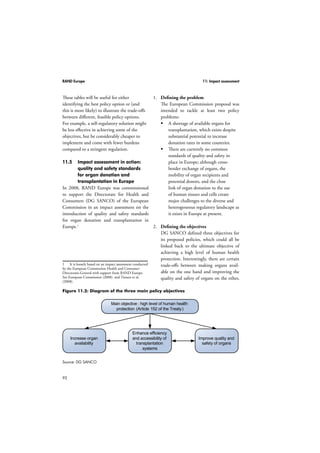


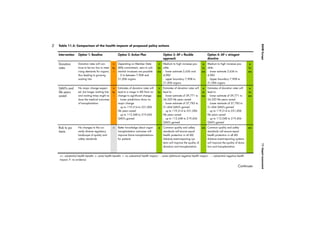
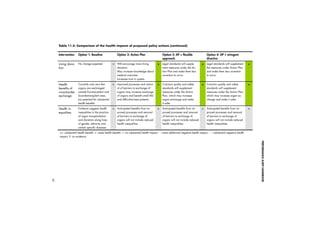


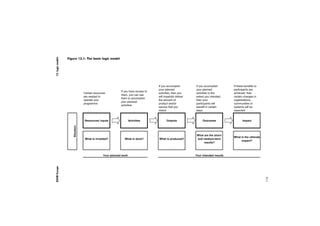


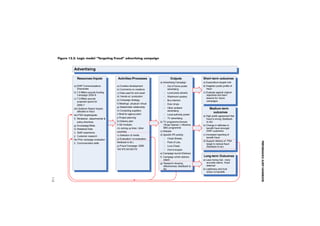
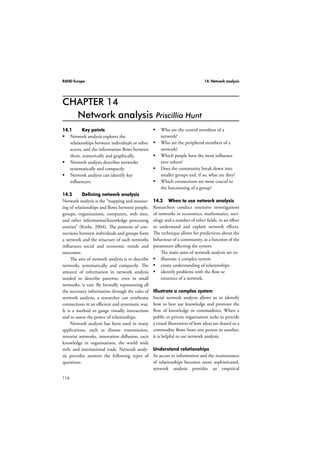

![RAND Europe 11: Impact assessment
Table 11.4: Benchmarking the policy option against the Spanish model
Key element
94
Option 1:
Baseline
Option 2: Action Plan
Option 3:
AP + flexible
approach*
Option 4: AP
+ stringent
directive*
Transplant
coordinators and
coordinating
teams in each
hospital
Variable
within and
across MS
All MS to “promote
the role of transplant
donor coordinators in
hospitals”
All MS to
“promote
the role of
transplant donor
coordinators in
hospitals”
All MS to
“promote
the role of
transplant donor
coordinators in
hospitals”
Reimbursement
of hospitals
to recover
procurement costs
Variable
across MS
Not contained in policy
option
Not contained in
policy option
Not contained
in policy option
A quality
assurance system
(or programme)
in all autonomous
communities, with
two stages of
evaluation
Variable
within and
across MS
All MS to (1) “[p]romote
quality improvement
programmes in
every hospital where
there is a potential
for organ donation,
which is primarily a
self-evaluation of the
whole process of organ
donation, aiming
to identify areas for
improvement”; and (2)
“evaluation of post-transplant
results”
Legal mandate
for (1) quality
programmes,
including quality
systems and
quality standards
in all MS; and (2)
inspections and
control measures,
subject to MS
decisionmaking/
implementation
Legal mandate
for (1) quality
programmes,
including
quality systems
and quality
standards in
all MS and
(2) inspections
and control
measures,
directed by the
EU Commission
Adequate training
for transplant
coordinators and
personnel involved
in organ donation
and procurement
Variable
within and
across MS
Promotion of the
Implementation of
effective training
programmes for
transplant donor
coordinators
Legal mandate
for personnel/
training in all MS,
subject to MS
decisionmaking/
implementation
Legal mandate
for personnel/
training in all
MS, directed by
EU Commission
Public awareness
and proactive
management
of mass media
opportunities
Variable
within and
across MS
All MS to “[i]mprove
knowledge and
communication skills
of health professionals
and patient support
groups for organ
transplantation”
All MS to
“[i]mprove
knowledge and
communication
skills of health
professionals and
patient support
groups for organ
transplantation”
All MS to
“‘[i]mprove
knowledge and
communication
skills of health
professionals
and patient
support groups
for organ
transplantation”
*In addition, all actions foreseen under the Action Plan will be implemented.
MS = Member States; AP = Action Plan](https://image.slidesharecdn.com/performanceaudithandbook-141017113305-conversion-gate01/85/Performance-audit-handbook-133-320.jpg)
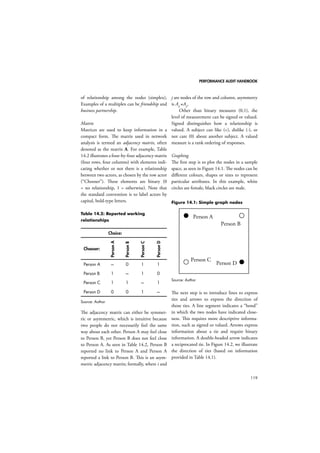
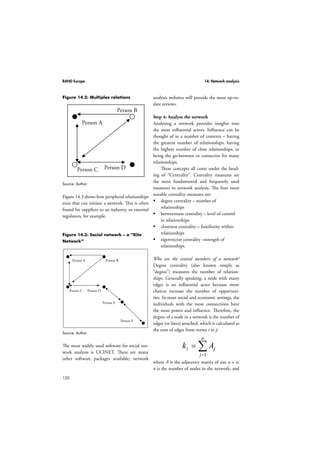

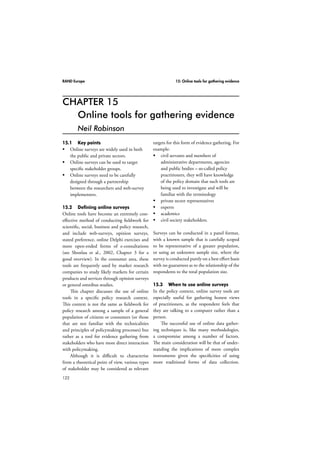

![RAND Europe 12: Key informant interviews
CHAPTER 12
100
Key informant interviews Aasha Joshi
12.1 Key points
Key informant interviews provide insight
into selected experts’ understanding of
the implementation, utility and efficacy
of a programme.
Key informant interviews require skilled
interviewers if they are to yield useful
information.
12.2 Defining key informant
interviews
Key informants are those people within an
organisation who have “specialized knowl-edge,
skills, or expertise” (McKernan, 1996,
p. 131). Thus interviewing key informants can
be a useful method for understanding the par-ticular
contexts in which programmes are (or
will be) implemented and how those contexts
may shape the depth and extent of programme
implementation within an organisation.
Although the information garnered from
key informant interviews cannot necessarily
be generalised to the organisation at large, it
allows interviewers access to in-depth percep-tions
which are not easily accessible through a
random selection of interview respondents.
Key informant interviews can provide gen-eral
descriptions of the process of programme
implementation, and can provide interview-ers
with particular insights into informants’
understanding of a particular problem or
programme, including a programme’s viewed
objectives, structure, implementation, utility
and different outcomes. In the course of the
interview, the informants will probably men-tion
various phenomena including their beliefs,
values, roles, experiences, behaviours, and rela-tionships
to others within an organisation, all
of which can be important in understanding
the area of investigation (Bryman, 2001, p.
319).
12.3 When to use key informant
interviews
Interviews with key informants are most
useful as a data collection method when the
research objective is to understand informants’
(possibly differing) views of a programme or
common setting, to document their experi-ences
in implementing a programme, or to
describe differing outcomes across people or
sites.
They are not as useful as a stand-alone
method when the primary research objective
is to measure outcomes across an entire setting
or programme, or to determine the cause or
effects of an implemented programme.
12.4 How to conduct key informant
interviews
Successful key informant interviews depend on
choosing the best way to ask questions for the
required research objective, and on the skills of
the interviewer in getting the most informative
and detailed answers to those questions.
Deciding how to ask interview questions is
contingent on why and about what the ques-tions
are being asked; the kinds of information
needed to answer the audit’s research questions
will determine how to collect relevant infor-mation
from the informants. To collect this
information, one of the goals for the interview
should be “to provide a framework [of ques-tions]
within which people can respond in a
way that represents accurately and thoroughly
their point of view about a programme”](https://image.slidesharecdn.com/performanceaudithandbook-141017113305-conversion-gate01/85/Performance-audit-handbook-139-320.jpg)
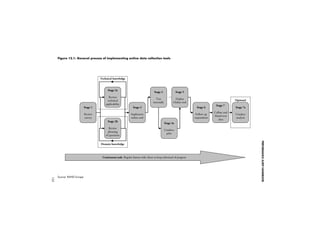
![RAND Europe 12: Key informant interviews
to Qualitative Research Interviewing. The
described prompts include introducing ques-tions,
102
probing questions, specifying questions,
direct questions, indirect questions, inter-preting
questions, structuring questions, and
silence. Each can be helpful to the interviewer
in patterning the interview into an informa-tive
data collection tool (rather than into an
exercise in desultory maundering).
Table 12.1: Types of interview prompts
Prompt Example
Introducing
questions
Interviewer: “What does
your role in the department
entail?”
Probing
(elaborating)
questions
Interviewer: “Can you say
something more about
that [referring to a specific
topic within the informant’s
response]?”
Specifying
questions
Key Informant: “It’s just not
helpful to people.”
Interviewer: “Have you
experienced that yourself?”
Direct
questions
Interviewer: “Are you
pleased with the quality
of the customer service
training?”
Indirect
questions
Interviewer: “How
are customer service
representatives trained in
the department?”
Interpreting
questions
Interviewer: “I want
to make sure I am
capturing what you are
saying. I have heard you
say [recapitulation of
informant’s responses]. Is
this a fair characterisation?”
Structuring
questions
Interviewer: “We’ve talked
a bit about [general topic],
and I’d like to introduce a
slightly different topic now.”
Silence Silence can provide the
informant the necessary
time to reflect and construct
a complete answer to a
question
Source: Adapted from Kvale (1996), pp. 133–135
Deciding when to use a particular prompt in
a semi-structured interview relies exclusively
on the discretion of the interviewer. Such dis-cretion,
in order to be exercised successfully,
assumes that the interviewer possesses several
particular qualities (Kvale, 1996). The effective
interviewer:
is gentle with informants, allowing them
to complete their sentences and answer
questions in their own timeframe
is critical, addressing inconsistencies in
the informants’ answers
is clear, asking simple, jargon-free
questions
is open, responding to themes noted as
important by the informant
is sensitive, attending and responding to
verbal and non-verbal cues given by the
informant
understands the purpose of the interview
and knows the overall study
structures an interview so that its purpose
and format are apparent to the informant
steers interviews to keep to their intended
purpose
remembers previous answers and refers to
them during the interview
summarises (without imparting meaning)
the informants’ answers by asking for
clarifying and confirming information
when needed.
Ideally, the qualified interviewer will ensure
that they ask the informant the sort of ques-tions
that will elicit the necessary information
to answer the audit’s overarching research](https://image.slidesharecdn.com/performanceaudithandbook-141017113305-conversion-gate01/85/Performance-audit-handbook-141-320.jpg)