The corporate presentation provides guidance for 2018, outlines 6-year production and cost targets, and discusses SEMAFO's exploration budget and plans. Key details include:
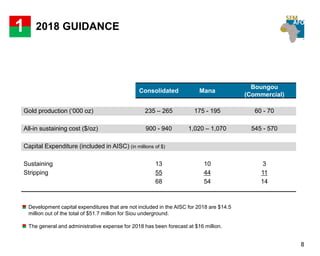
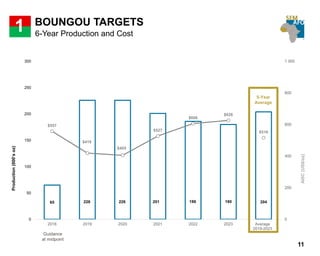
- 2018 guidance of 235-265koz of gold production at $900-940/oz AISC.
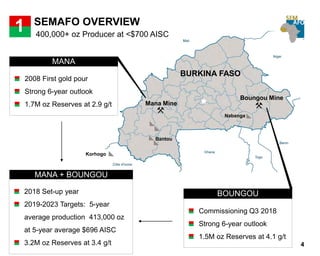
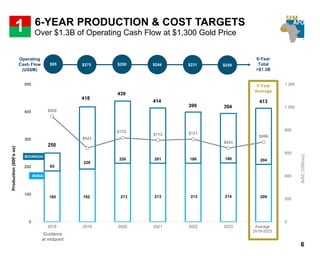
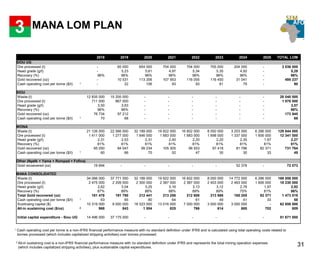
- 6-year targets of average annual production of 413koz at an average AISC of $696/oz.
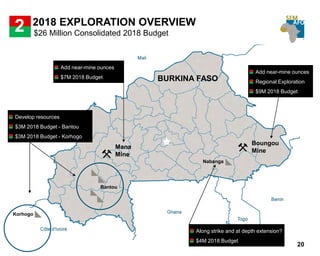
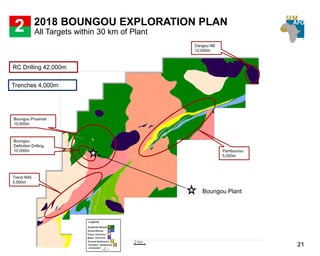
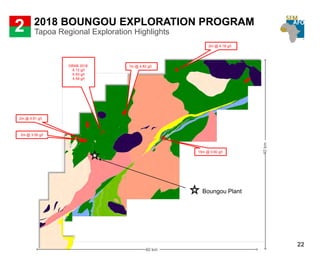
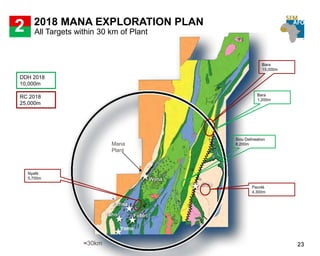
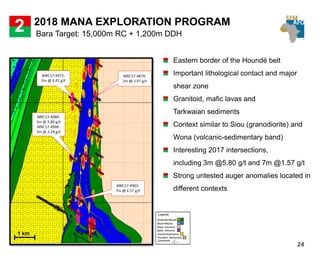
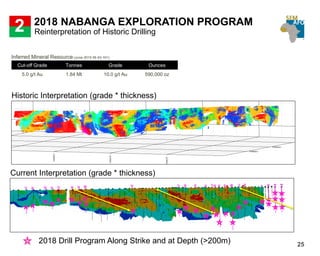
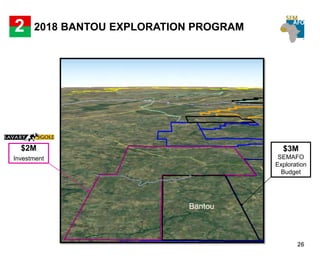
- $26 million consolidated exploration budget for 2018, focusing on near-mine targets and regional exploration in Burkina Faso.