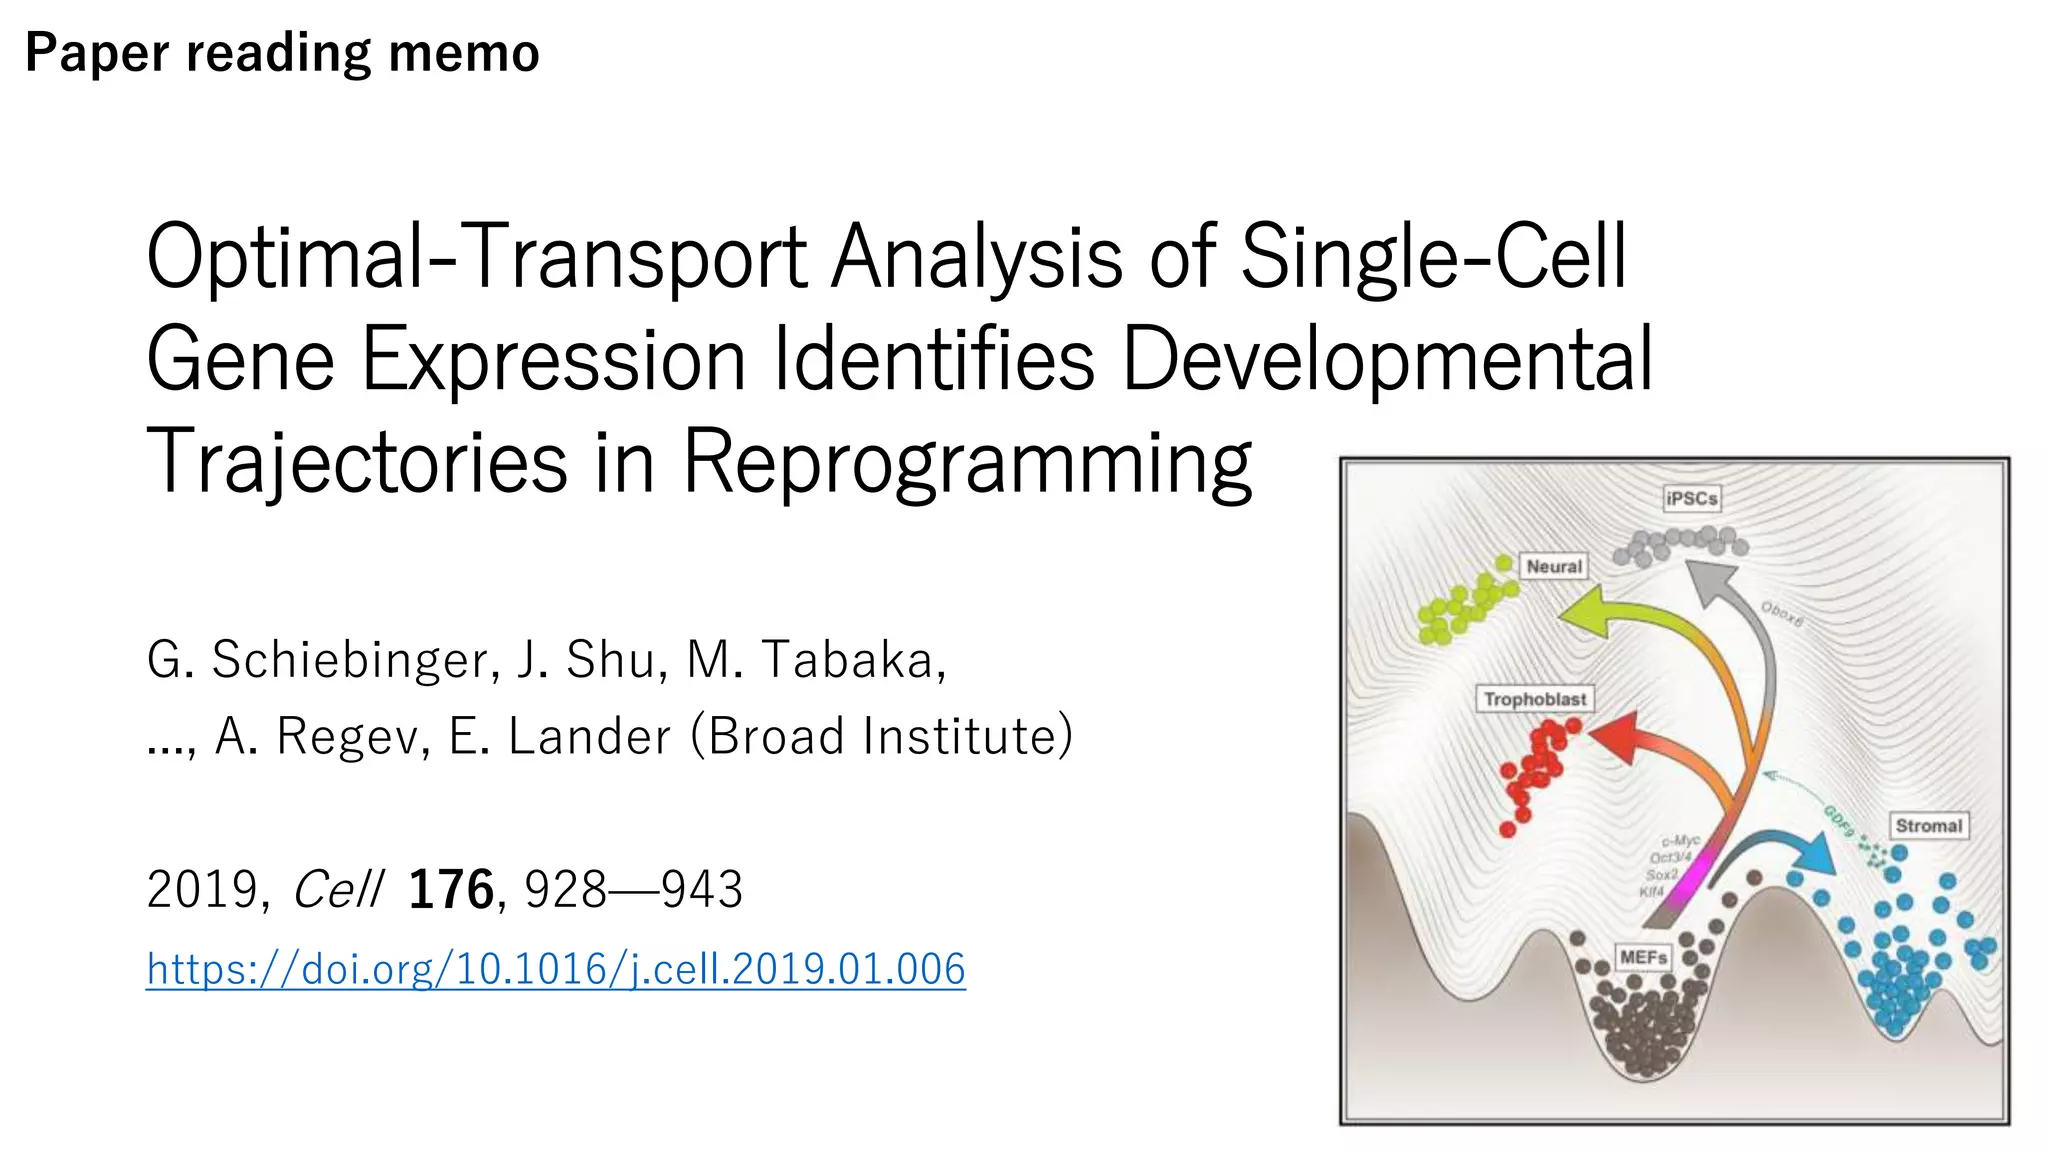
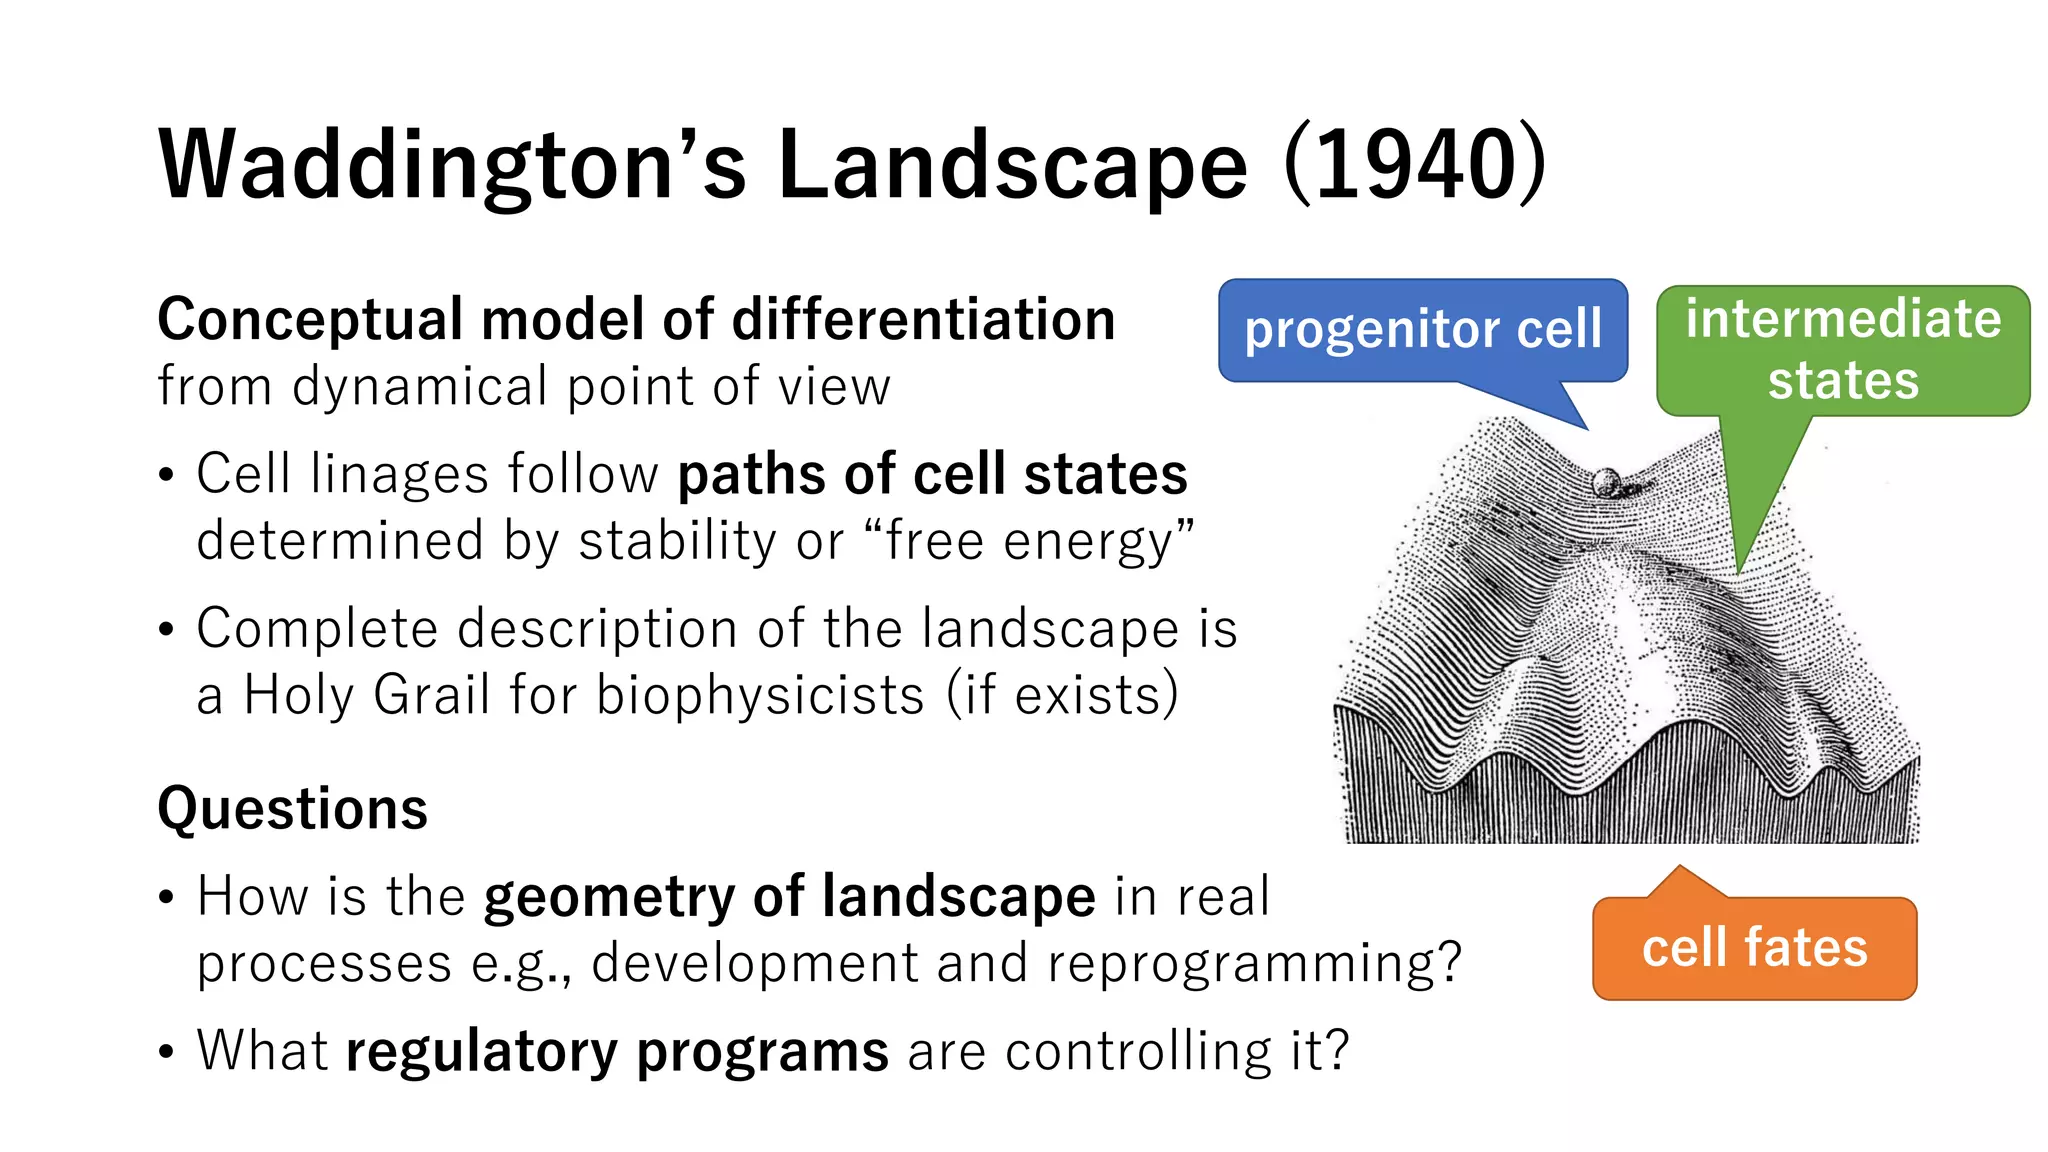
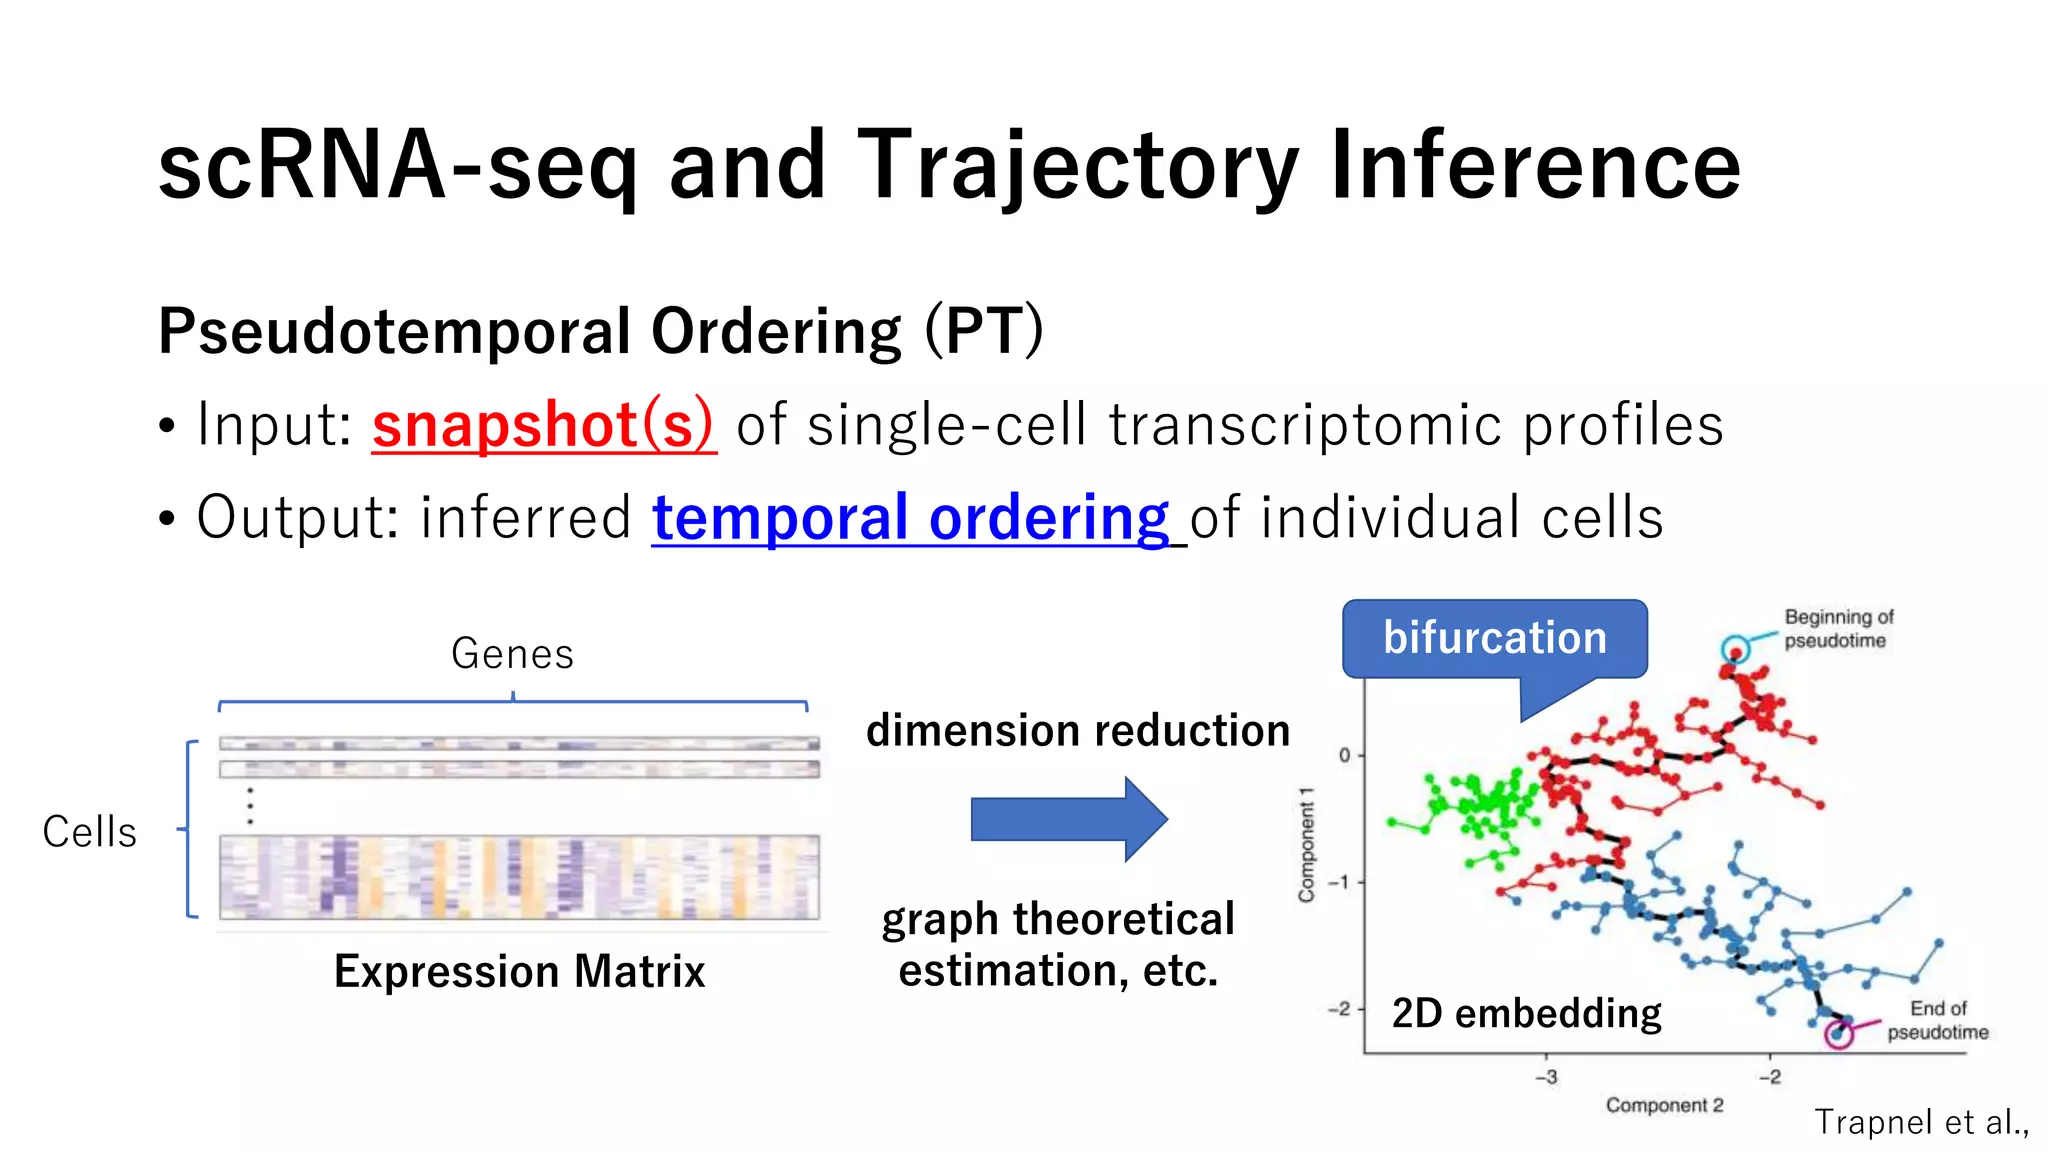
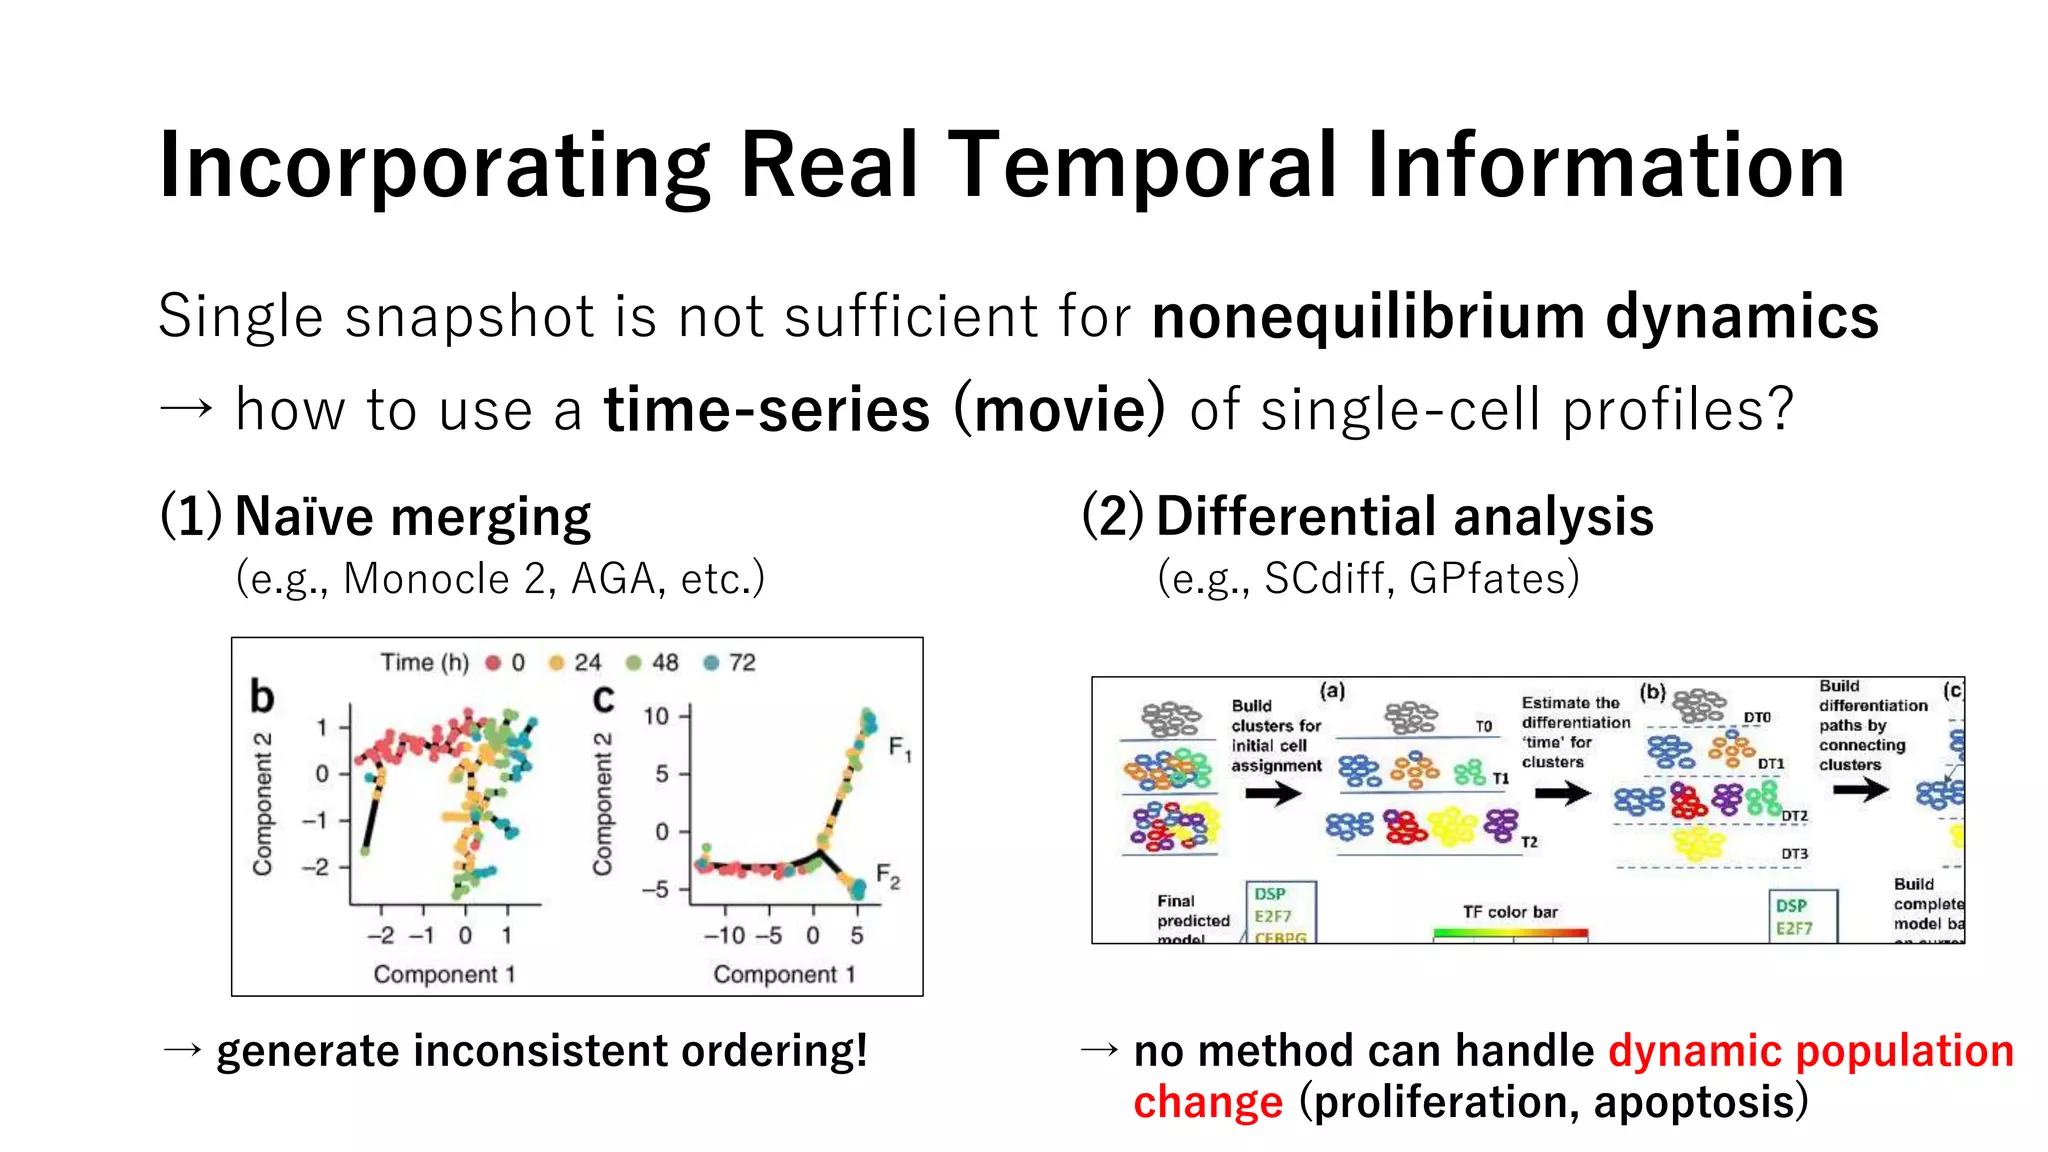
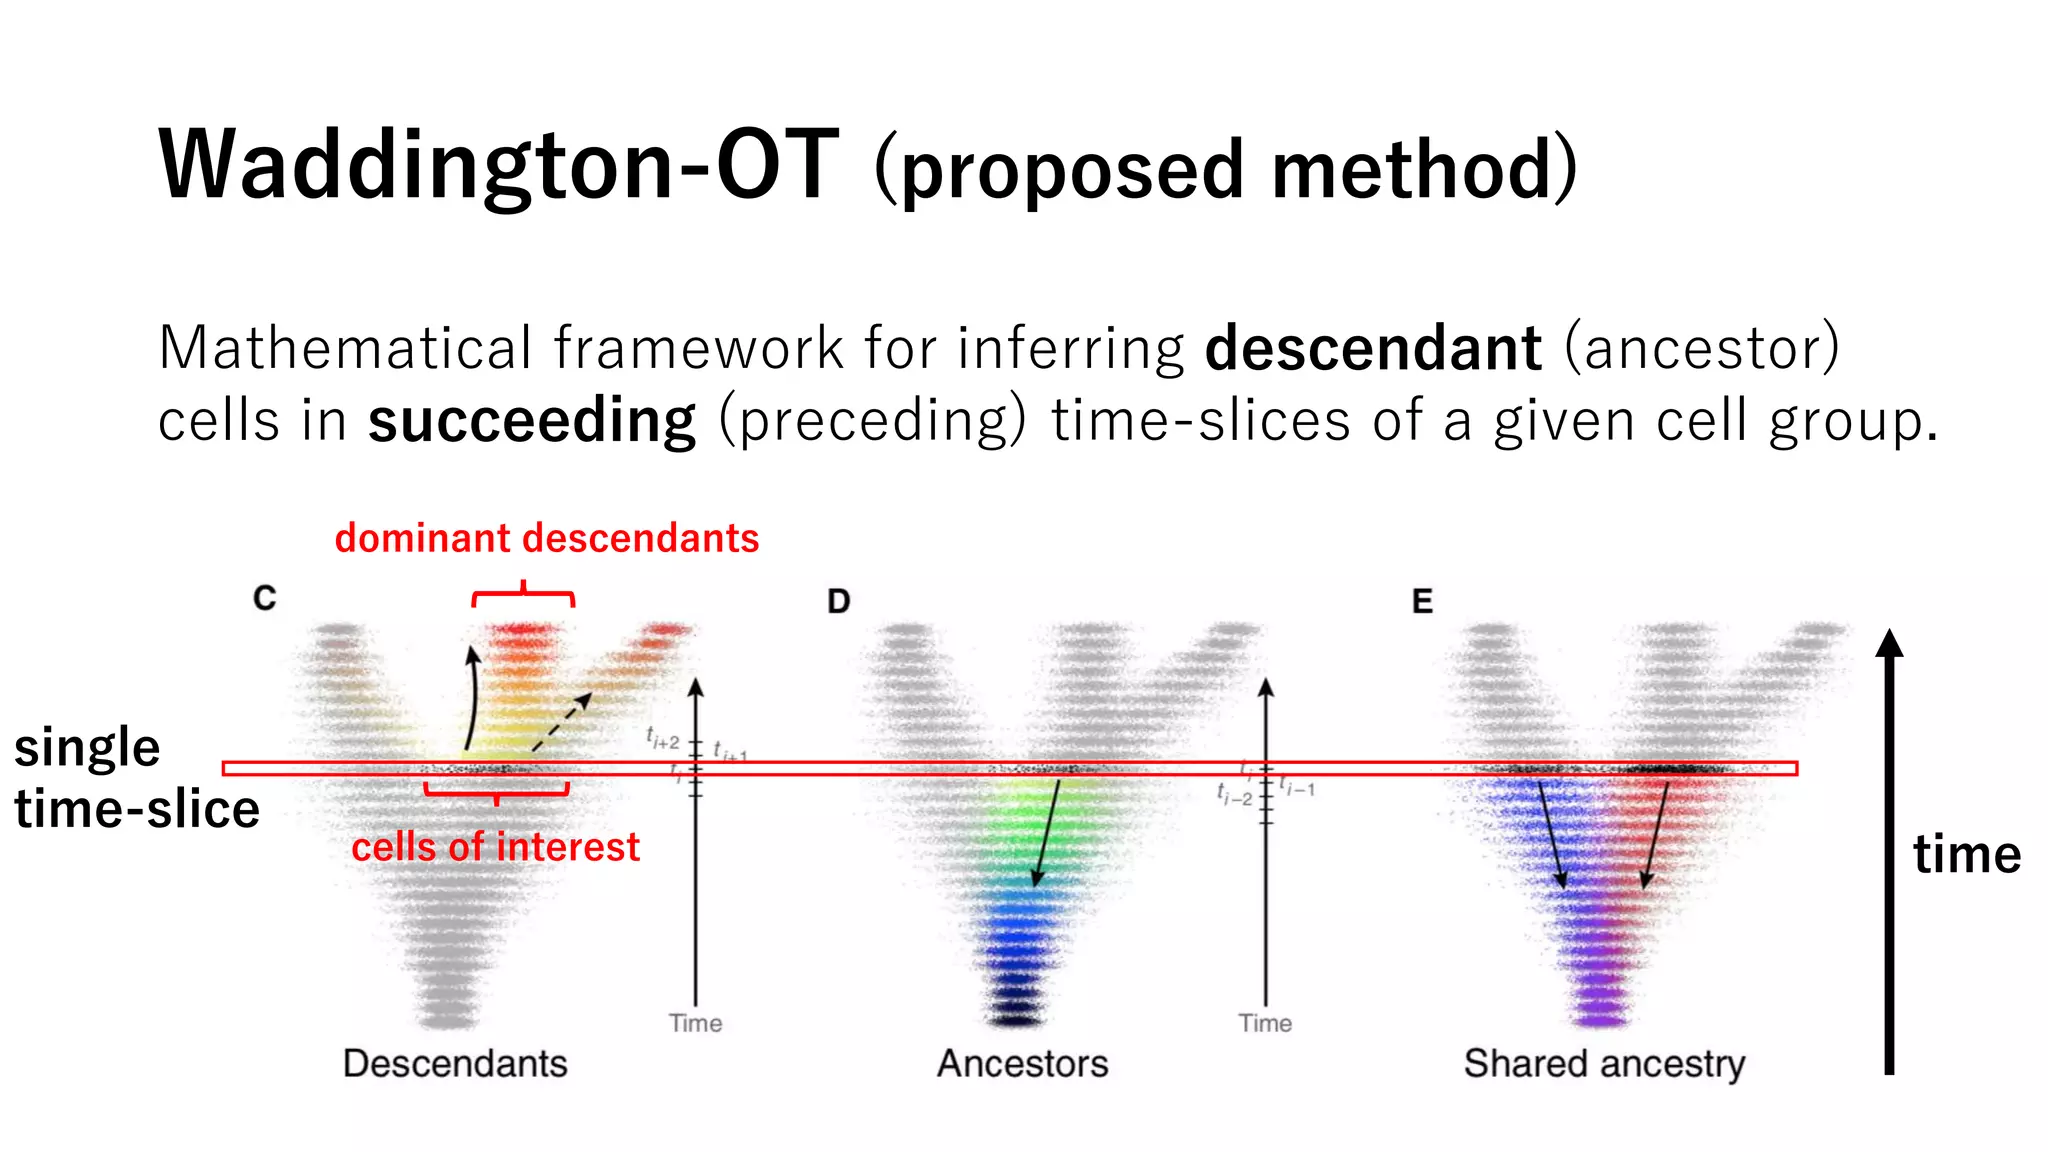
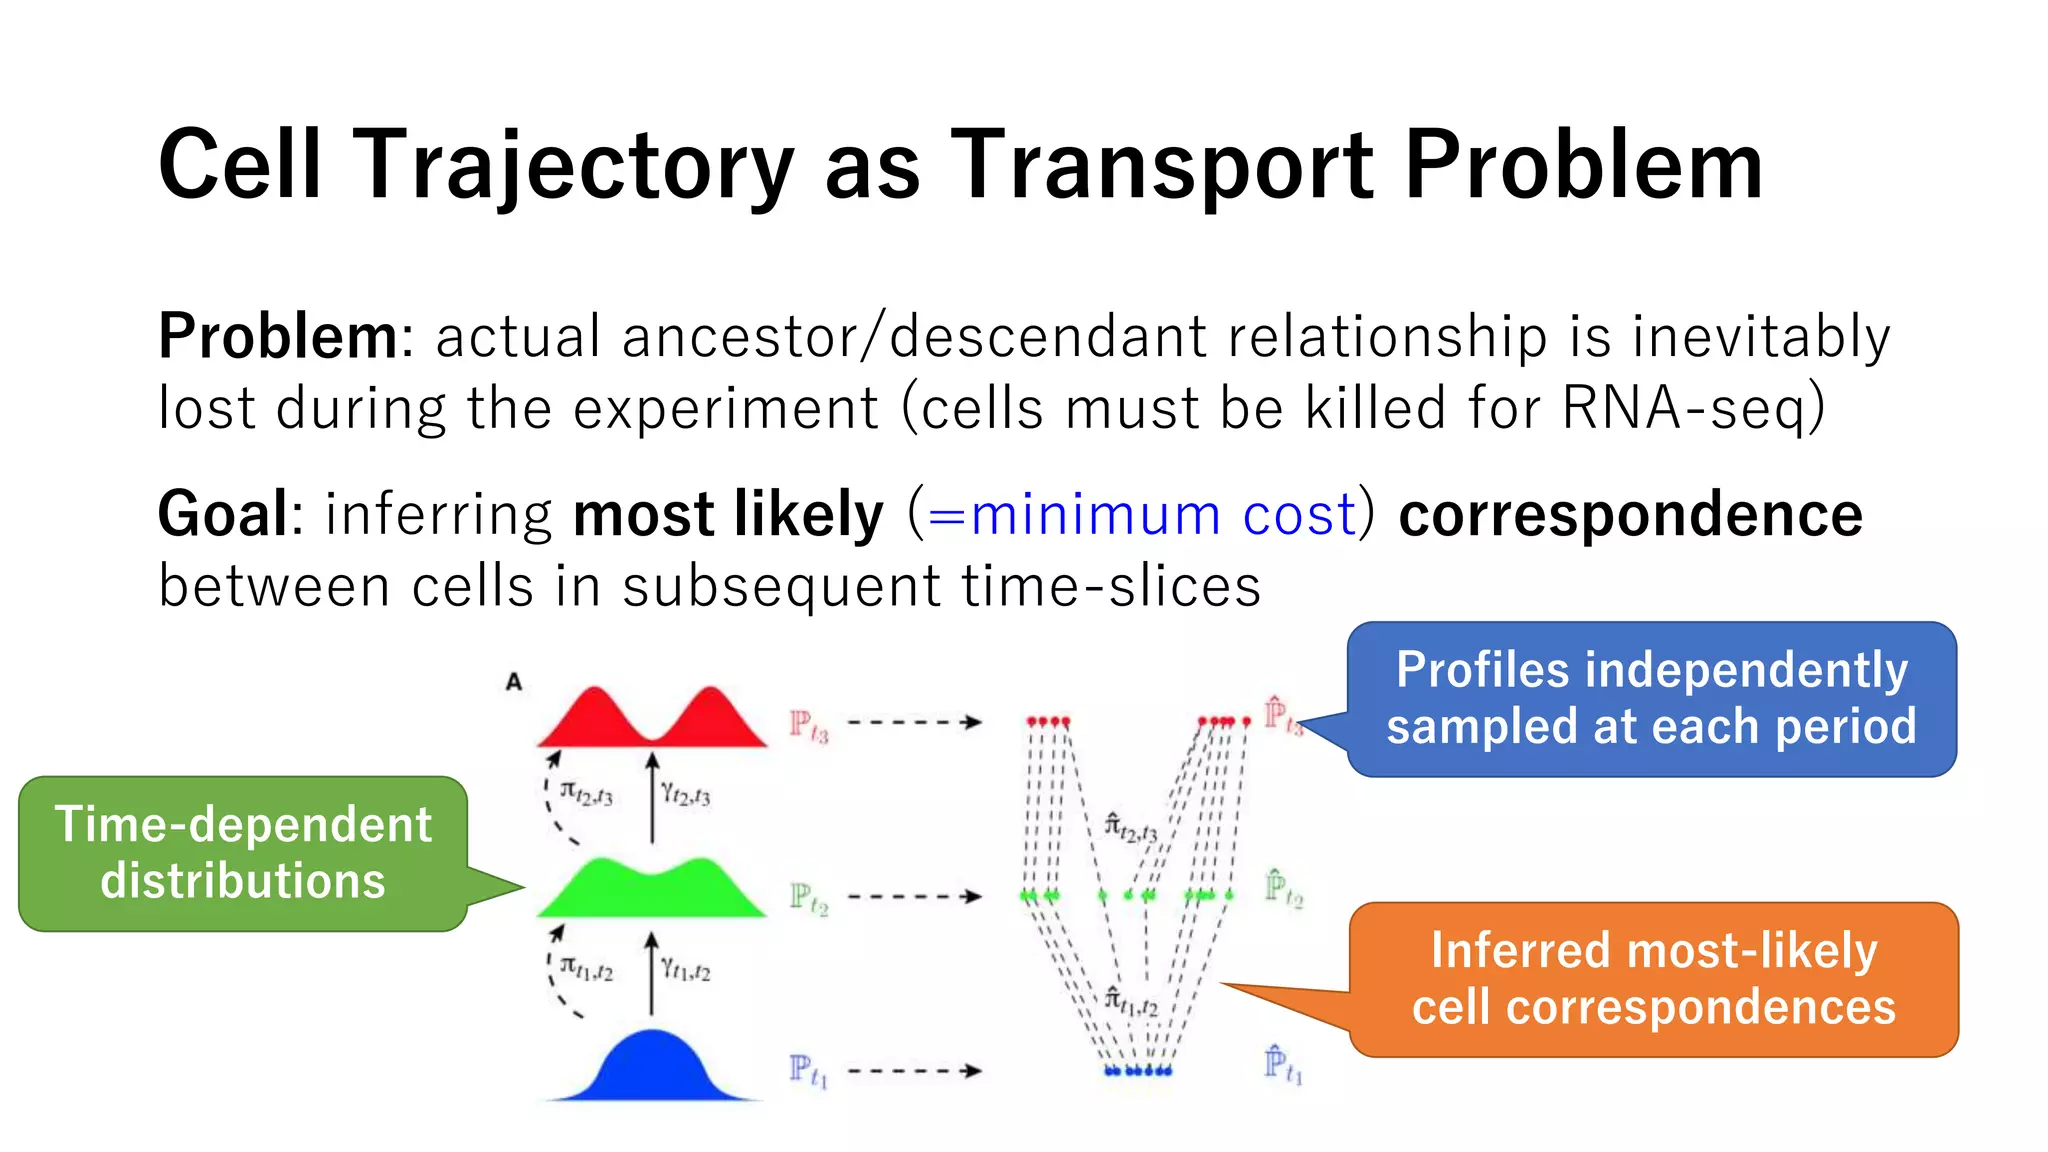
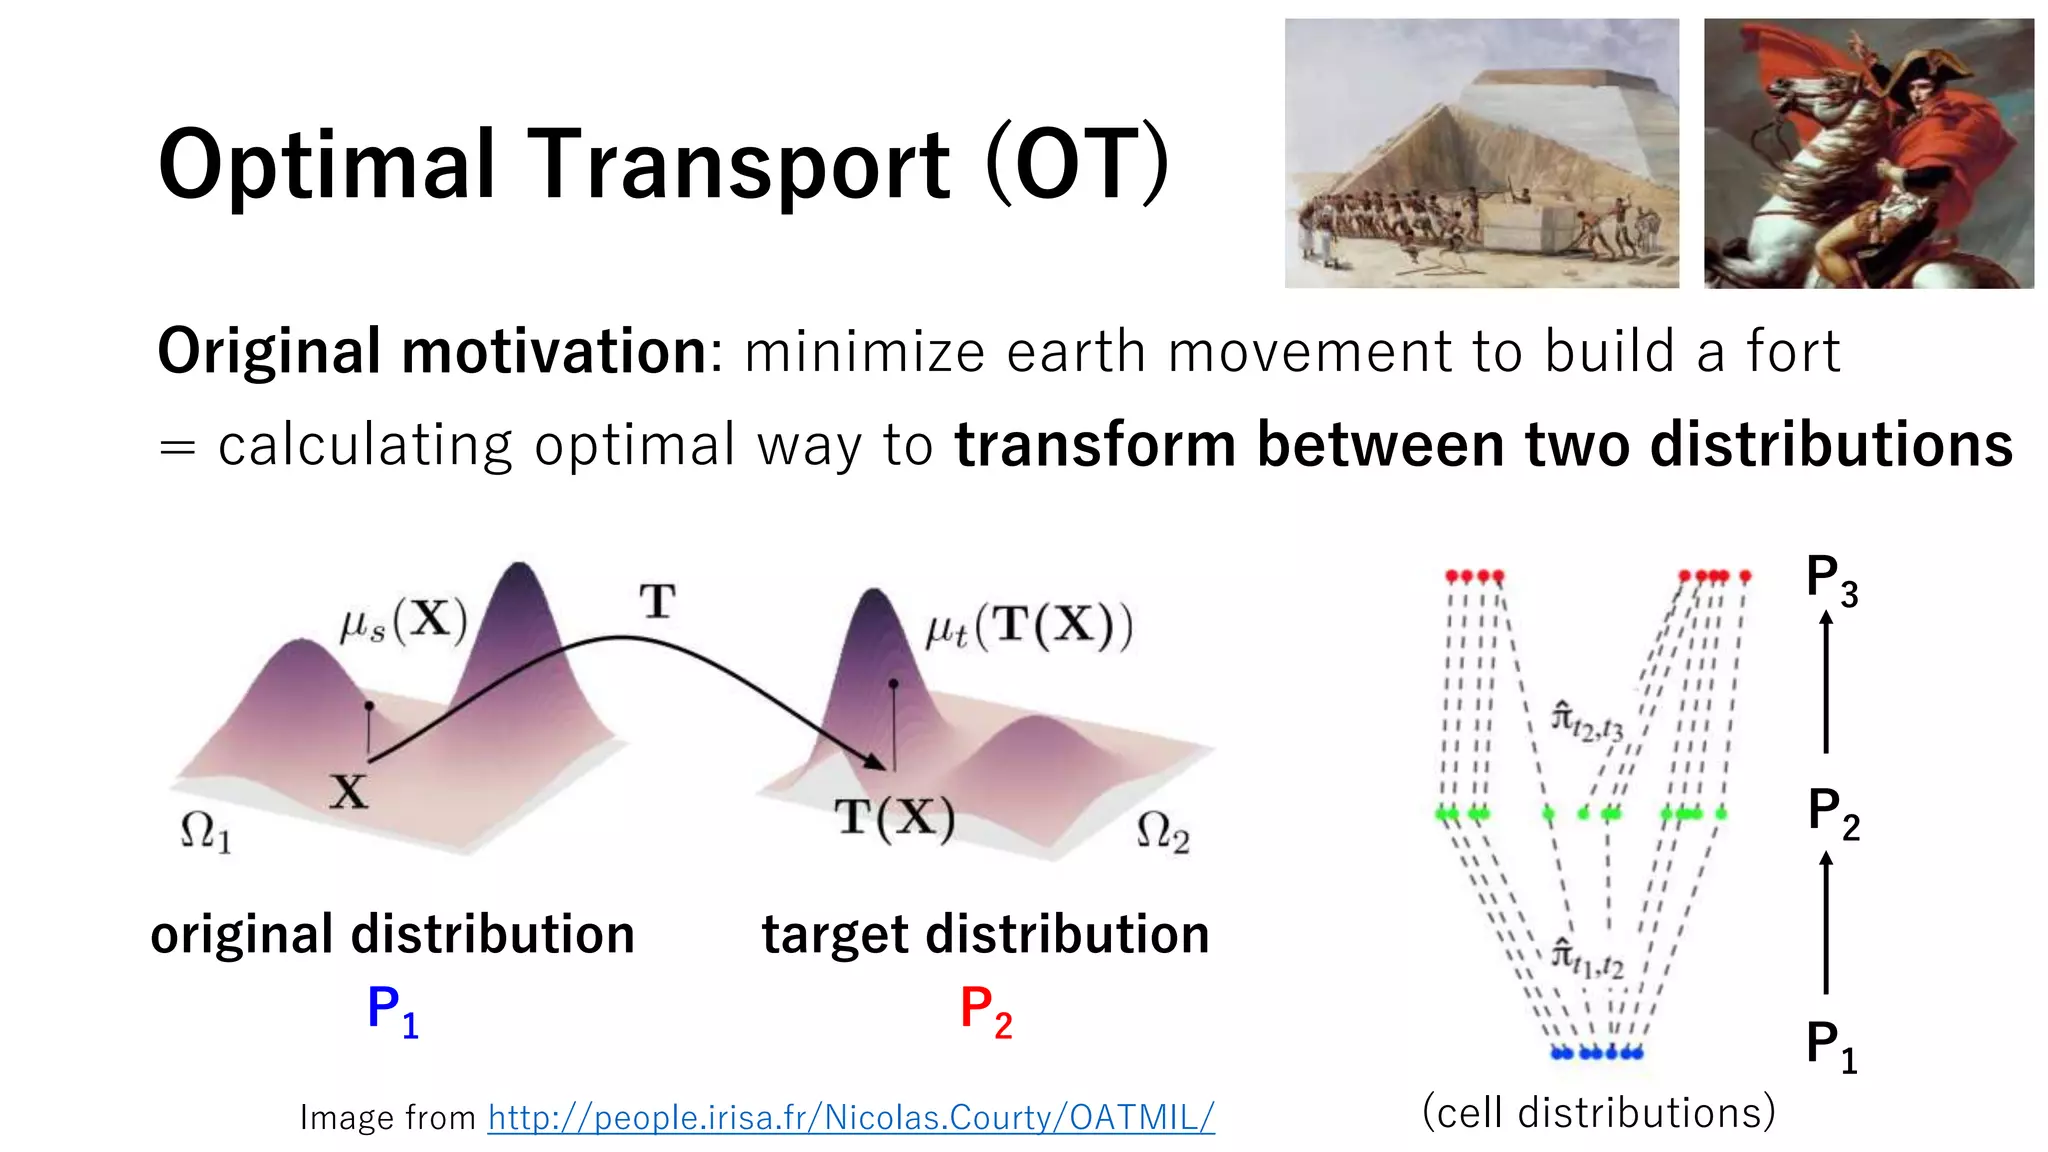
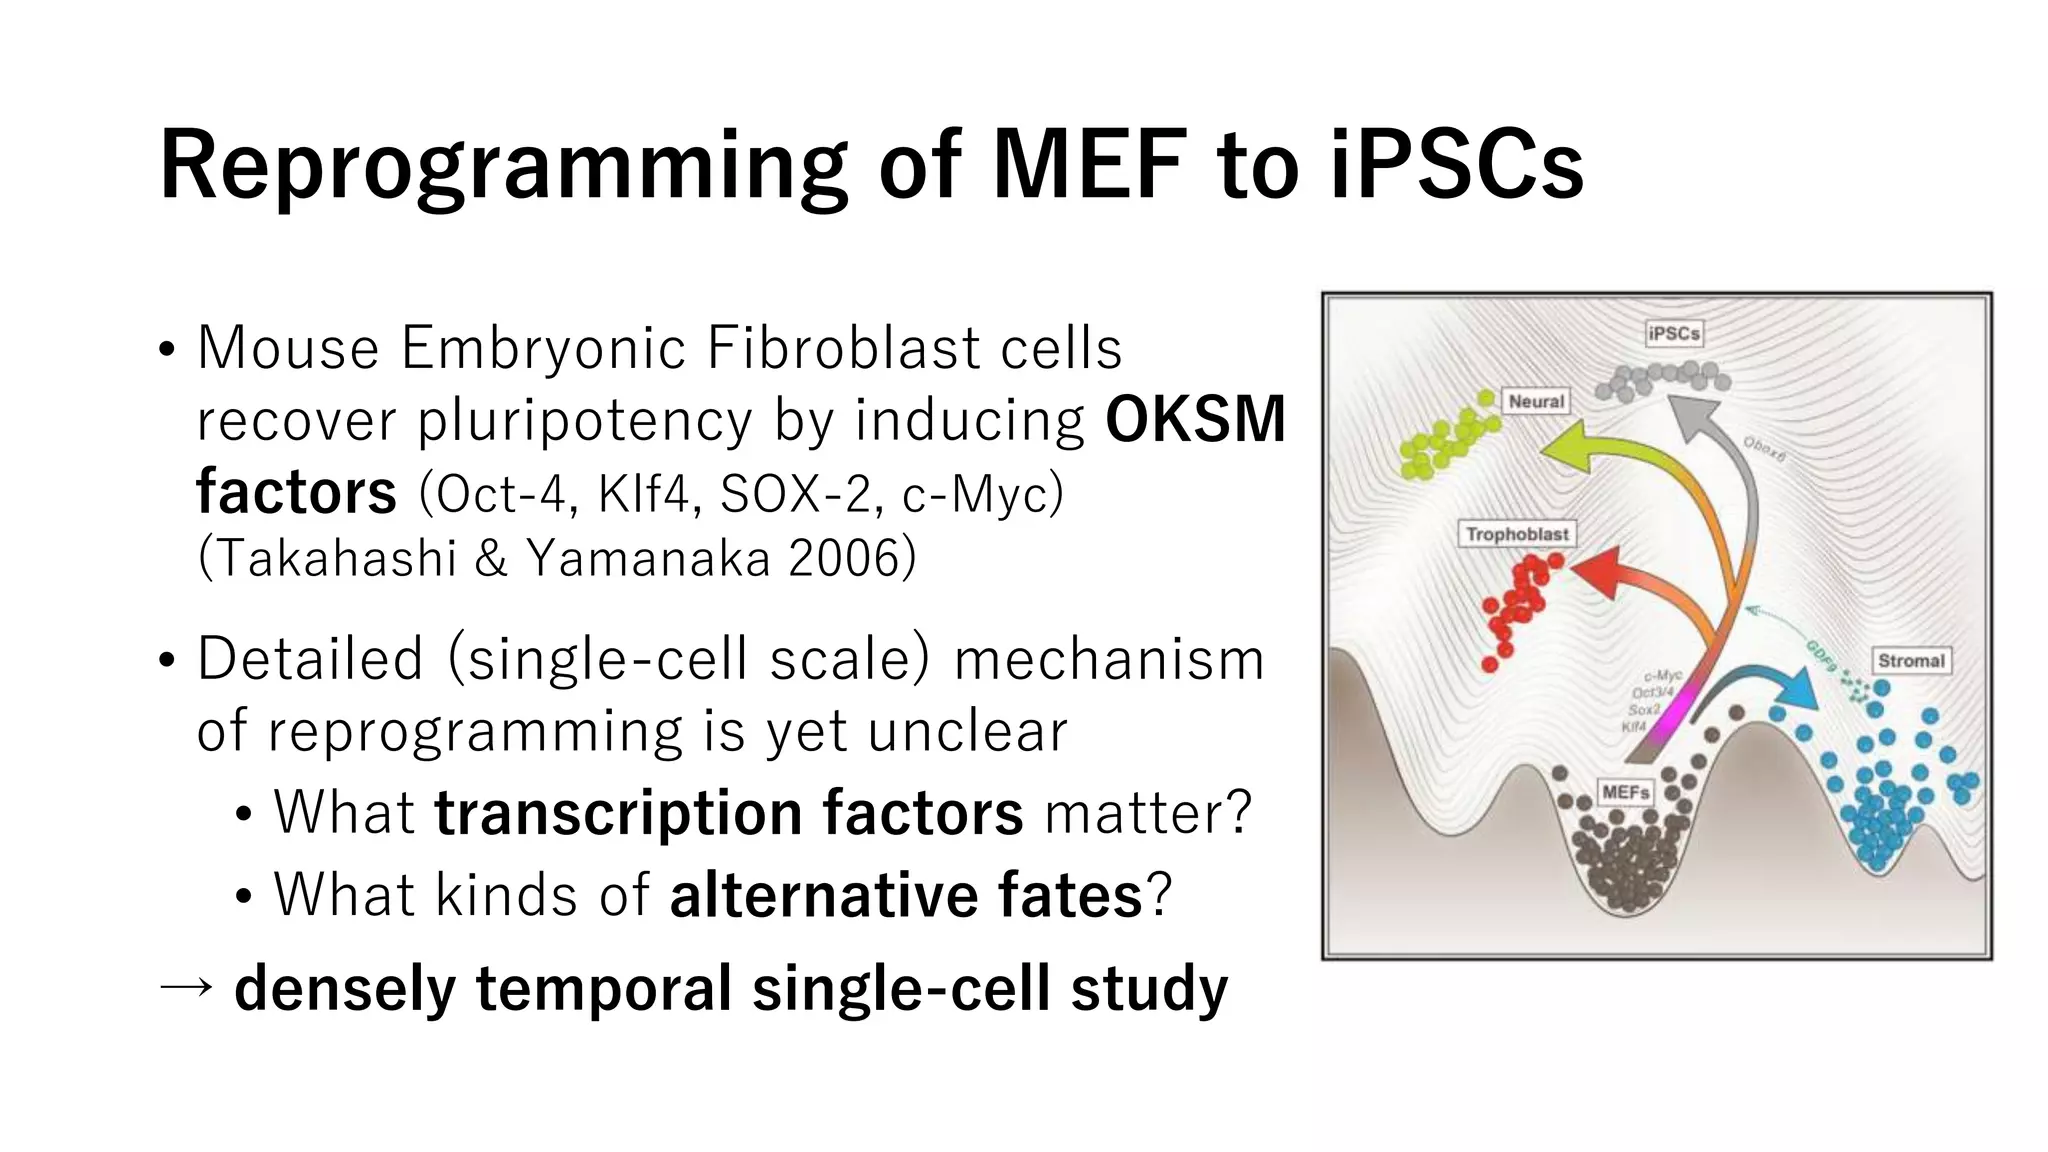
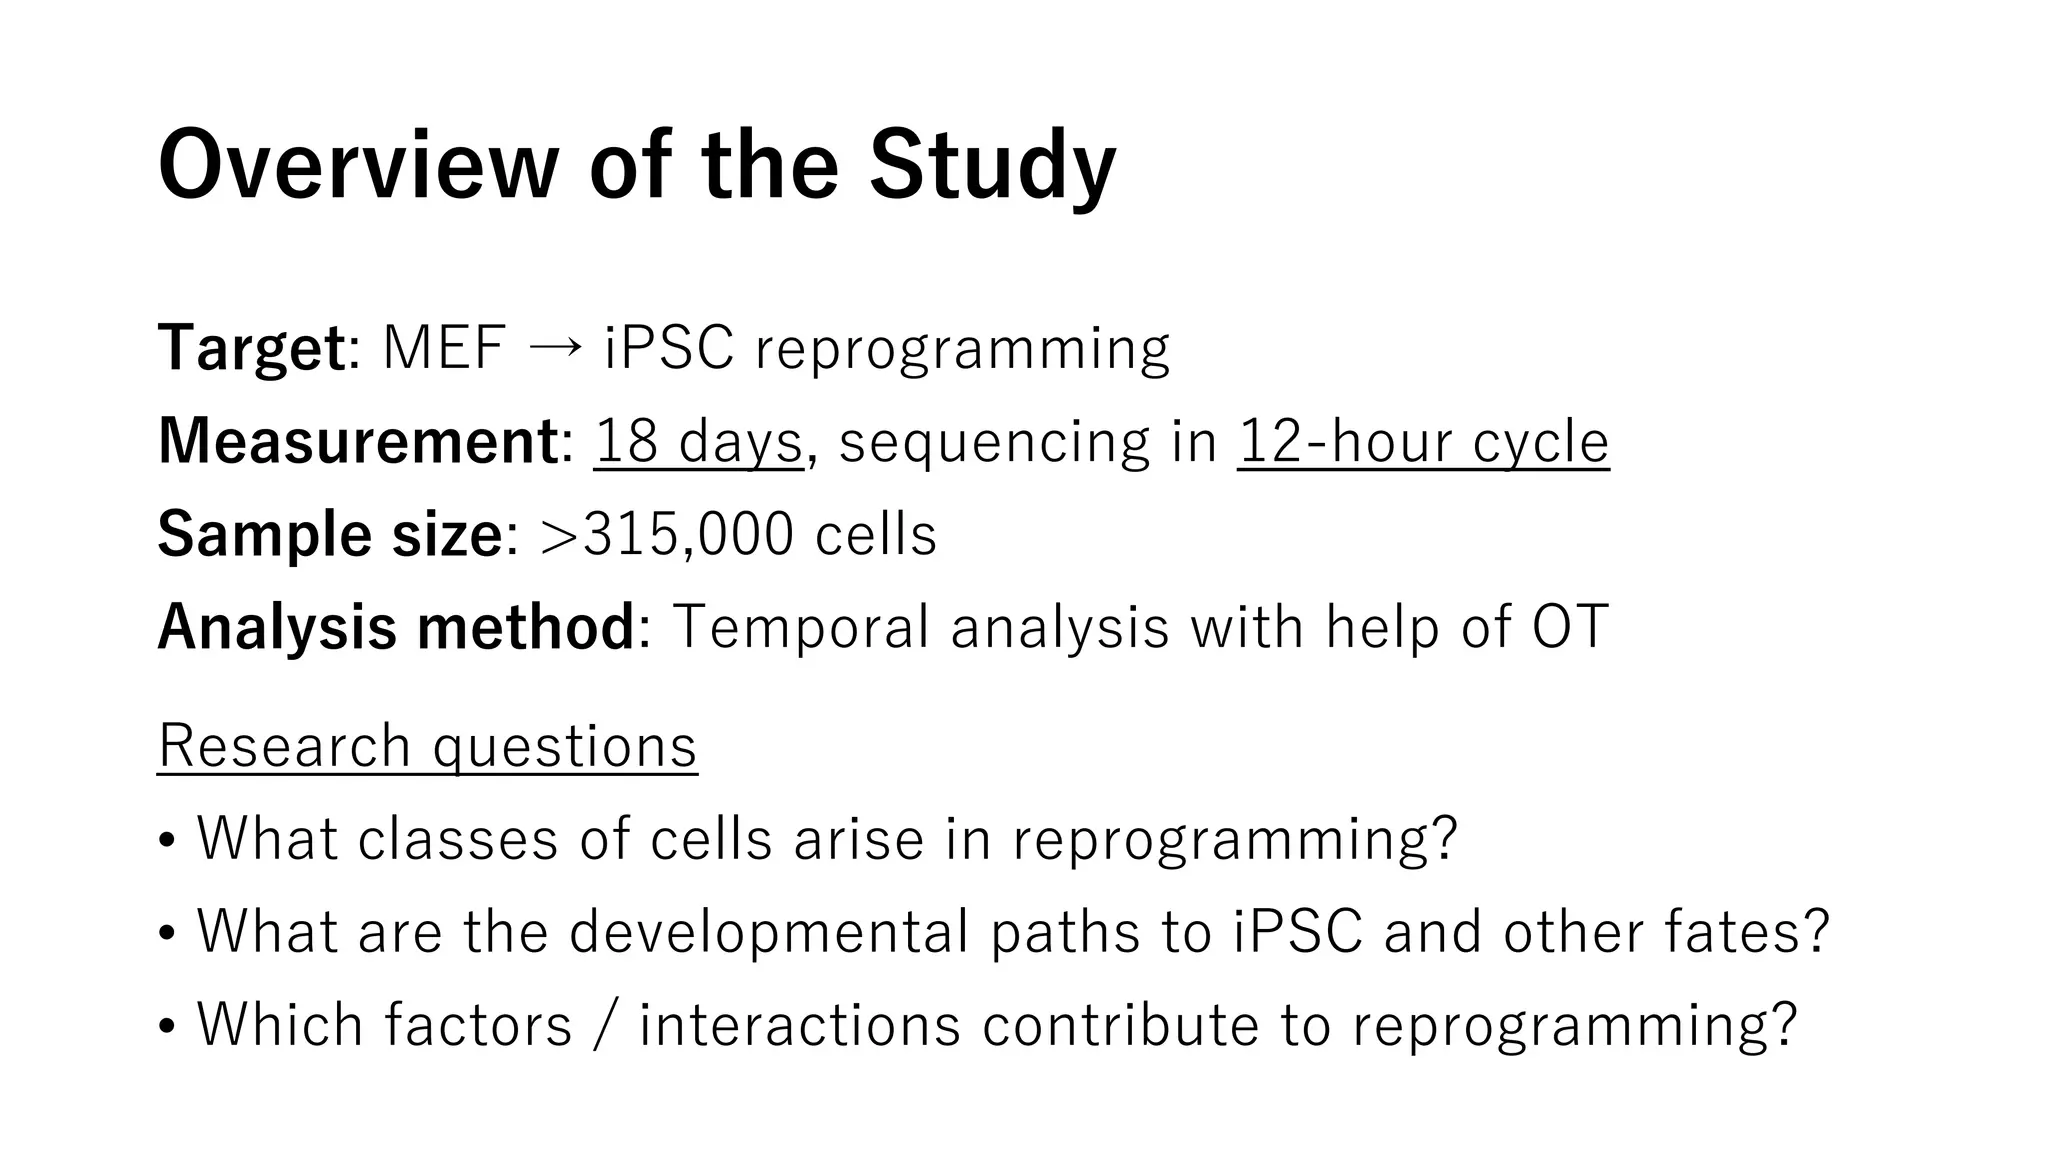
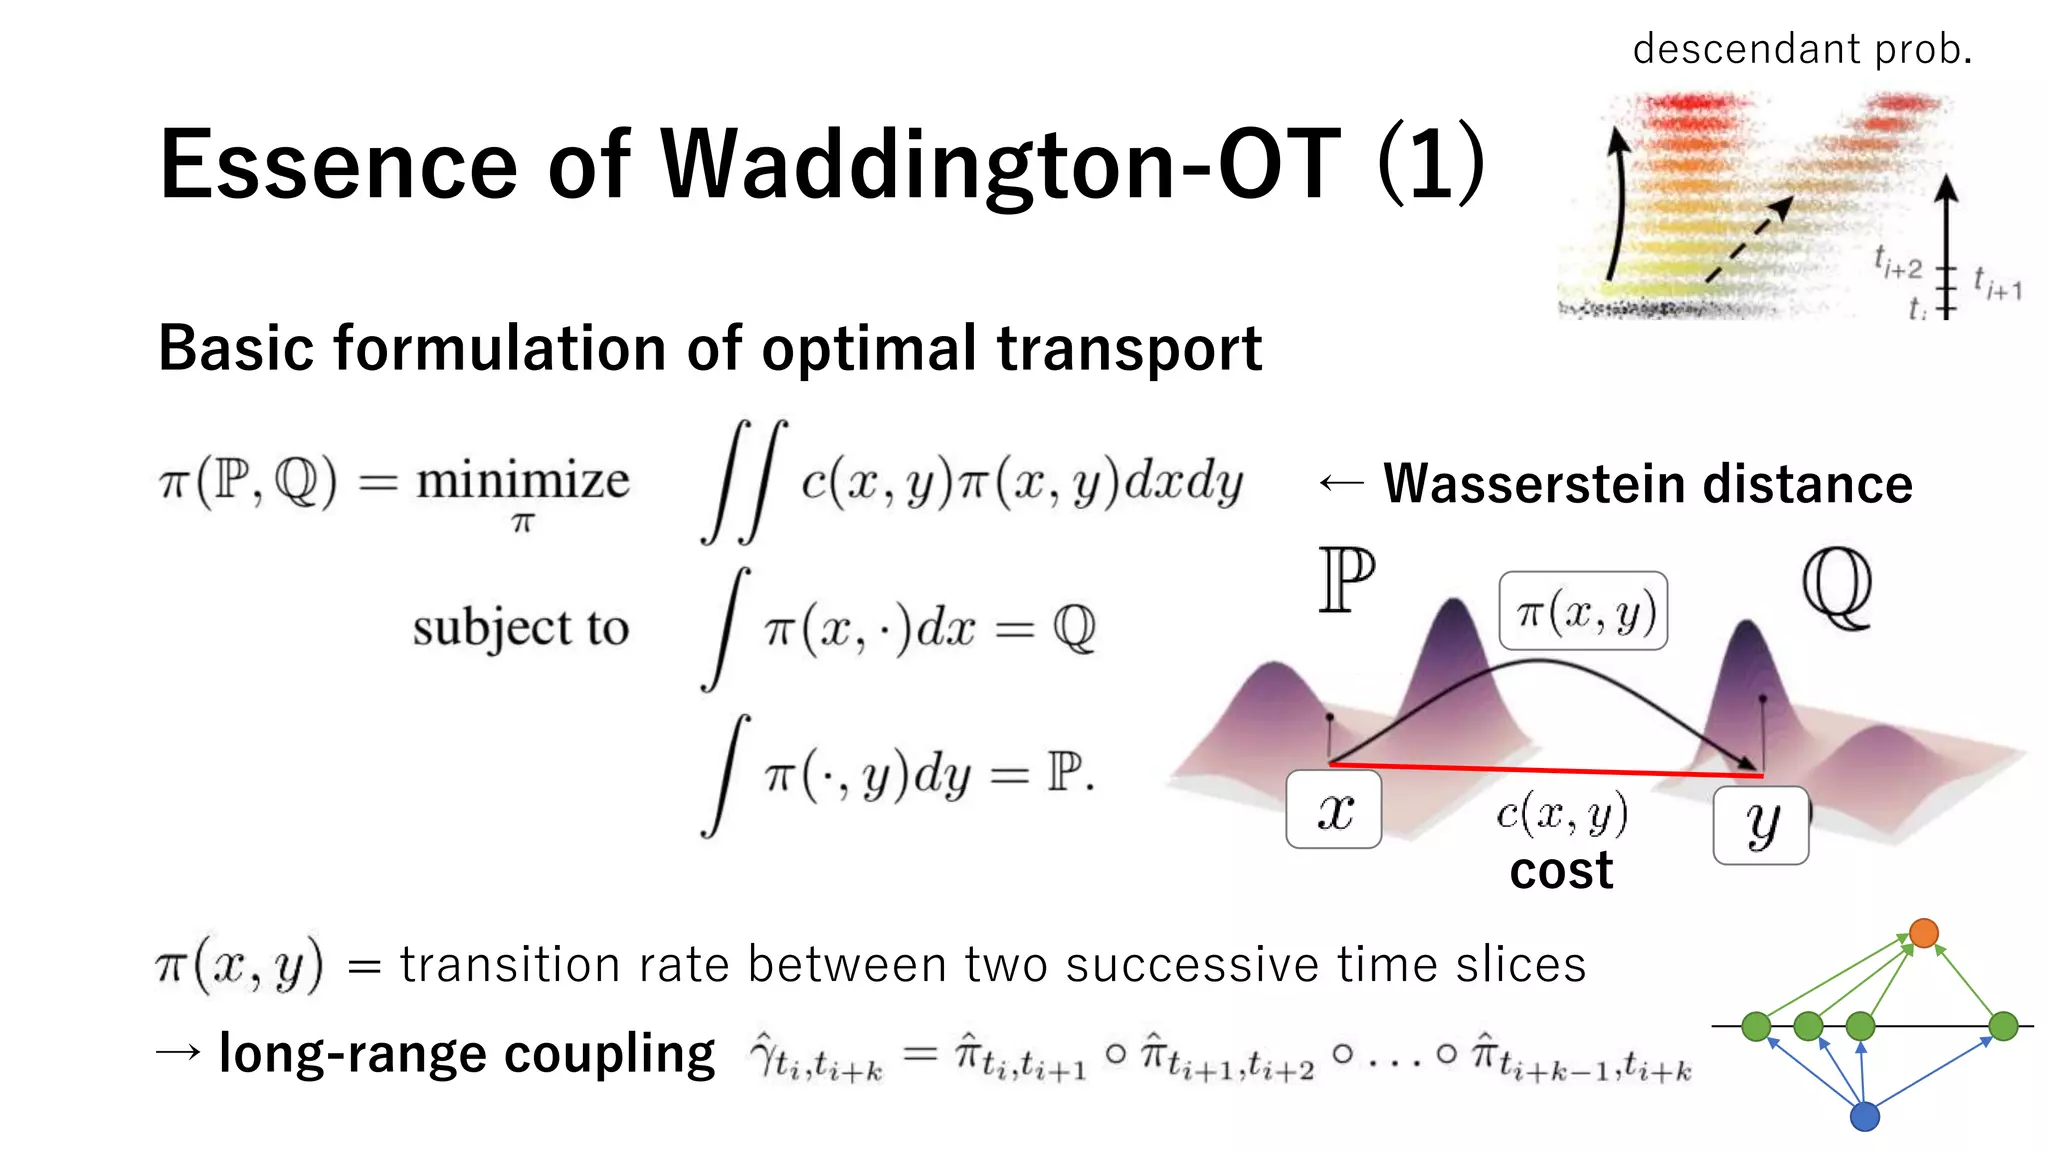
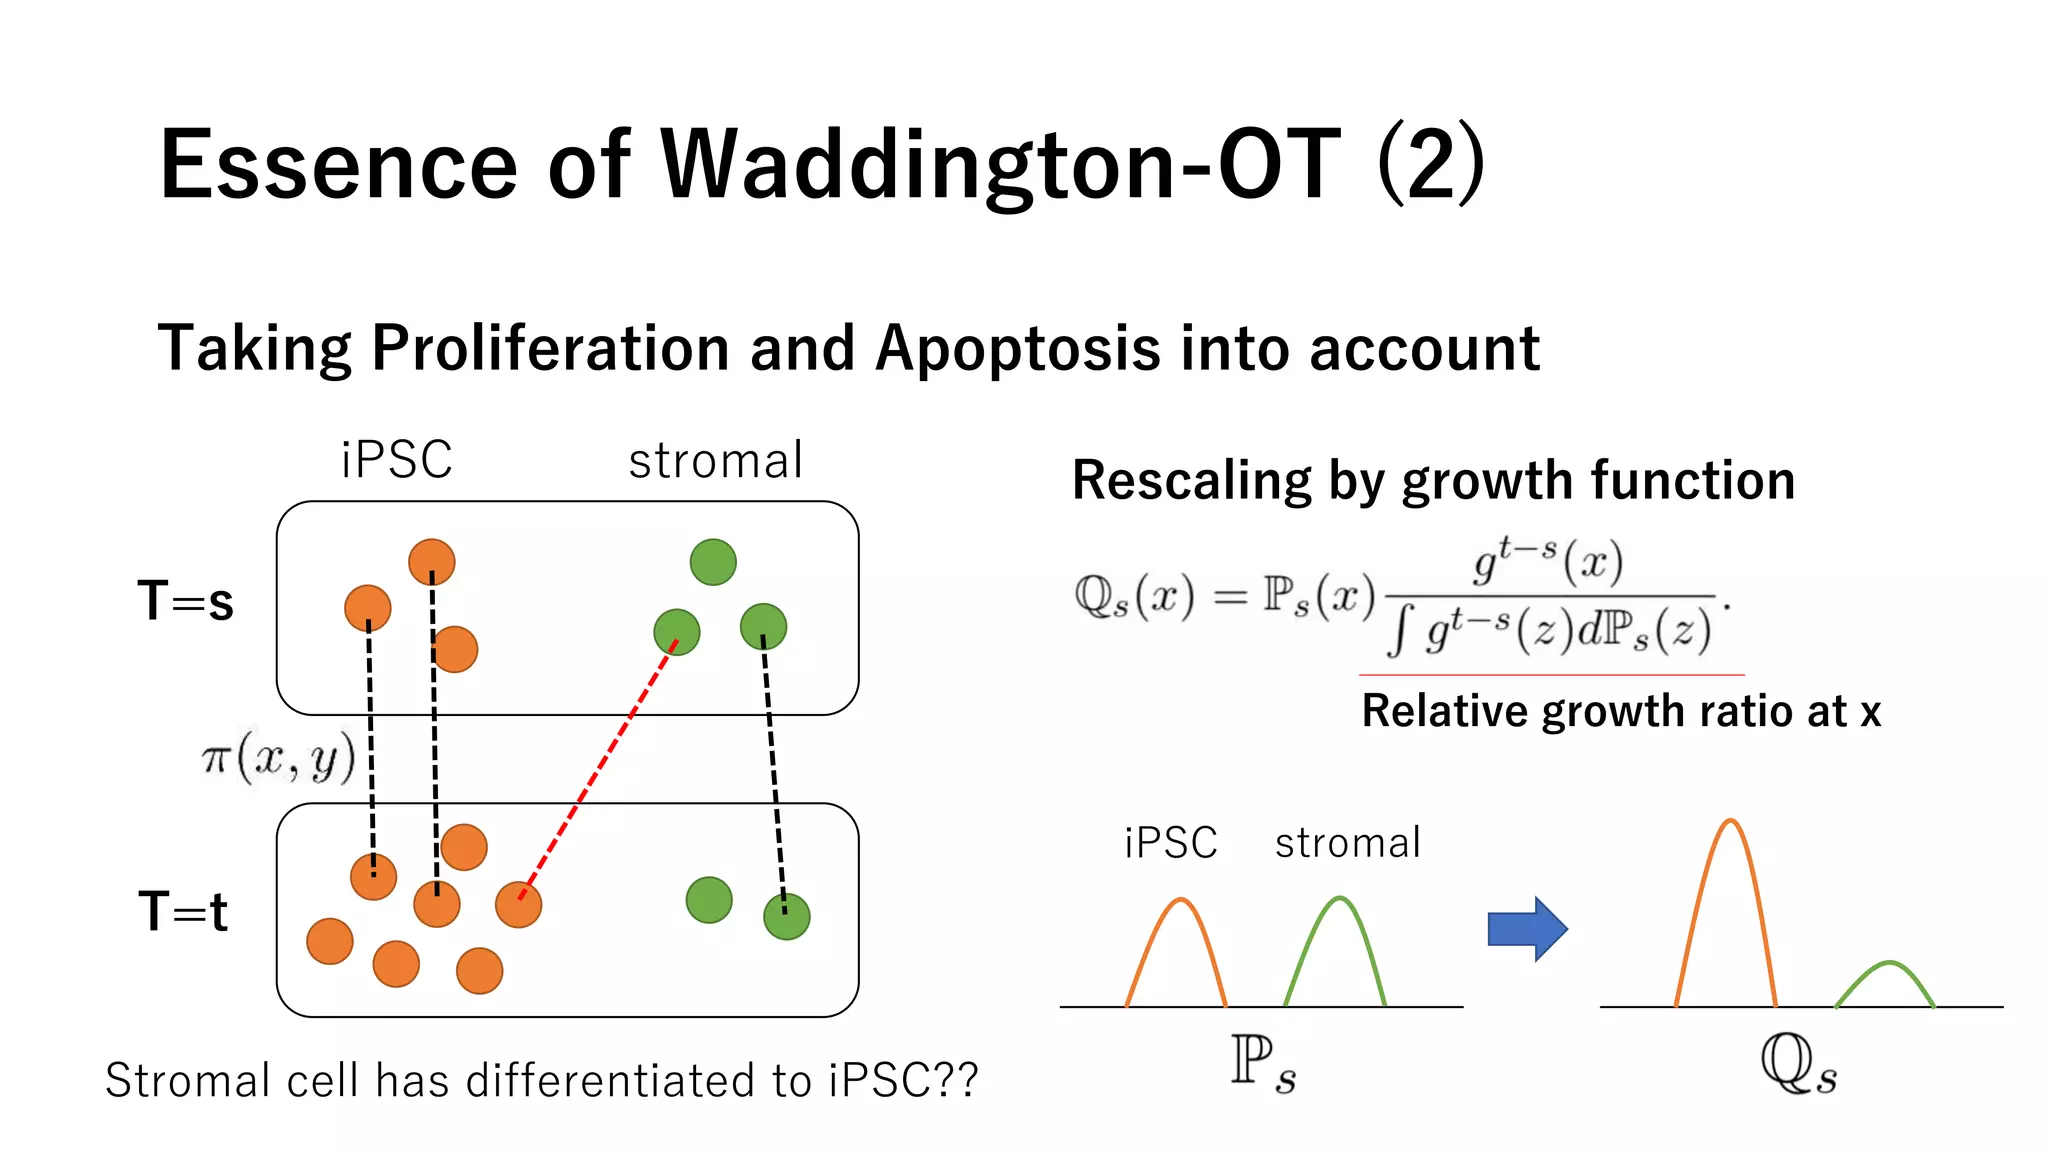
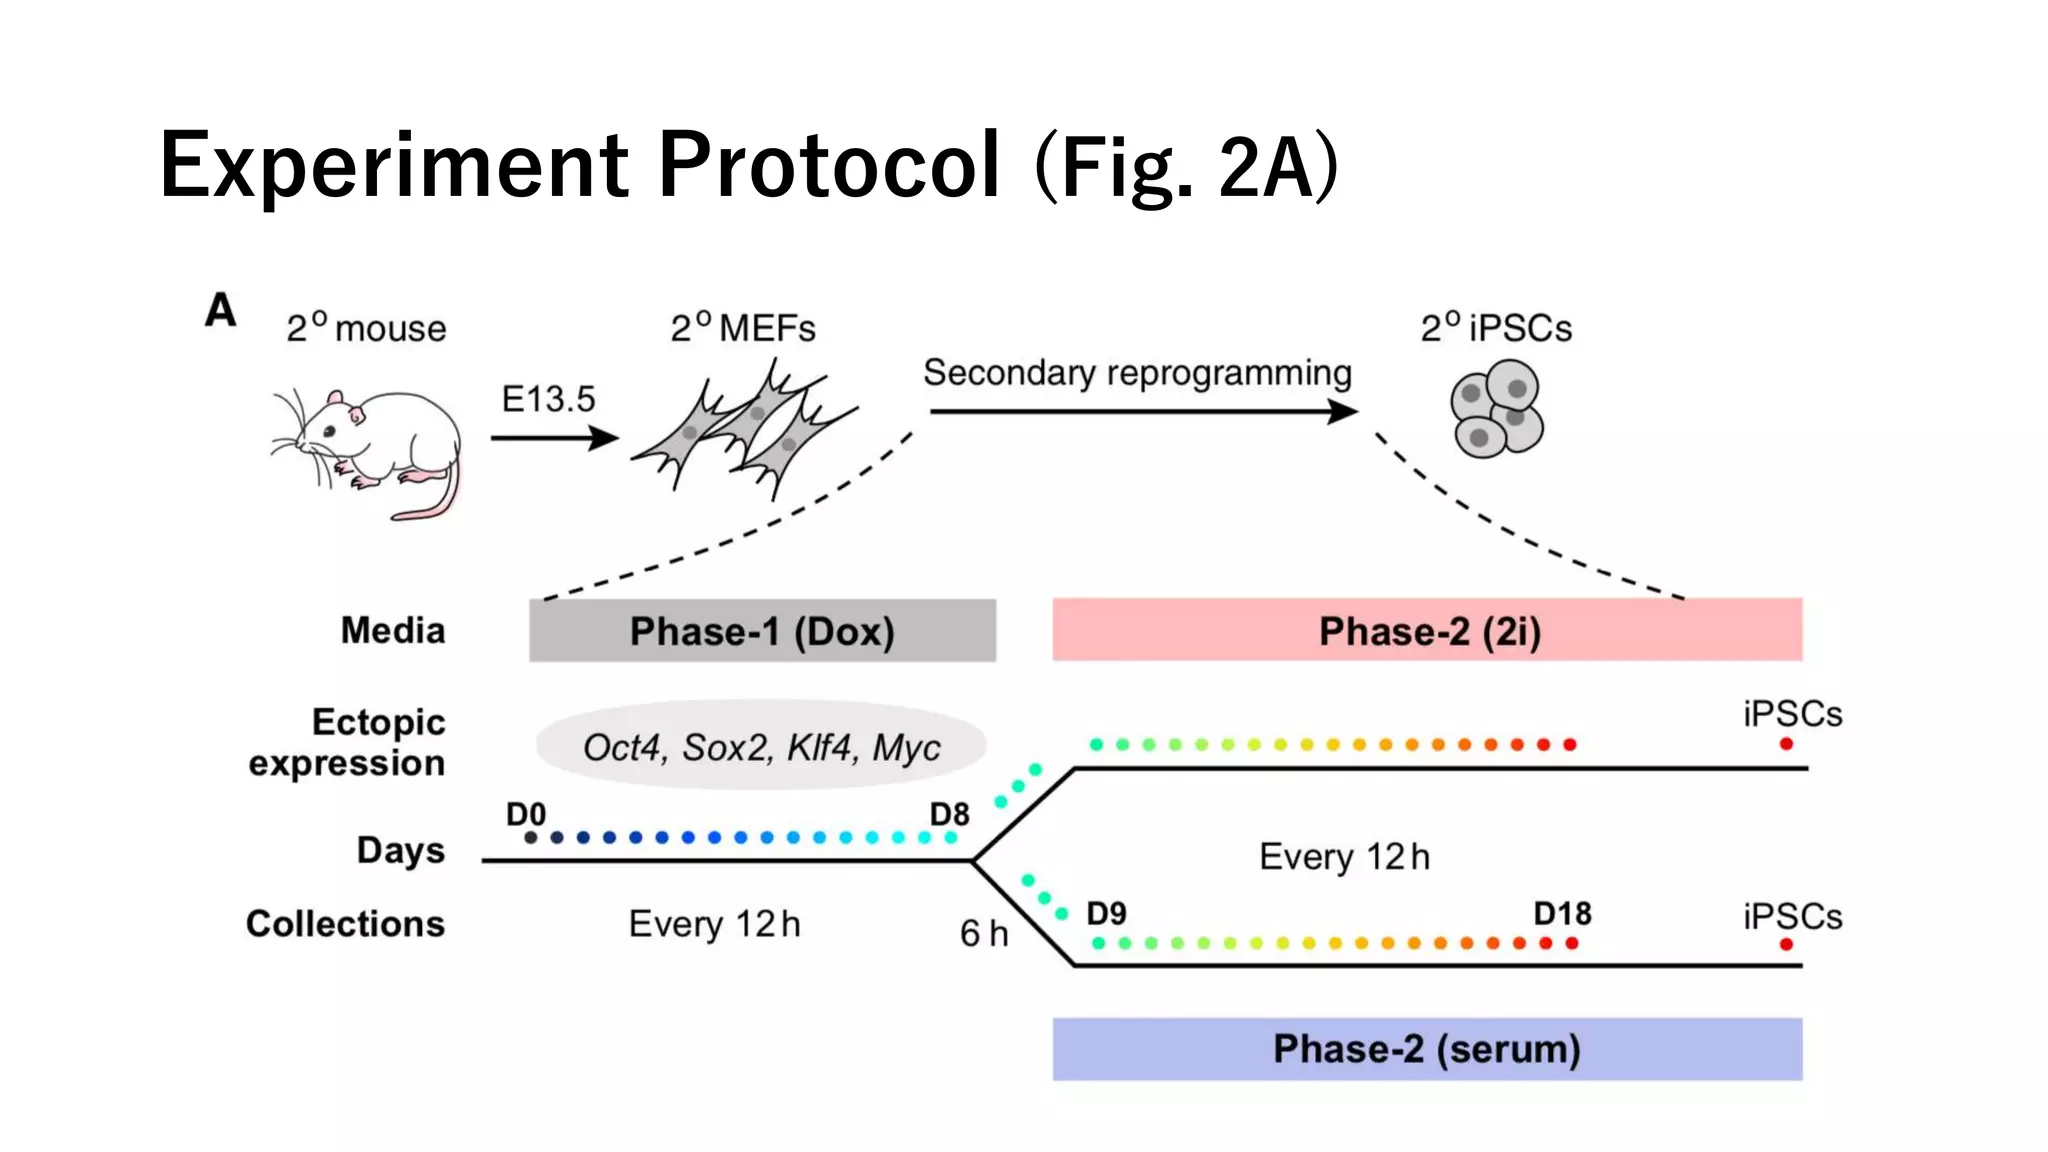
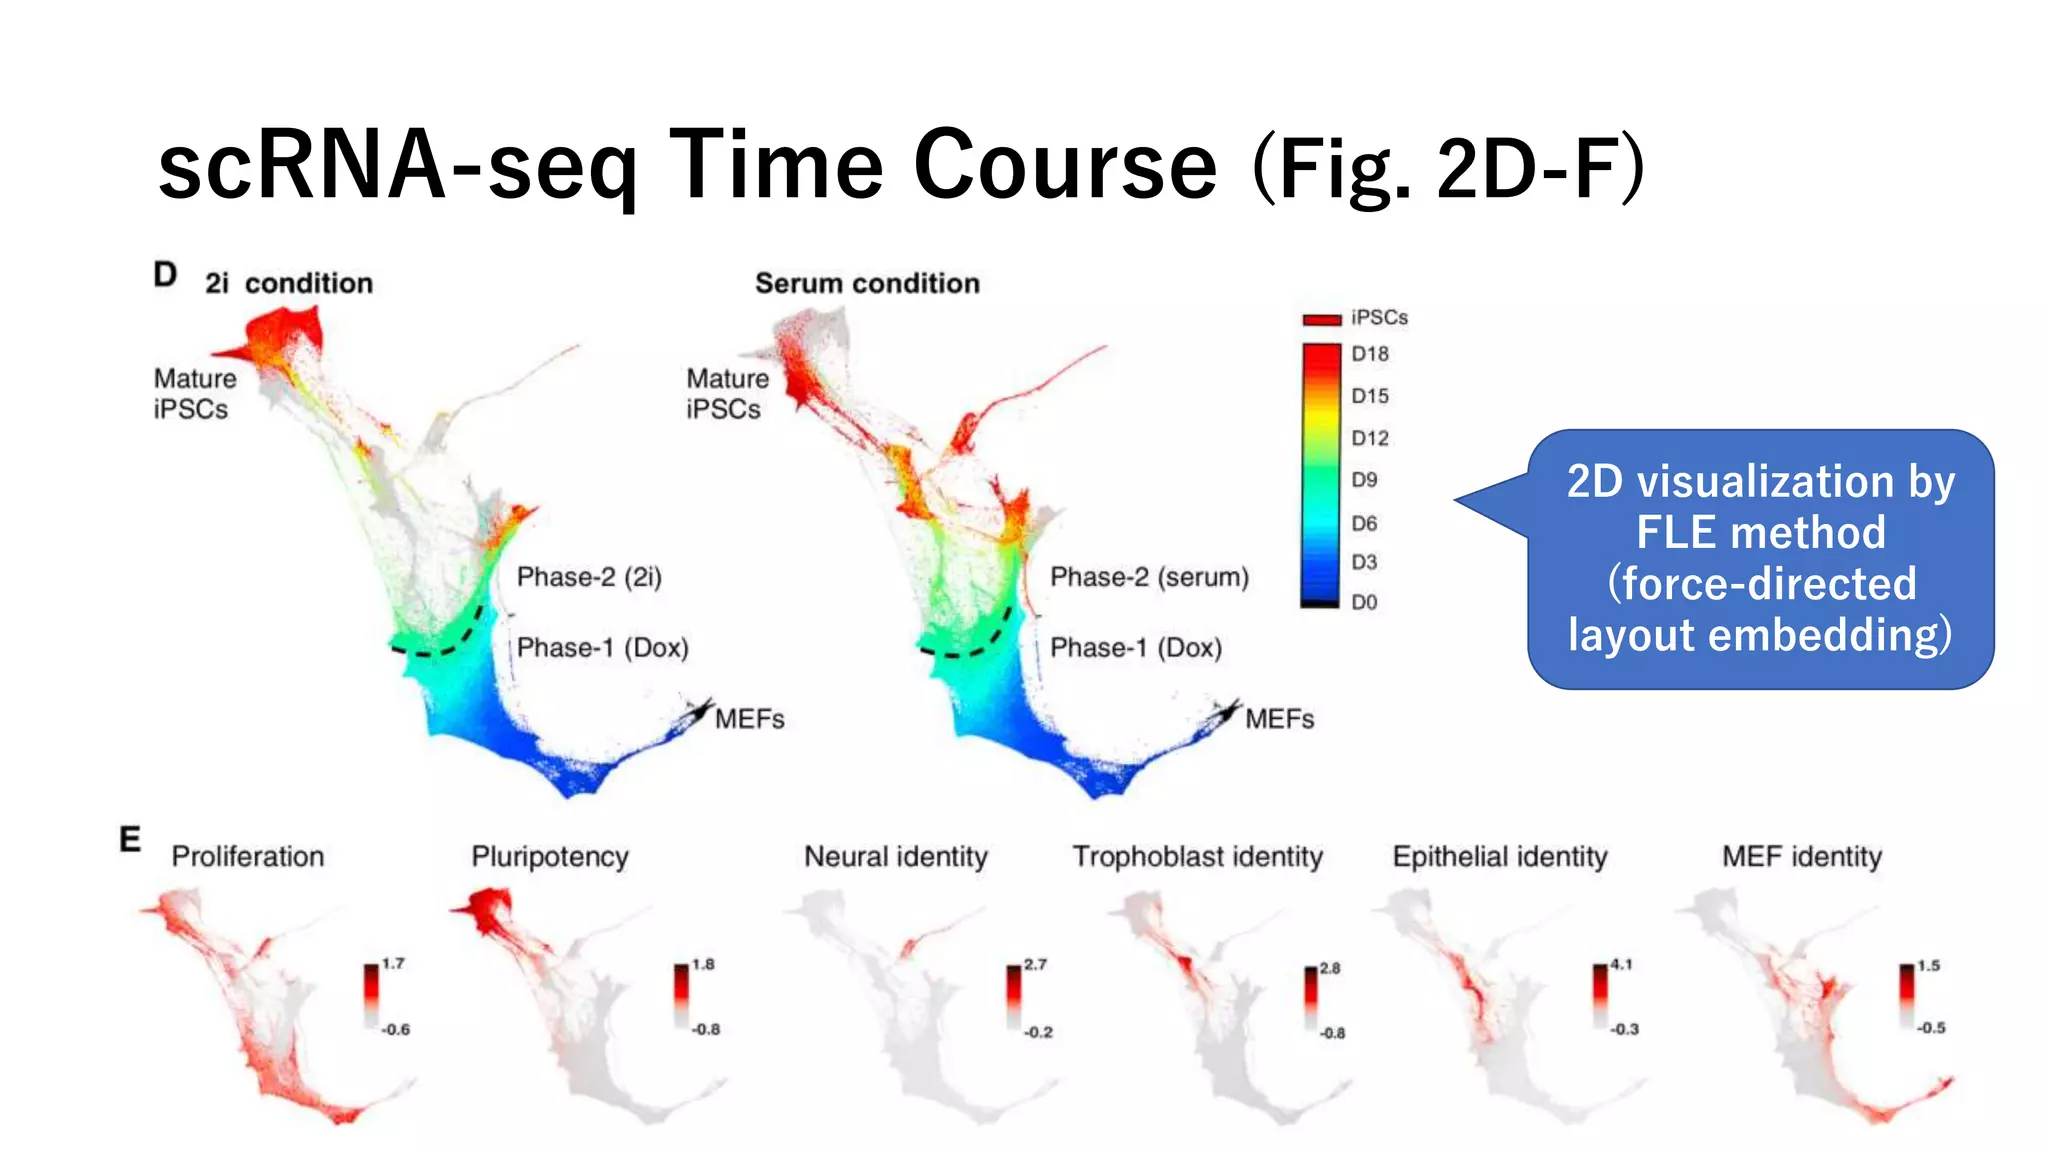
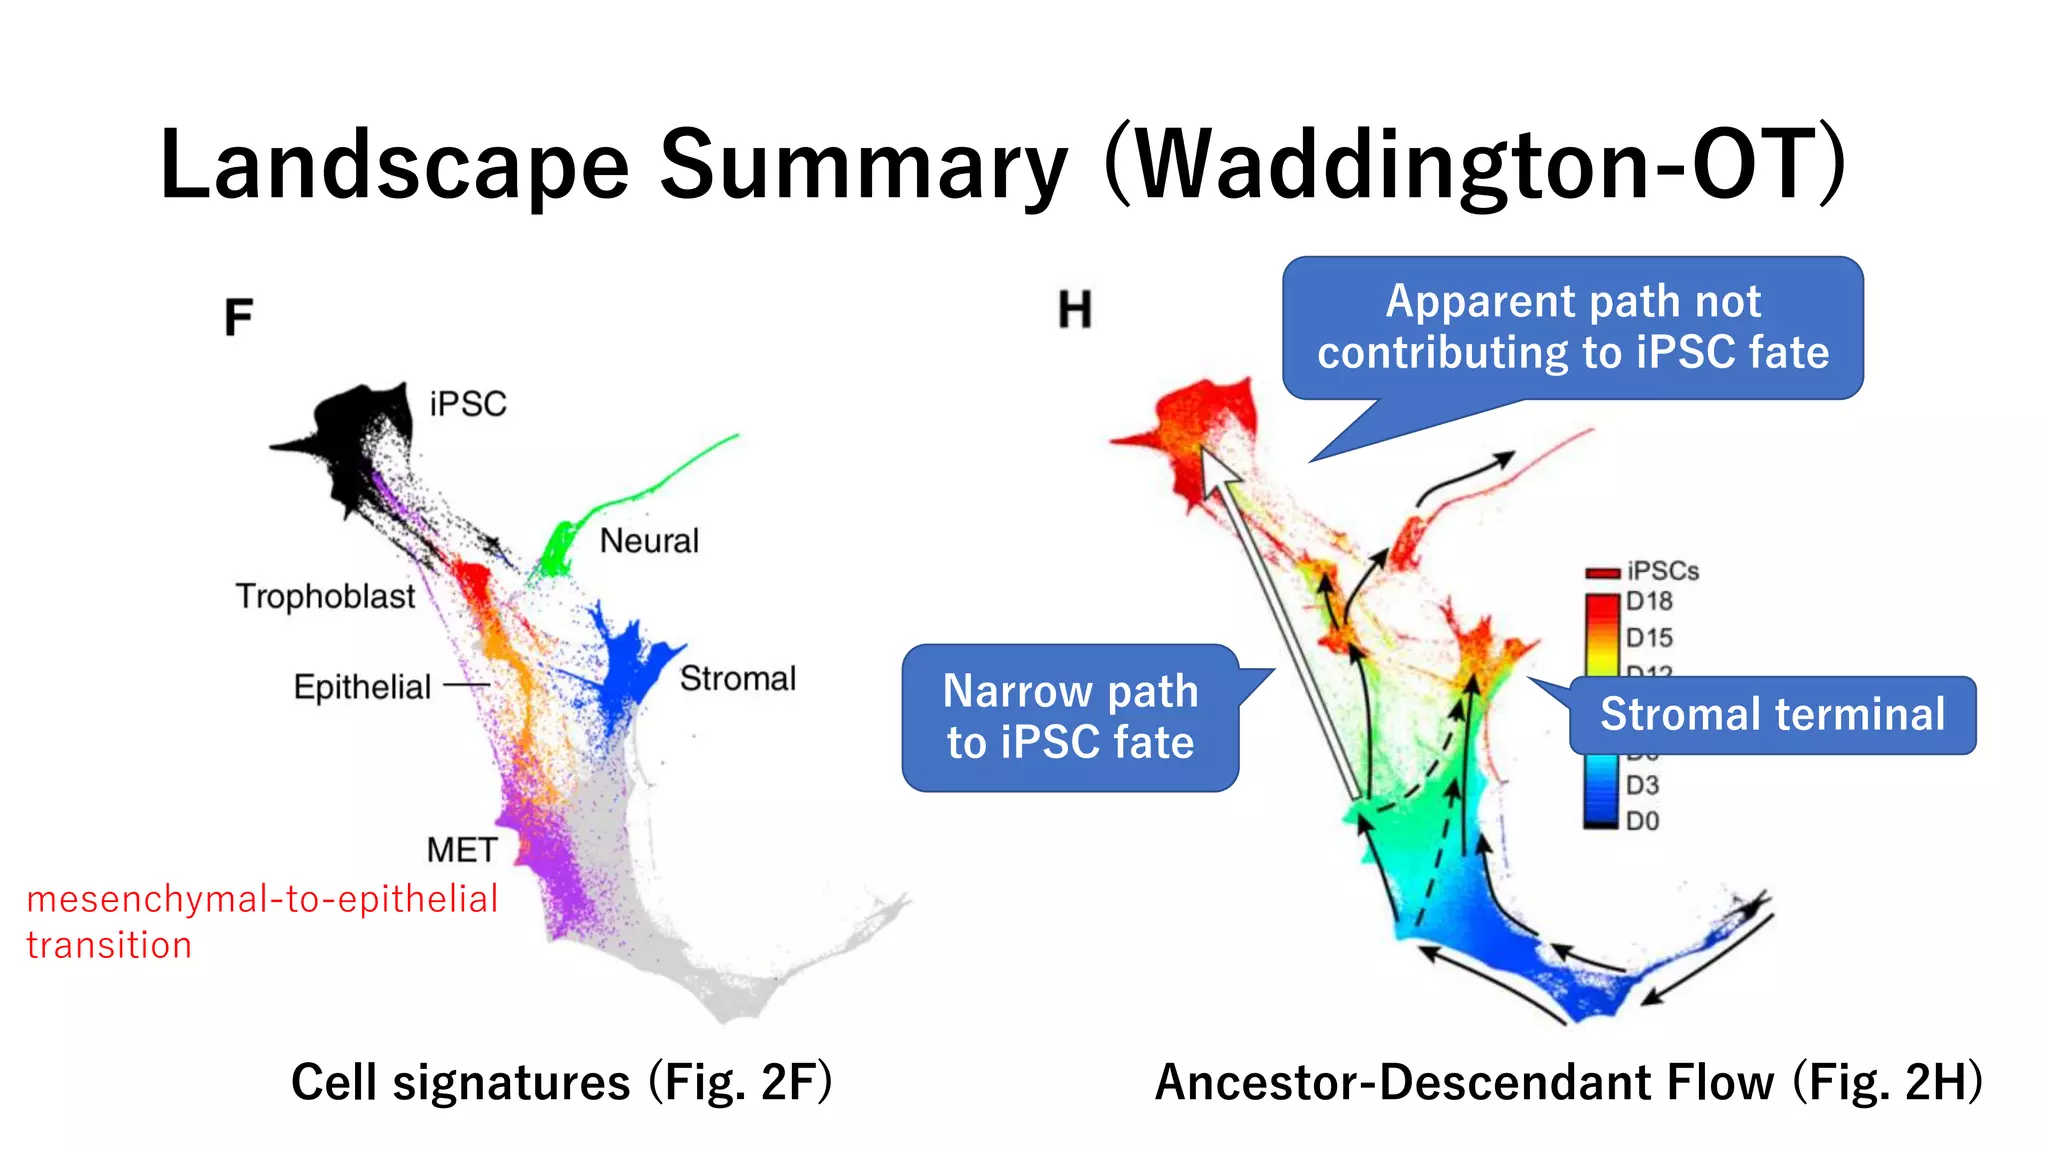
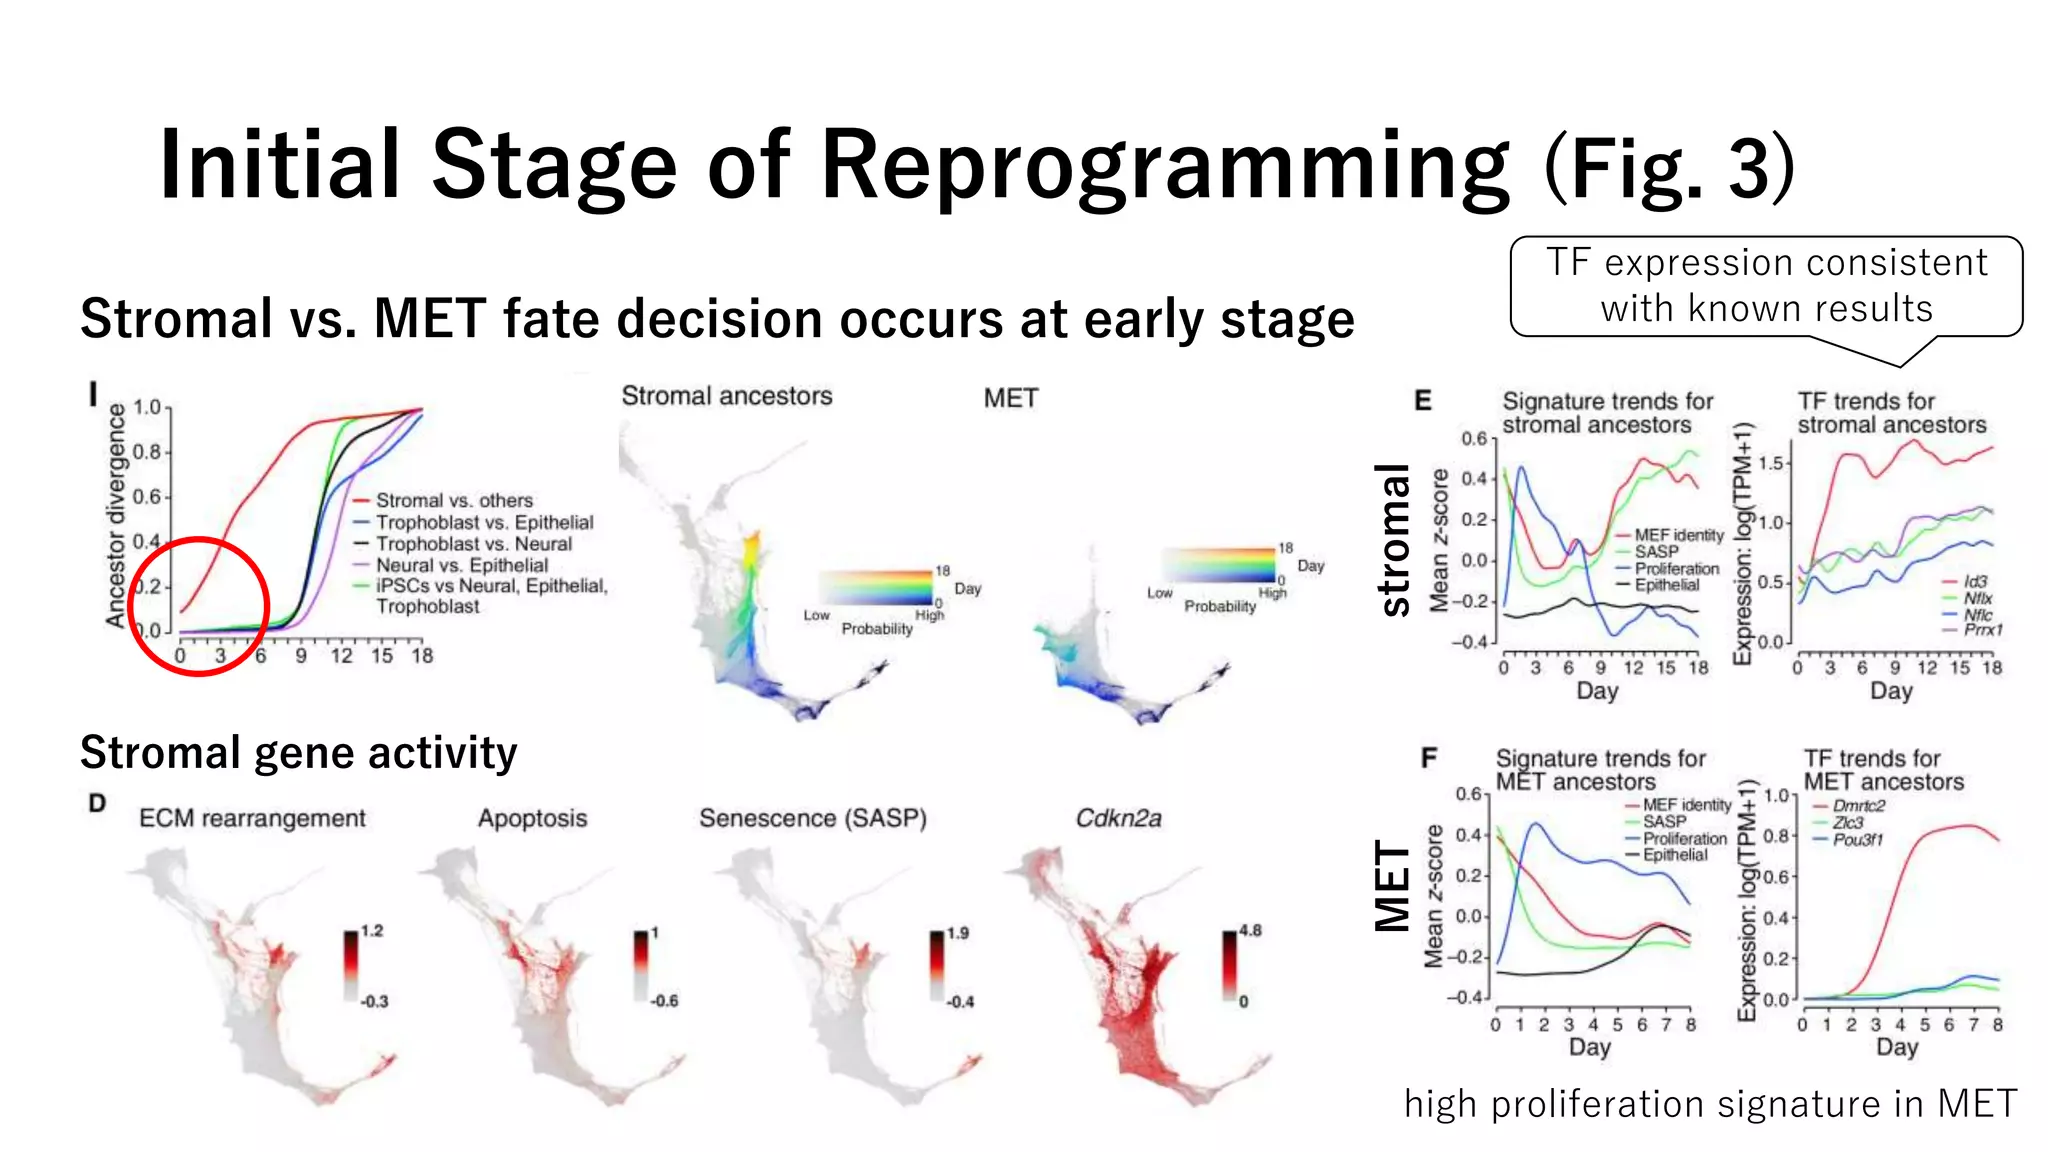
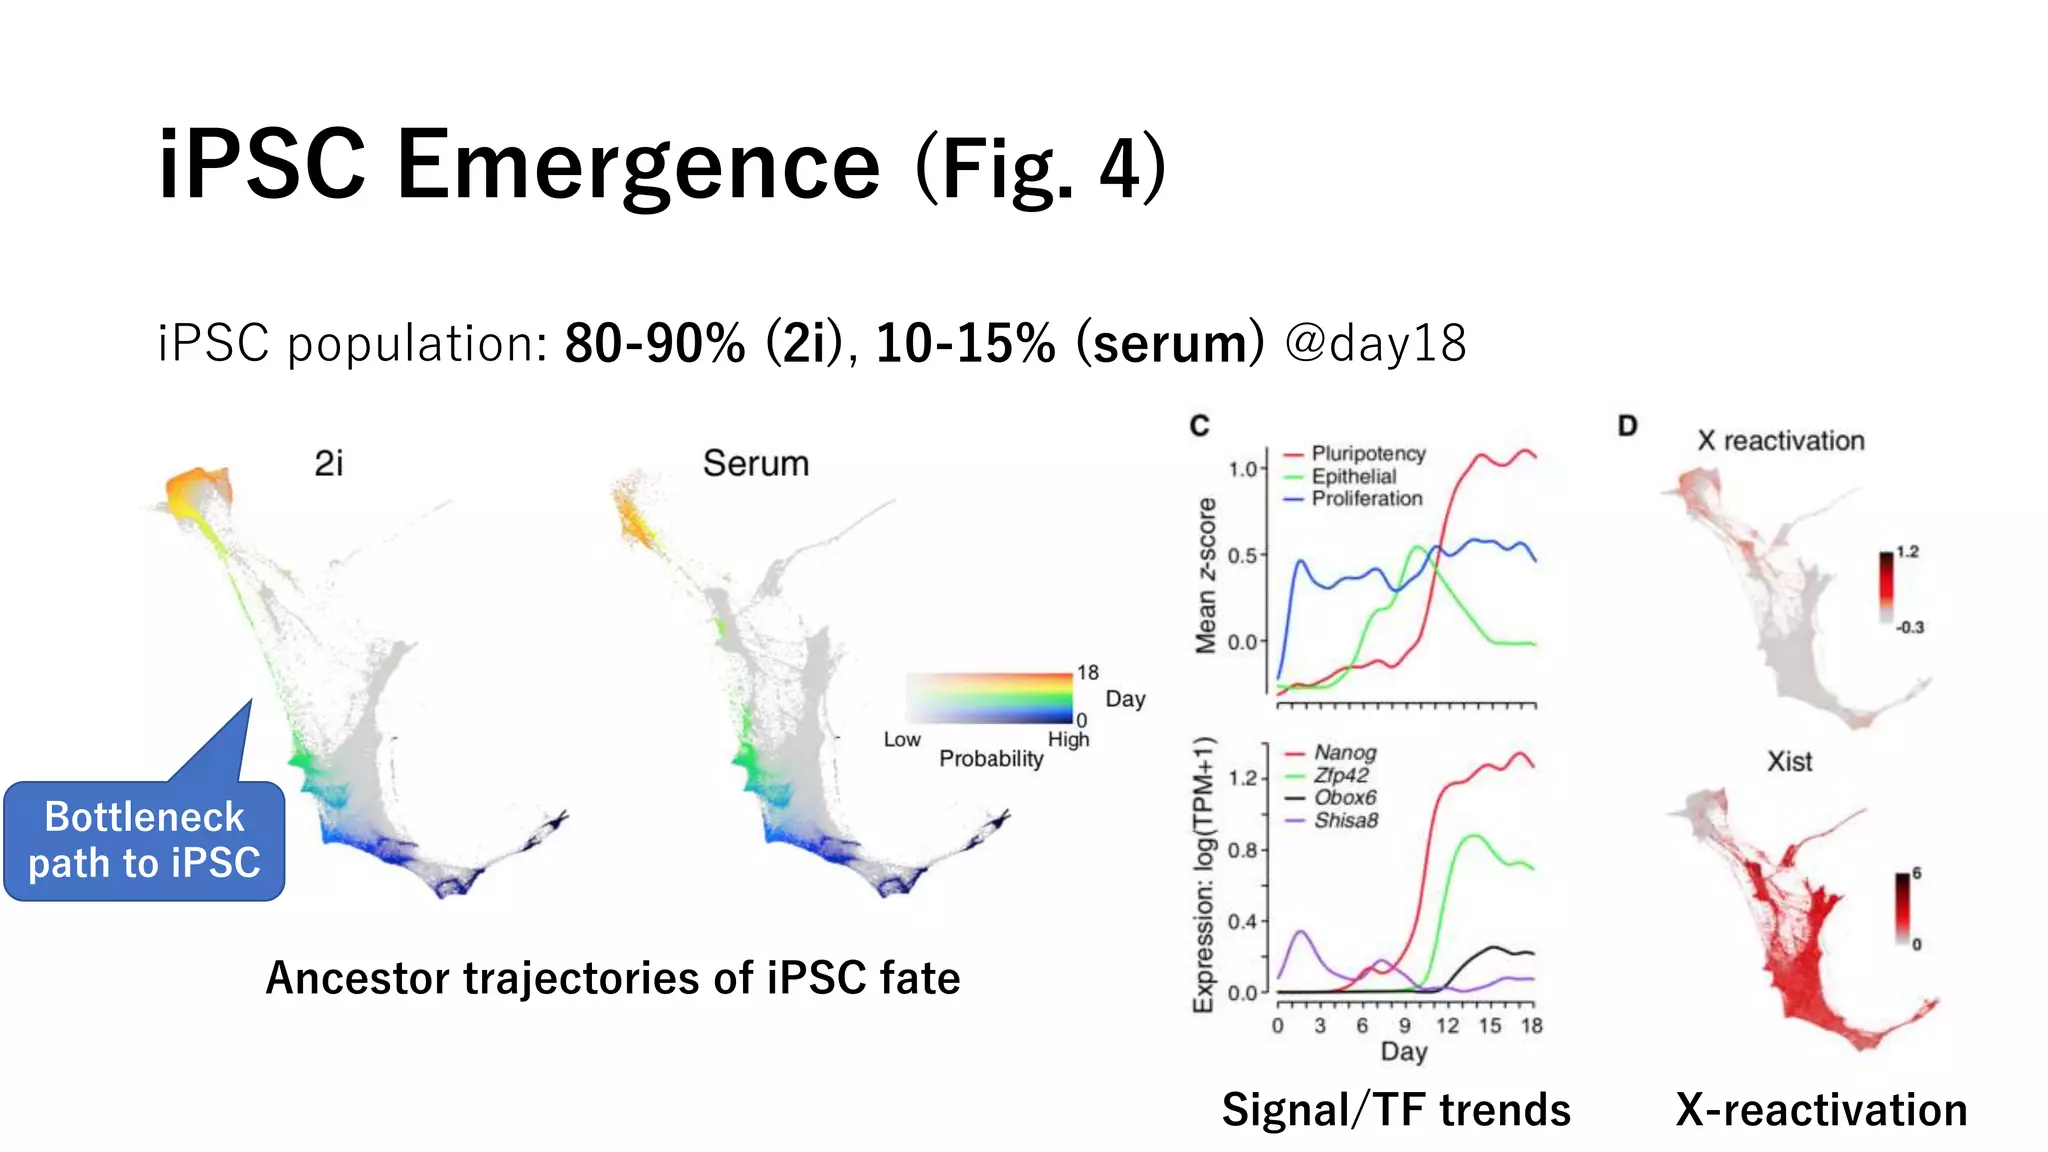
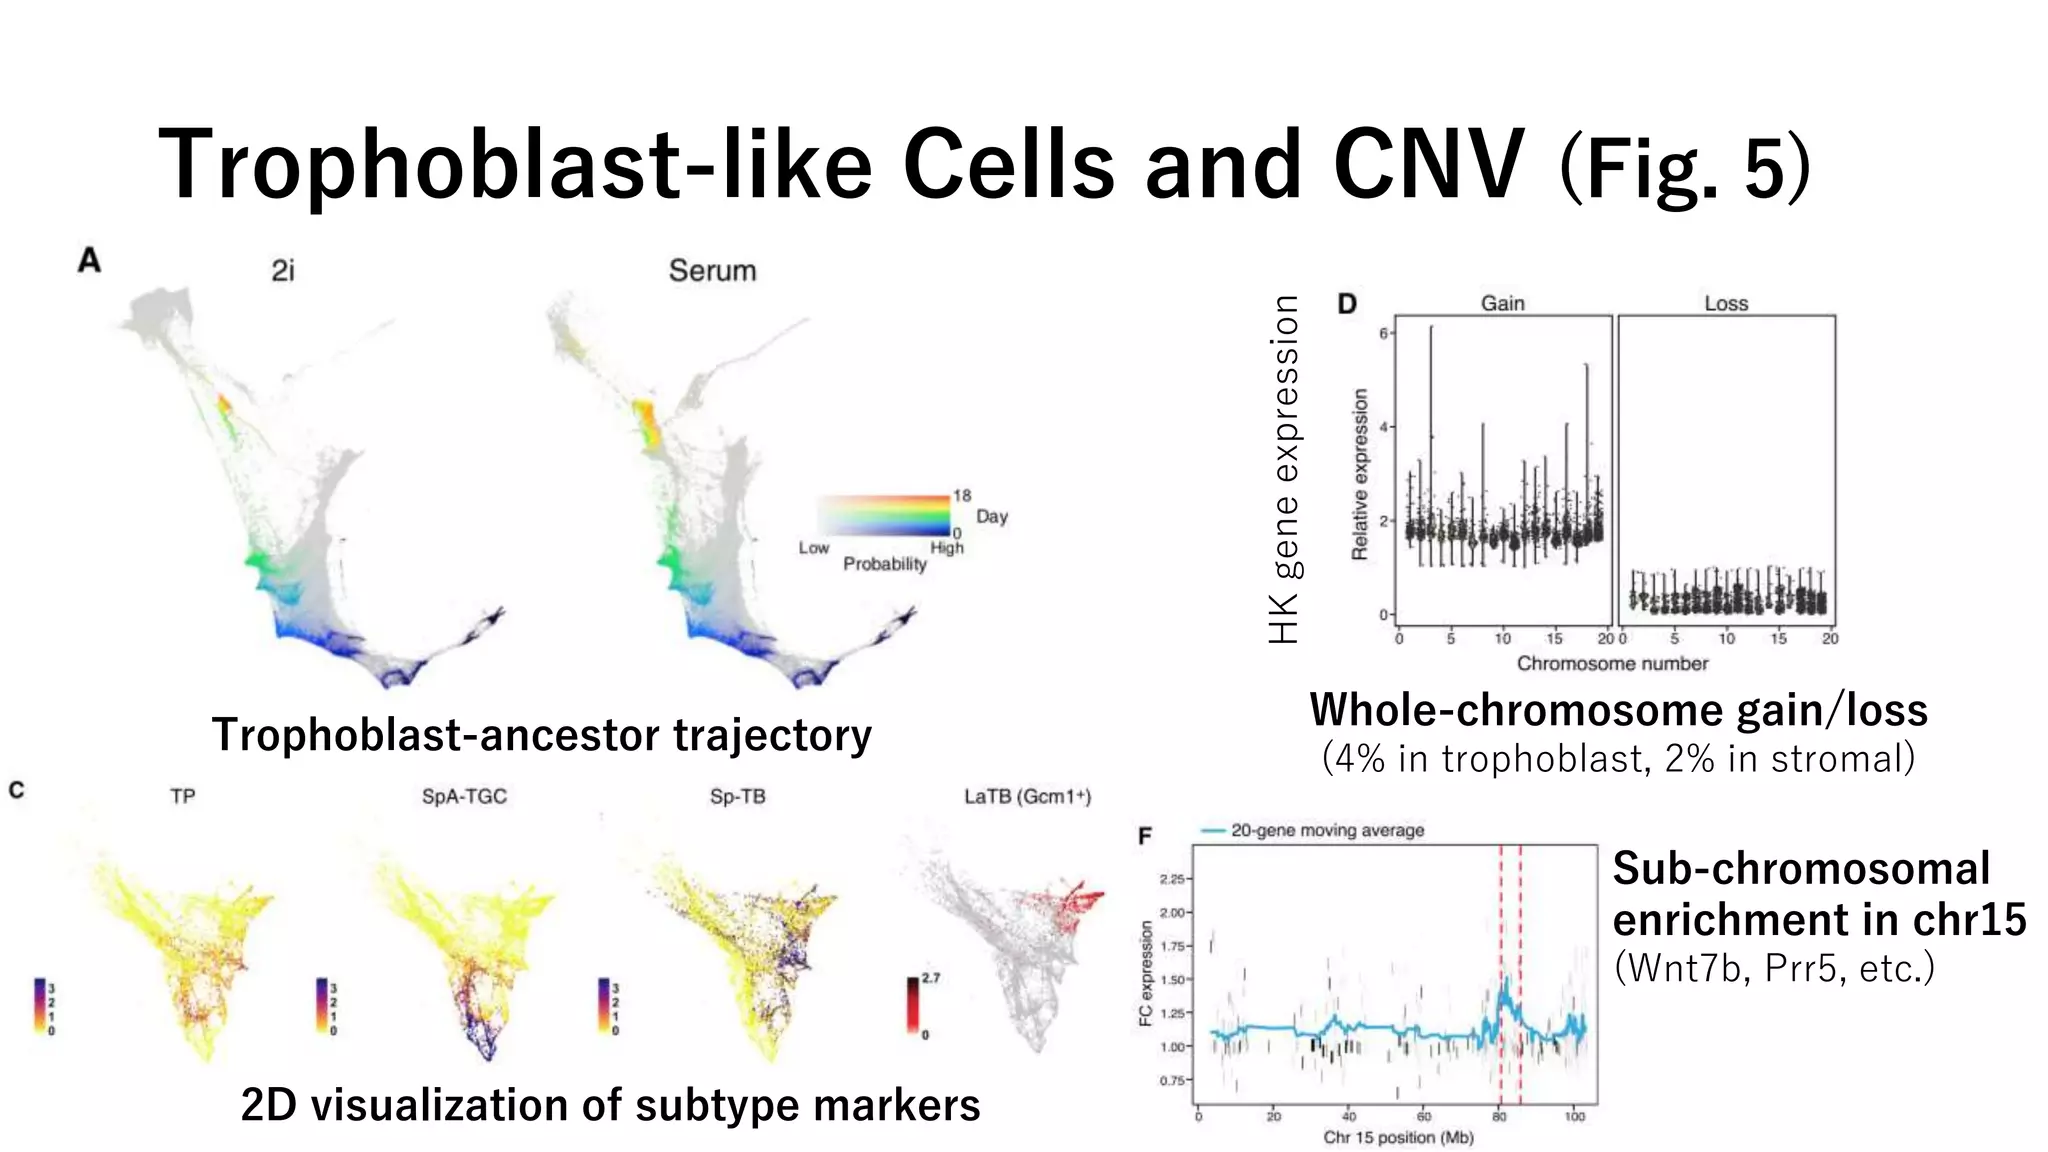
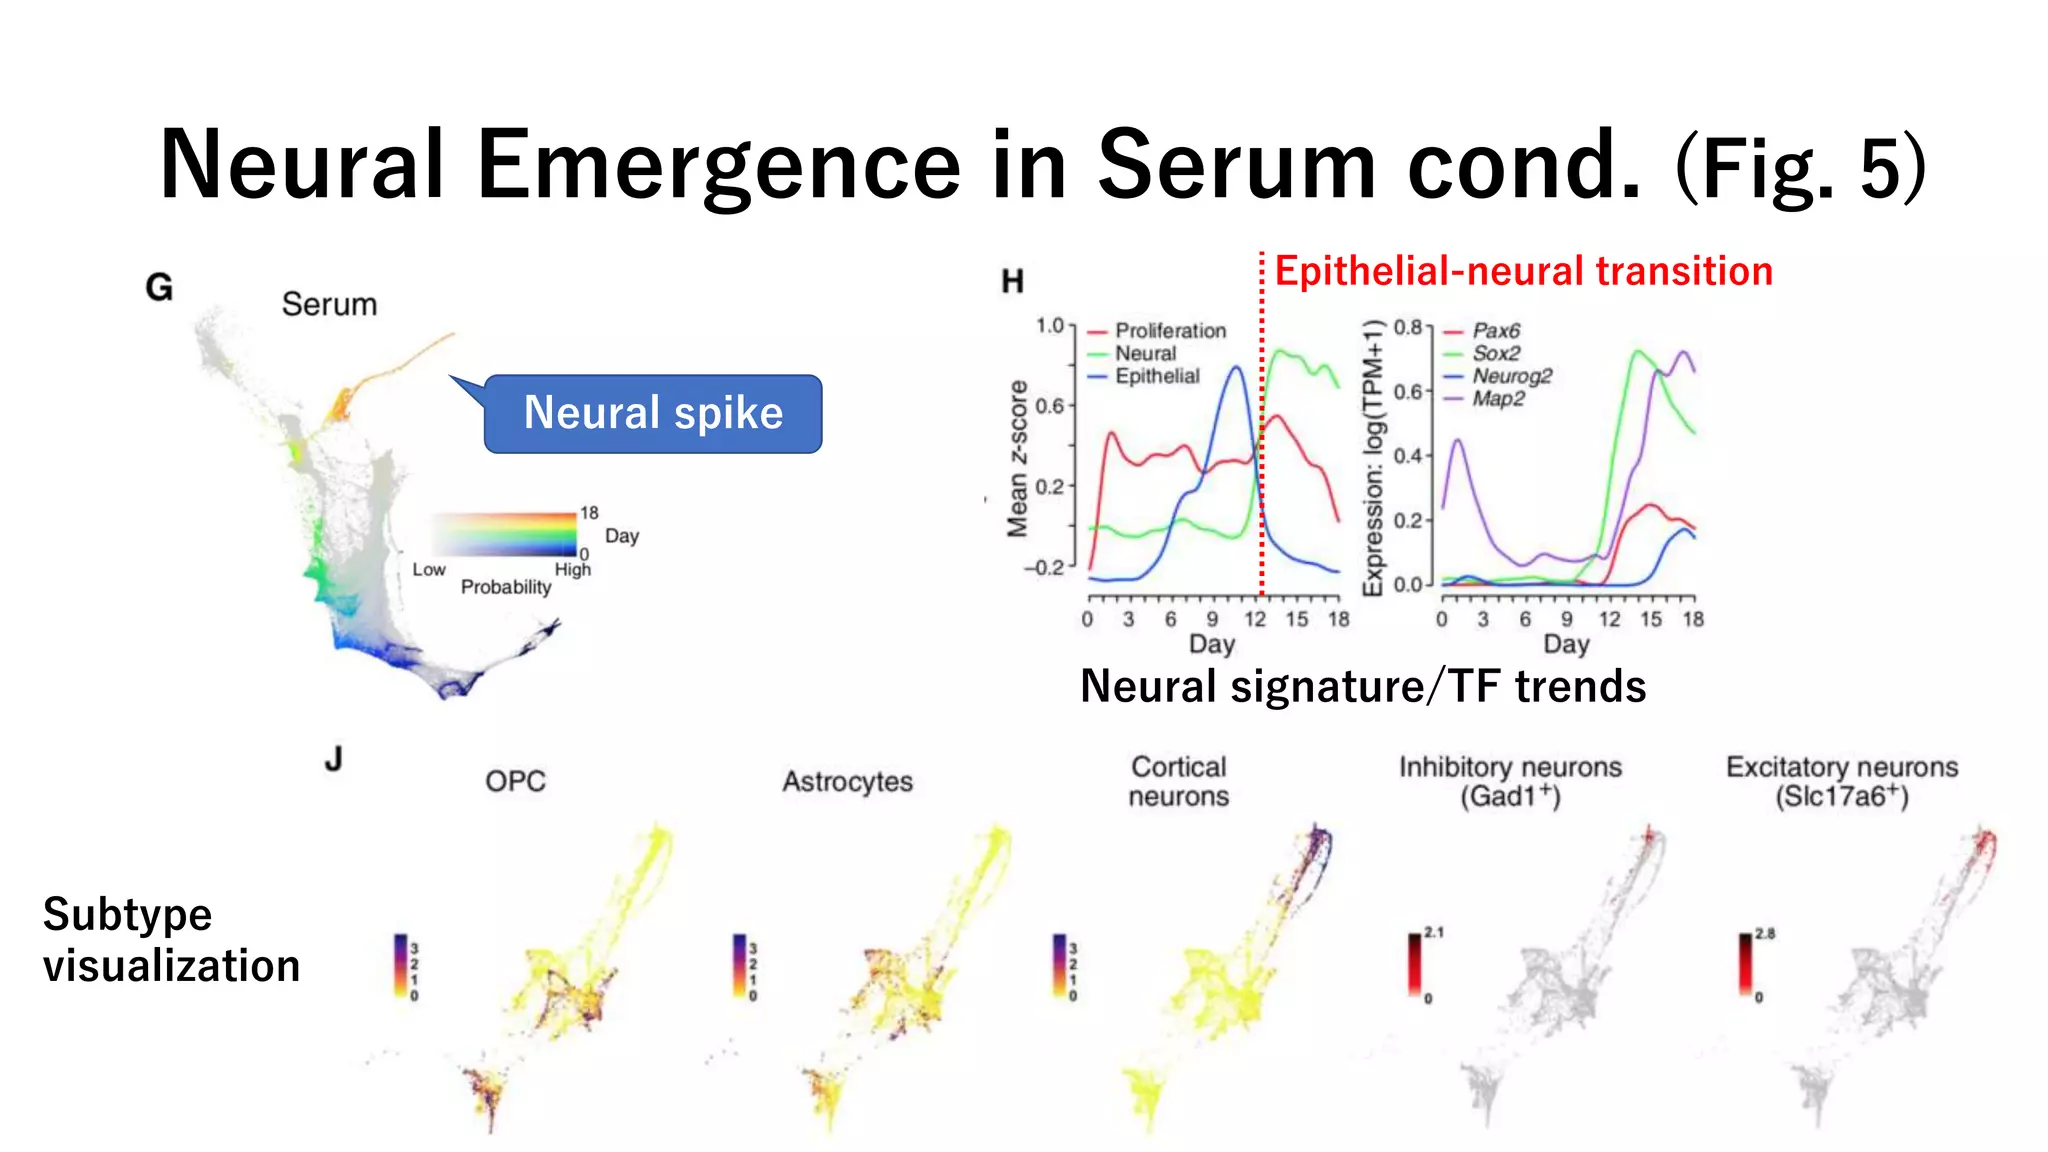
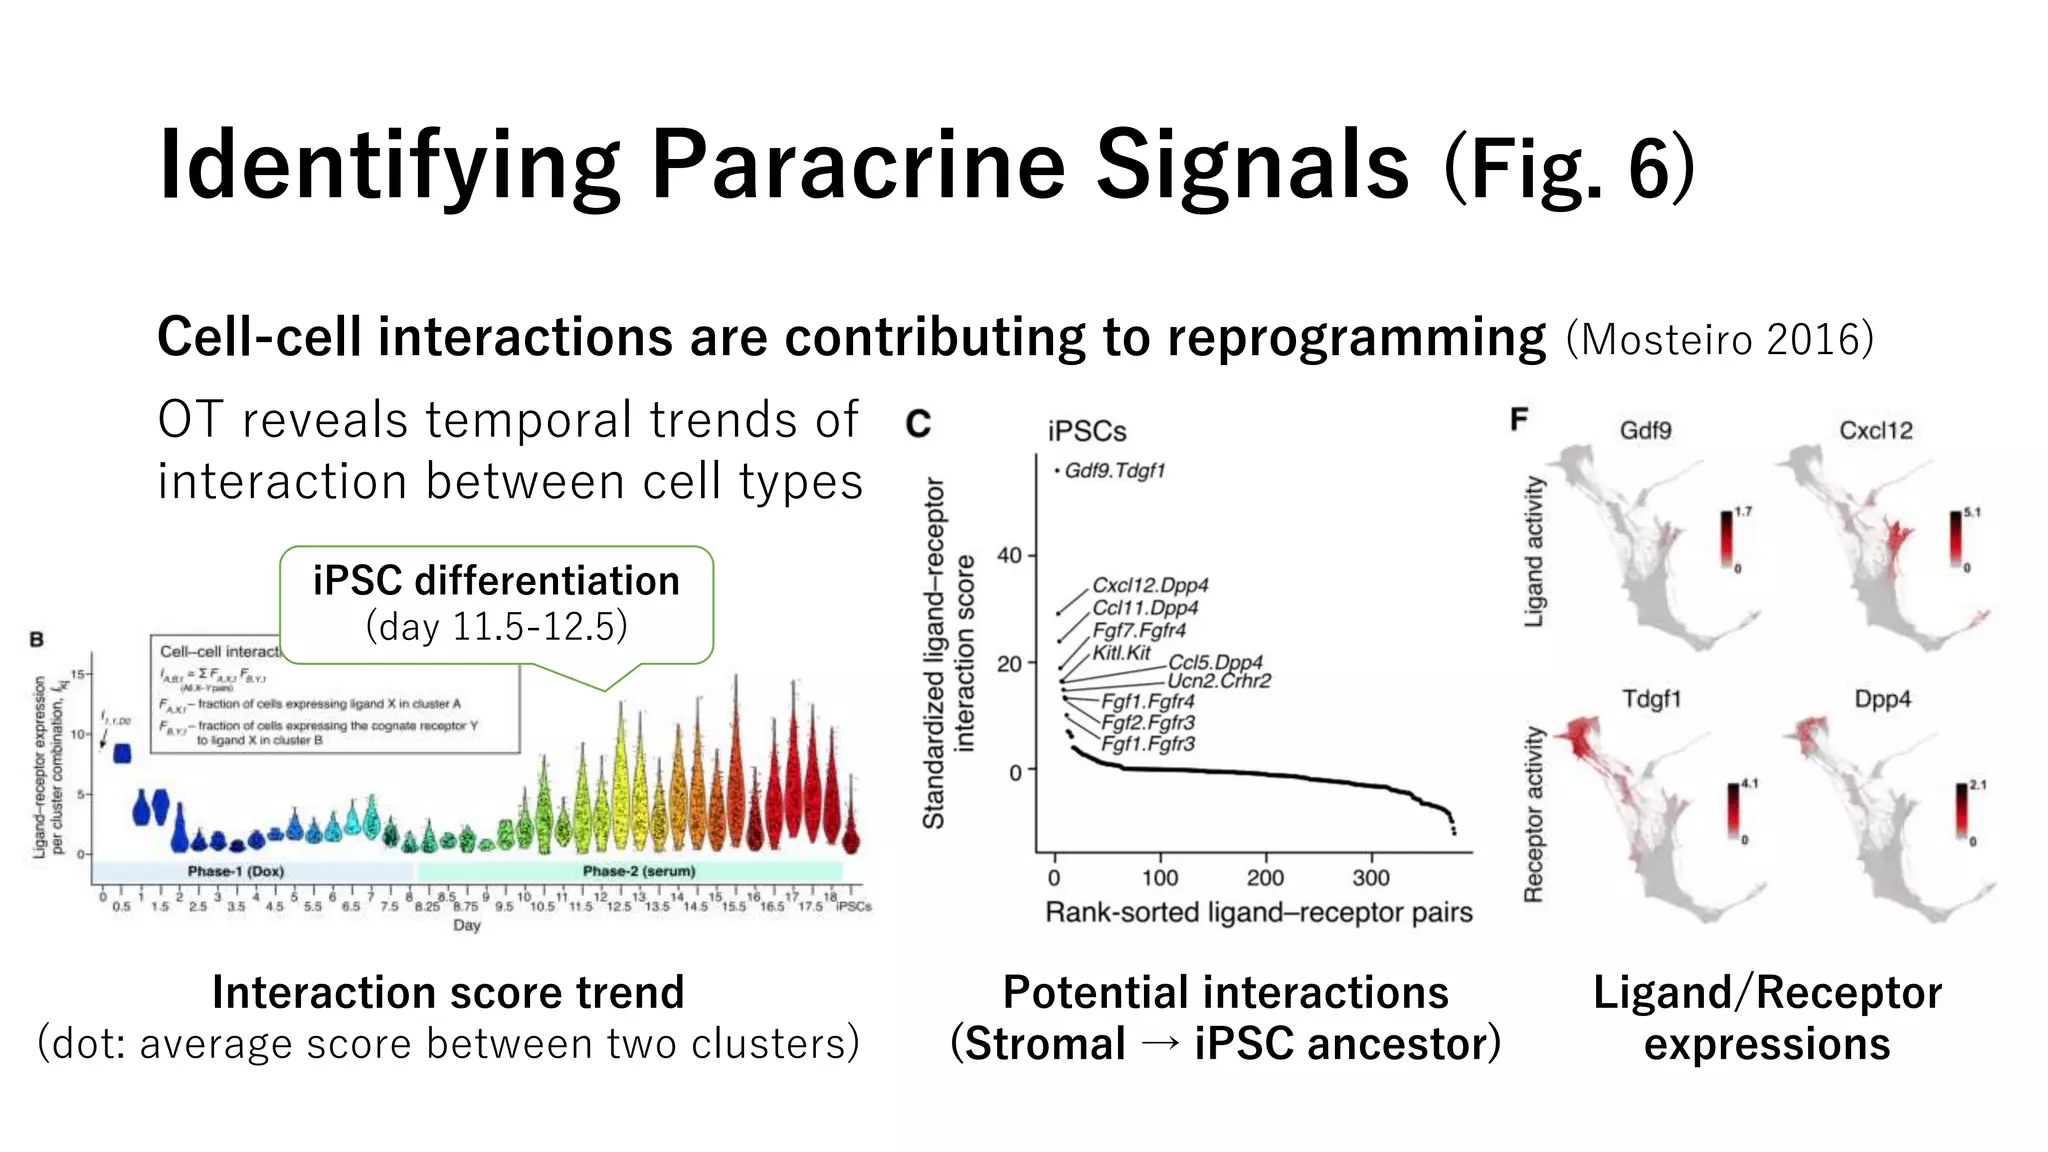
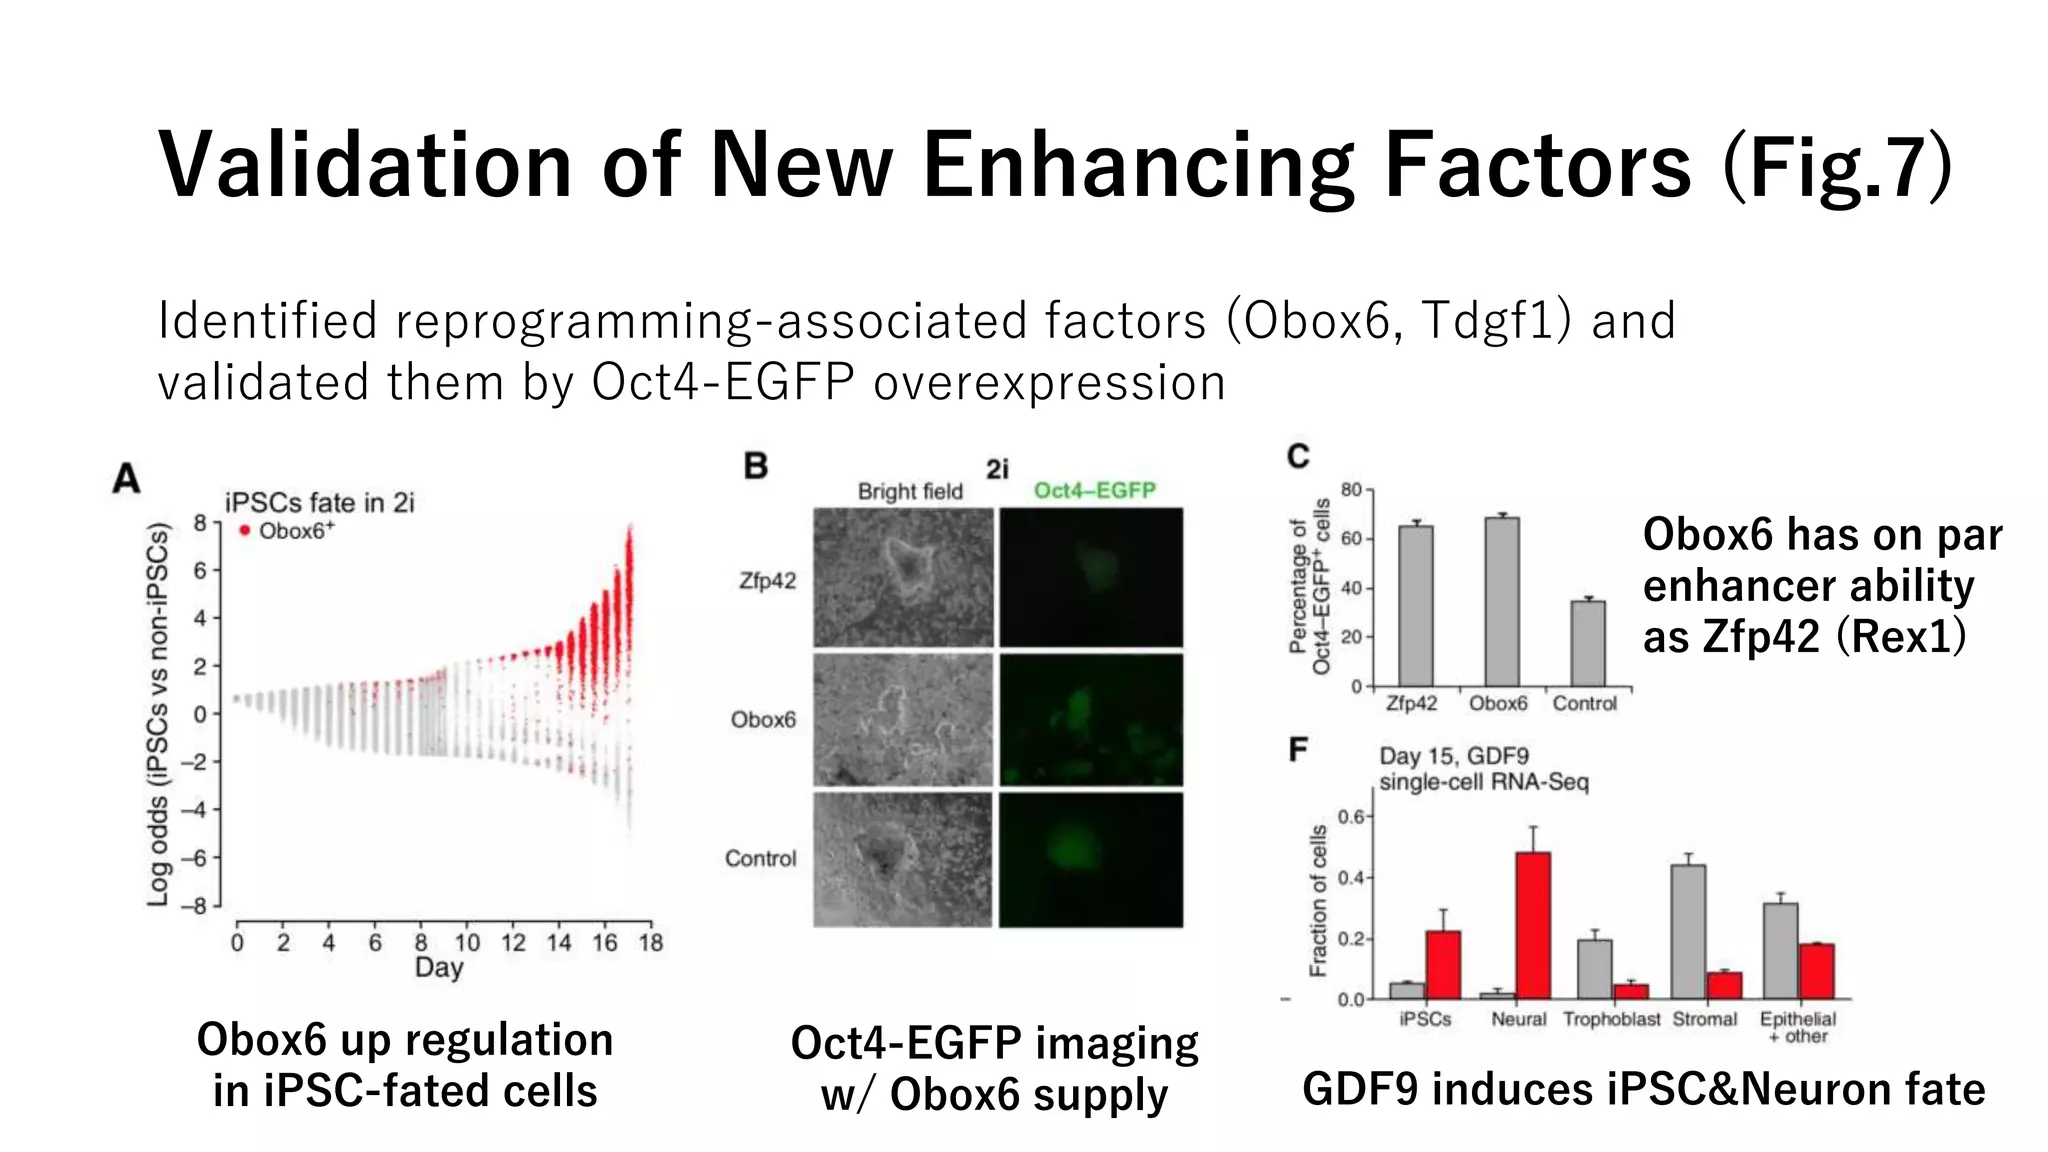
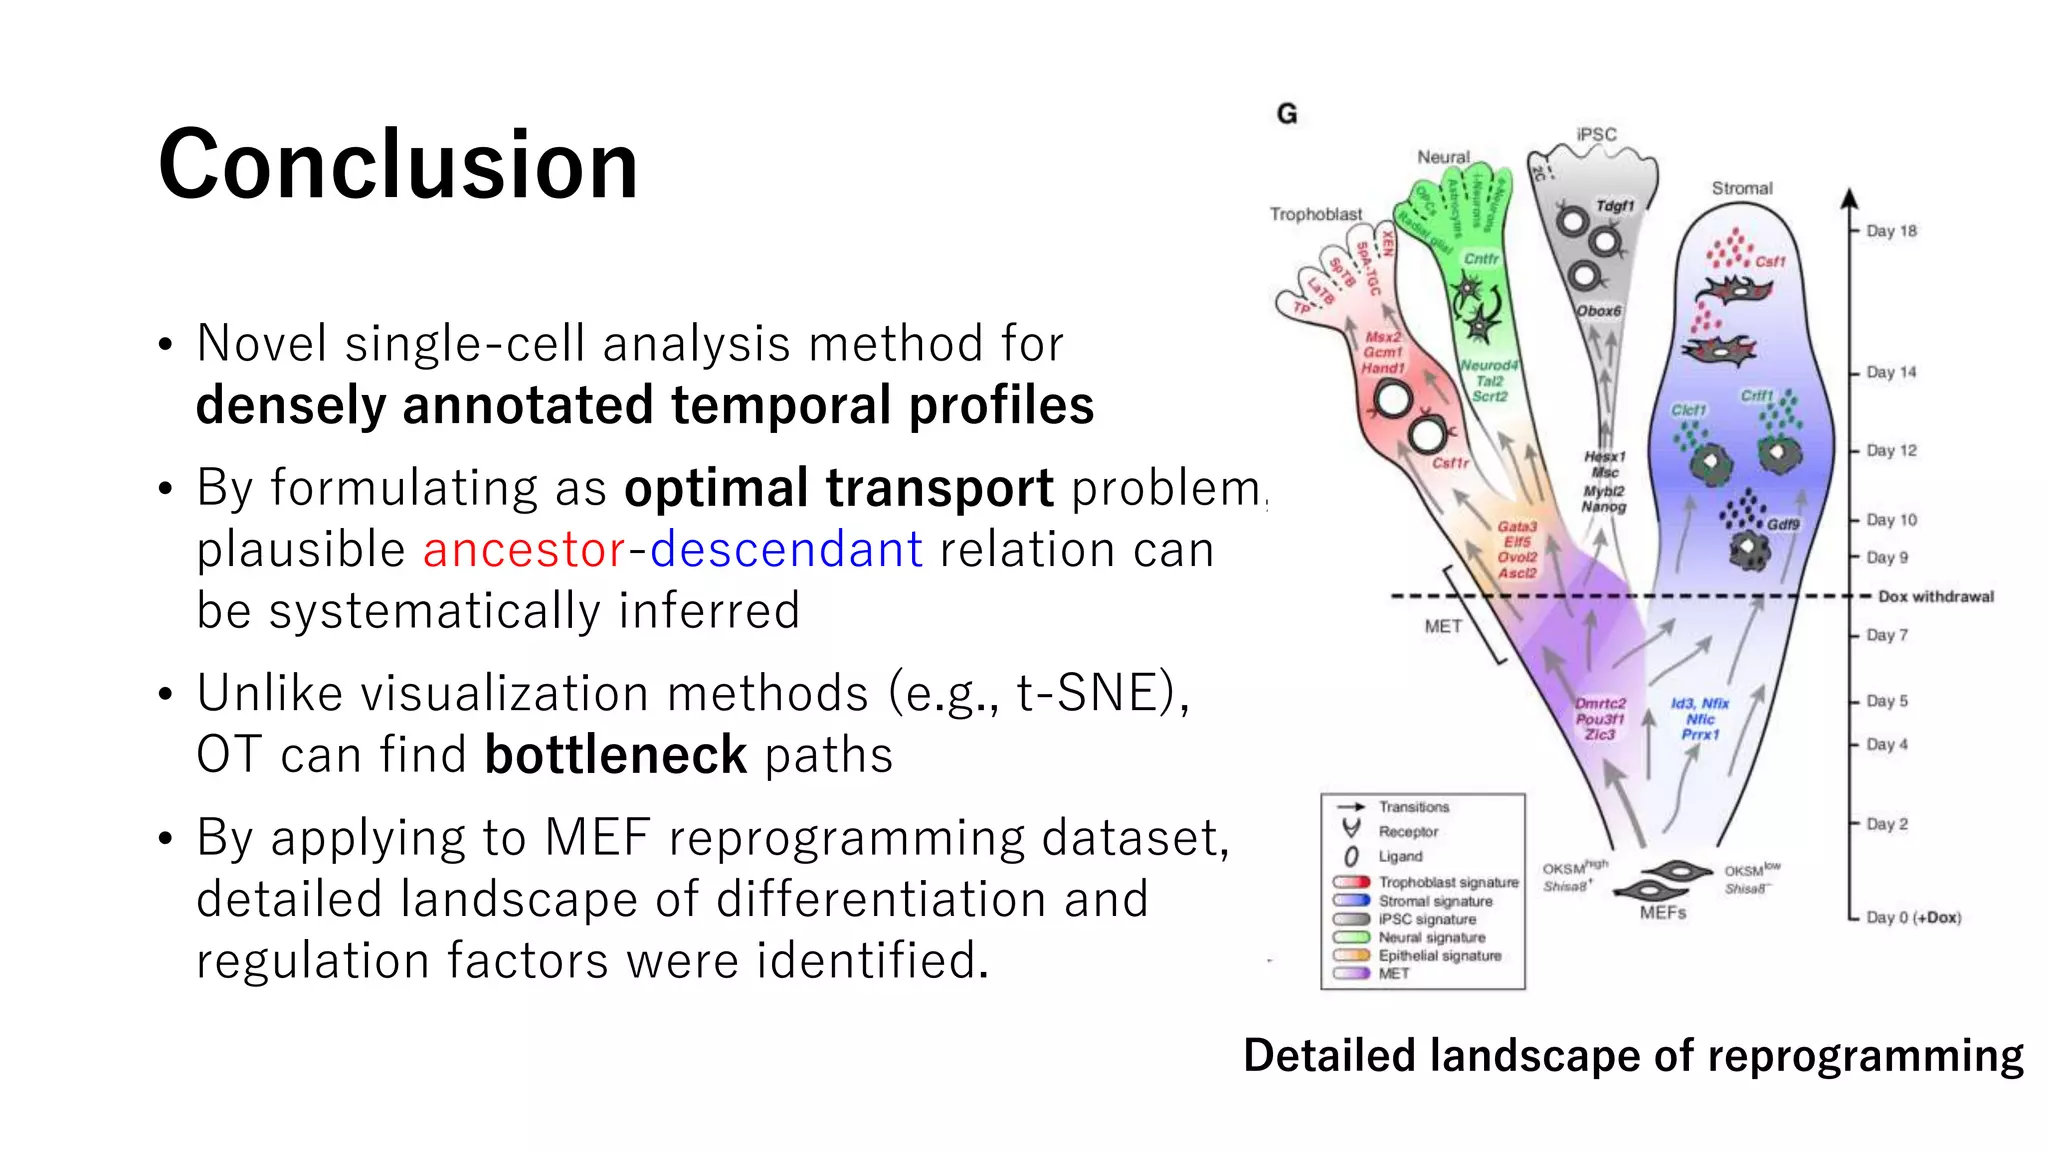
Optimal-Transport Analysis of Single-Cell
Gene Expression Identifies Developmental
Trajectories in Reprogramming
G. Schiebinger, J. Shu, M. Tabaka,
..., A. Regev, E. Lander (Broad Institute)
2019, Cell 176, 928—943
https://doi.org/10.1016/j.cell.2019.01.006
Paper reading memo
Waddington’s Landscape (1940)
progenitor cell
cell fates
intermediate
states
Conceptual model of differentiation
from dynamical point of view
• Cell linages follow paths of cell states
determined by stability or “free energy”
• Complete description of the landscape is
a Holy Grail for biophysicists (if exists)
Questions
• How is the geometry of landscape in real
processes e.g., development and reprogramming?
• What regulatory programs are controlling it?
scRNA-seq and Trajectory Inference
Pseudotemporal Ordering (PT)
• Input: snapshot(s) of single-cell transcriptomic profiles
• Output: inferred temporal ordering of individual cells
Expression Matrix
Cells
Genes
dimension reduction
graph theoretical
estimation, etc.
2D embedding
bifurcation
Trapnel et al.,
Incorporating Real Temporal Information
Single snapshot is not sufficient for nonequilibrium dynamics
→ how to use a time-series (movie) of single-cell profiles?
(1)Naïve merging
(e.g., Monocle 2, AGA, etc.)
(2)Differential analysis
(e.g., SCdiff, GPfates)
→ generate inconsistent ordering! → no method can handle dynamic population
change (proliferation, apoptosis)
Waddington-OT (proposed method)
Mathematical framework for inferring descendant (ancestor)
cells in succeeding (preceding) time-slices of a given cell group.
time
single
time-slice
cells of interest
dominant descendants
Cell Trajectory as Transport Problem
Problem: actual ancestor/descendant relationship is inevitably
lost during the experiment (cells must be killed for RNA-seq)
Goal: inferring most likely (=minimum cost) correspondence
between cells in subsequent time-slices
Profiles independently
sampled at each period
Inferred most-likely
cell correspondences
Time-dependent
distributions
original distribution
P1
target distribution
P2
Optimal Transport (OT)
Original motivation: minimize earth movement to build a fort
= calculating optimal way to transform between two distributions
Image from http://people.irisa.fr/Nicolas.Courty/OATMIL/
P3
P2
P1
(cell distributions)
Reprogramming of MEF to iPSCs
• Mouse Embryonic Fibroblast cells
recover pluripotency by inducing OKSM
factors (Oct-4, Klf4, SOX-2, c-Myc)
(Takahashi & Yamanaka 2006)
• Detailed (single-cell scale) mechanism
of reprogramming is yet unclear
• What transcription factors matter?
• What kinds of alternative fates?
→ densely temporal single-cell study
Overview of the Study
Target: MEF → iPSC reprogramming
Measurement: 18 days, sequencing in 12-hour cycle
Sample size: >315,000 cells
Analysis method: Temporal analysis with help of OT
Research questions
• What classes of cells arise in reprogramming?
• What are the developmental paths to iPSC and other fates?
• Which factors / interactions contribute to reprogramming?
Essence of Waddington-OT (1)
← Wasserstein distance
= transition rate between two successive time slices
→ long-range coupling
cost
Basic formulation of optimal transport
descendant prob.
Essence of Waddington-OT (2)
Taking Proliferation and Apoptosis into account
iPSC stromal
T=s
T=t
Stromal cell has differentiated to iPSC??
Rescaling by growth function
Relative growth ratio at x
iPSC stromal
Experiment Protocol (Fig. 2A)
scRNA-seq Time Course (Fig. 2D-F)
2D visualization by
FLE method
(force-directed
layout embedding)
Landscape Summary (Waddington-OT)
Cell signatures (Fig. 2F) Ancestor-Descendant Flow (Fig. 2H)
Narrow path
to iPSC fate
Apparent path not
contributing to iPSC fate
Stromal terminal
mesenchymal-to-epithelial
transition
Initial Stage of Reprogramming (Fig. 3)
Stromal vs. MET fate decision occurs at early stage
Stromal gene activity
high proliferation signature in MET
TF expression consistent
with known results
stromalMET
iPSC Emergence (Fig. 4)
iPSC population: 80-90% (2i), 10-15% (serum) @day18
Ancestor trajectories of iPSC fate
Bottleneck
path to iPSC
Signal/TF trends X-reactivation
Trophoblast-like Cells and CNV (Fig. 5)
Trophoblast-ancestor trajectory
2D visualization of subtype markers
Whole-chromosome gain/loss
(4% in trophoblast, 2% in stromal)
HKgeneexpression
Sub-chromosomal
enrichment in chr15
(Wnt7b, Prr5, etc.)
Neural Emergence in Serum cond. (Fig. 5)
Neural signature/TF trends
Neural spike
Subtype
visualization
Epithelial-neural transition
Identifying Paracrine Signals (Fig. 6)
Potential interactions
(Stromal → iPSC ancestor)
Ligand/Receptor
expressions
Cell-cell interactions are contributing to reprogramming (Mosteiro 2016)
OT reveals temporal trends of
interaction between cell types
Interaction score trend
(dot: average score between two clusters)
iPSC differentiation
(day 11.5-12.5)
Validation of New Enhancing Factors (Fig.7)
Identified reprogramming-associated factors (Obox6, Tdgf1) and
validated them by Oct4-EGFP overexpression
Obox6 up regulation
in iPSC-fated cells
Oct4-EGFP imaging
w/ Obox6 supply GDF9 induces iPSC&Neuron fate
Obox6 has on par
enhancer ability
as Zfp42 (Rex1)
Conclusion
• Novel single-cell analysis method for
densely annotated temporal profiles
• By formulating as optimal transport problem,
plausible ancestor-descendant relation can
be systematically inferred
• Unlike visualization methods (e.g., t-SNE),
OT can find bottleneck paths
• By applying to MEF reprogramming dataset,
detailed landscape of differentiation and
regulation factors were identified.
Detailed landscape of reprogramming
Impressions
• Very effective analysis method that genuinely exploits the
information of dense temporal profiling (unlike naïve merging)
• Mathematical background is clear and concise, minimum
assumption about the stochastic dynamics (Markovianity)
• Extendable to incorporate epigenomic information
• Only applicable to irreversible process (no cycle, steady state)
• Robustness against bias & variation? (more validation needed)

Paper memo: Optimal-Transport Analysis of Single-Cell Gene Expression Identifies Developmental Trajectories in Reprogramming

  • 1.
    Optimal-Transport Analysis ofSingle-Cell Gene Expression Identifies Developmental Trajectories in Reprogramming G. Schiebinger, J. Shu, M. Tabaka, ..., A. Regev, E. Lander (Broad Institute) 2019, Cell 176, 928—943 https://doi.org/10.1016/j.cell.2019.01.006 Paper reading memo
  • 2.
    Waddington’s Landscape (1940) progenitorcell cell fates intermediate states Conceptual model of differentiation from dynamical point of view • Cell linages follow paths of cell states determined by stability or “free energy” • Complete description of the landscape is a Holy Grail for biophysicists (if exists) Questions • How is the geometry of landscape in real processes e.g., development and reprogramming? • What regulatory programs are controlling it?
  • 3.
    scRNA-seq and TrajectoryInference Pseudotemporal Ordering (PT) • Input: snapshot(s) of single-cell transcriptomic profiles • Output: inferred temporal ordering of individual cells Expression Matrix Cells Genes dimension reduction graph theoretical estimation, etc. 2D embedding bifurcation Trapnel et al.,
  • 4.
    Incorporating Real TemporalInformation Single snapshot is not sufficient for nonequilibrium dynamics → how to use a time-series (movie) of single-cell profiles? (1)Naïve merging (e.g., Monocle 2, AGA, etc.) (2)Differential analysis (e.g., SCdiff, GPfates) → generate inconsistent ordering! → no method can handle dynamic population change (proliferation, apoptosis)
  • 5.
    Waddington-OT (proposed method) Mathematicalframework for inferring descendant (ancestor) cells in succeeding (preceding) time-slices of a given cell group. time single time-slice cells of interest dominant descendants
  • 6.
    Cell Trajectory asTransport Problem Problem: actual ancestor/descendant relationship is inevitably lost during the experiment (cells must be killed for RNA-seq) Goal: inferring most likely (=minimum cost) correspondence between cells in subsequent time-slices Profiles independently sampled at each period Inferred most-likely cell correspondences Time-dependent distributions
  • 7.
    original distribution P1 target distribution P2 OptimalTransport (OT) Original motivation: minimize earth movement to build a fort = calculating optimal way to transform between two distributions Image from http://people.irisa.fr/Nicolas.Courty/OATMIL/ P3 P2 P1 (cell distributions)
  • 8.
    Reprogramming of MEFto iPSCs • Mouse Embryonic Fibroblast cells recover pluripotency by inducing OKSM factors (Oct-4, Klf4, SOX-2, c-Myc) (Takahashi & Yamanaka 2006) • Detailed (single-cell scale) mechanism of reprogramming is yet unclear • What transcription factors matter? • What kinds of alternative fates? → densely temporal single-cell study
  • 9.
    Overview of theStudy Target: MEF → iPSC reprogramming Measurement: 18 days, sequencing in 12-hour cycle Sample size: >315,000 cells Analysis method: Temporal analysis with help of OT Research questions • What classes of cells arise in reprogramming? • What are the developmental paths to iPSC and other fates? • Which factors / interactions contribute to reprogramming?
  • 10.
    Essence of Waddington-OT(1) ← Wasserstein distance = transition rate between two successive time slices → long-range coupling cost Basic formulation of optimal transport descendant prob.
  • 11.
    Essence of Waddington-OT(2) Taking Proliferation and Apoptosis into account iPSC stromal T=s T=t Stromal cell has differentiated to iPSC?? Rescaling by growth function Relative growth ratio at x iPSC stromal
  • 12.
  • 13.
    scRNA-seq Time Course(Fig. 2D-F) 2D visualization by FLE method (force-directed layout embedding)
  • 14.
    Landscape Summary (Waddington-OT) Cellsignatures (Fig. 2F) Ancestor-Descendant Flow (Fig. 2H) Narrow path to iPSC fate Apparent path not contributing to iPSC fate Stromal terminal mesenchymal-to-epithelial transition
  • 15.
    Initial Stage ofReprogramming (Fig. 3) Stromal vs. MET fate decision occurs at early stage Stromal gene activity high proliferation signature in MET TF expression consistent with known results stromalMET
  • 16.
    iPSC Emergence (Fig.4) iPSC population: 80-90% (2i), 10-15% (serum) @day18 Ancestor trajectories of iPSC fate Bottleneck path to iPSC Signal/TF trends X-reactivation
  • 17.
    Trophoblast-like Cells andCNV (Fig. 5) Trophoblast-ancestor trajectory 2D visualization of subtype markers Whole-chromosome gain/loss (4% in trophoblast, 2% in stromal) HKgeneexpression Sub-chromosomal enrichment in chr15 (Wnt7b, Prr5, etc.)
  • 18.
    Neural Emergence inSerum cond. (Fig. 5) Neural signature/TF trends Neural spike Subtype visualization Epithelial-neural transition
  • 19.
    Identifying Paracrine Signals(Fig. 6) Potential interactions (Stromal → iPSC ancestor) Ligand/Receptor expressions Cell-cell interactions are contributing to reprogramming (Mosteiro 2016) OT reveals temporal trends of interaction between cell types Interaction score trend (dot: average score between two clusters) iPSC differentiation (day 11.5-12.5)
  • 20.
    Validation of NewEnhancing Factors (Fig.7) Identified reprogramming-associated factors (Obox6, Tdgf1) and validated them by Oct4-EGFP overexpression Obox6 up regulation in iPSC-fated cells Oct4-EGFP imaging w/ Obox6 supply GDF9 induces iPSC&Neuron fate Obox6 has on par enhancer ability as Zfp42 (Rex1)
  • 21.
    Conclusion • Novel single-cellanalysis method for densely annotated temporal profiles • By formulating as optimal transport problem, plausible ancestor-descendant relation can be systematically inferred • Unlike visualization methods (e.g., t-SNE), OT can find bottleneck paths • By applying to MEF reprogramming dataset, detailed landscape of differentiation and regulation factors were identified. Detailed landscape of reprogramming
  • 22.
    Impressions • Very effectiveanalysis method that genuinely exploits the information of dense temporal profiling (unlike naïve merging) • Mathematical background is clear and concise, minimum assumption about the stochastic dynamics (Markovianity) • Extendable to incorporate epigenomic information • Only applicable to irreversible process (no cycle, steady state) • Robustness against bias & variation? (more validation needed)

Editor's Notes

  • #5 Temporal dataを使っていても個別の細胞の動きは追えない→次のスライドへ
  • #10 ここまでイントロダクションパート