Download to read offline


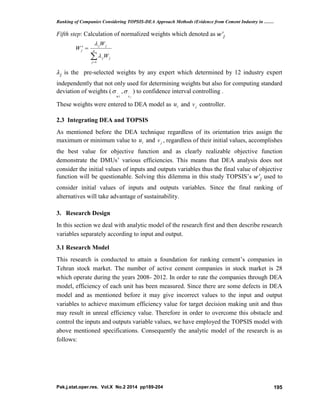
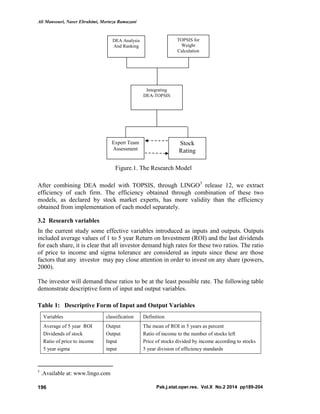

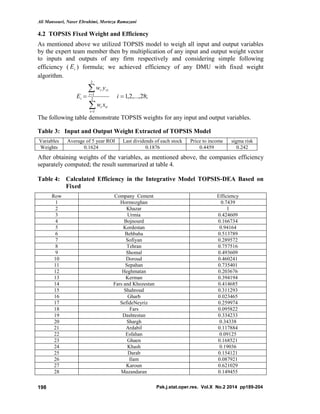


This document describes a study that uses an integrated TOPSIS-DEA approach to rank cement companies listed on the Tehran Stock Exchange. The study evaluates 28 cement companies from 2006-2012 using both qualitative and quantitative data. Financial ratios and other data are used as inputs and outputs in the TOPSIS-DEA model. The hybrid model aims to provide a more accurate ranking by combining the advantages of the TOPSIS and DEA methods. When the results were presented to stock market experts, most felt the integrated approach provided a better ranking of company performance than quantitative or qualitative approaches alone.