Download as PDF, PPTX


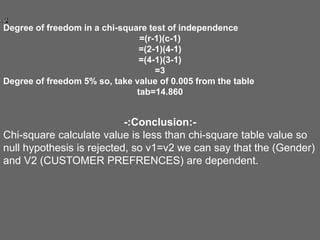
![fo fe fo-fe (Fo-fe)2 (Fo-fe)2/fe
6 7.56 -1.56 2.43 .3219
6 6.3 0.3 .09 .0142
7 3.78 3.22 10.368 2.742
2 3.36 -1.36 1.8496 .5504
12 10.44 1.56 2.4336 .233
9 8.7 .3 .09 .010
2 5.22 -3.22 10.36 1.98
6 4.64 1.36 1.849 .398
6.249
fe = RT x CT
N
fe = expected frequency in a given cell,
RT = row total for the row containing that cell,
CT = column total for the row containing that cell,
N = total number of observations
X2 = Σ[(fo – Fe)2 / fe]](https://image.slidesharecdn.com/pantaloons-161112050913/85/Pantaloons-19-320.jpg)


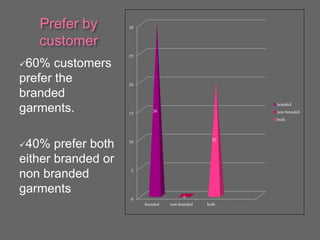
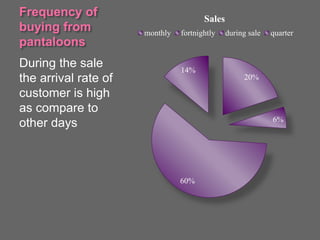
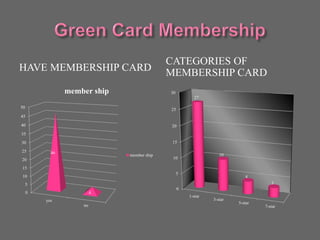
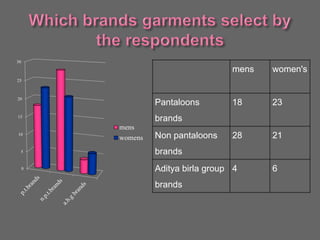
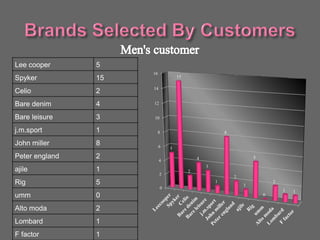
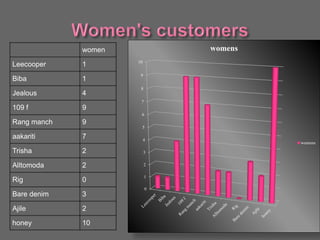
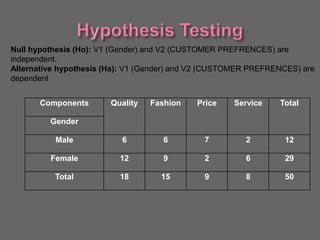
- 60% of respondents prefer branded garments and purchase most during sales. - Pantaloons is the second most popular destination for apparel purchases. - 92% of respondents have a Pantaloons membership card. - 78% of respondents are satisfied with their membership benefits. - There is a dependency between gender and customer preferences - men prefer non-Pantaloons brands while women prefer Pantaloons brands. - The most preferred brands are Spyker for men, Honey for women, and Bare Kids for children.


![Rajesh_PPt[1].pptx Pantaloon and about of pantaloon](https://cdn.slidesharecdn.com/ss_thumbnails/rajeshppt1-241110144017-dc0e8f98-thumbnail.jpg?width=640&height=640&fit=bounds)


