
Recommended
Recommended
More Related Content
Viewers also liked
Viewers also liked (10)
Paleoshoreline Posters
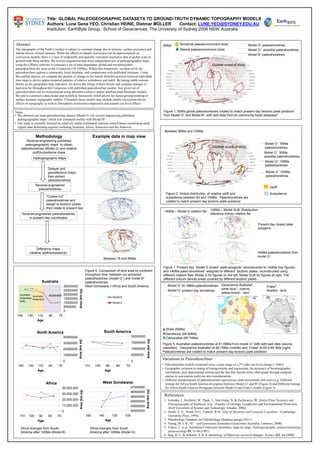
- 1. Title: GLOBAL PALEOGEOGRAPHIC DATASETS TO GROUND-TRUTH DYNAMIC TOPOGRAPHY MODELS Authors: Lune Gene YEO, Christian HEINE, Dietmar MÜLLER Contact: LUNE.YEO@SYDNEY.EDU.AU Institution: EarthByte Group, School of Geosciences, The University of Sydney:2006 NSW, Australia Abstract 90Ma Terrestrial paleoenvironment biota Model G1 paleoshorelines The topography of the Earth’s surface is subject to constant change due to tectonic, surface processes and Marine paleoenvironment biota Model G1 possible paleoshorelines mantle-driven vertical motions. While the effects of mantle convection can be approximated via Model B2 paleoshorelines convection models, there is a lack of temporally and spatially consistent resolution data at global scale to ground-truth these models. We reverse-engineered data from independent sets of paleogeographic maps using the GPlates software to construct a set of time-dependent, global and reconstructable Outside scope of study paleoshorelines for most of the Cretaceous (76-140Ma). Within this framework, we then verify the paleoshorelines against a community fossil database, and comparisons with published literature. Using this unified dataset, we compute the amount of change in the lateral shoreline position between individual time-steps to derive spatio-temporal patterns of relative subsidence and uplift. By taking stable cratonic blocks as our geographic base reference, we derive the tilting of these blocks and compare changes in land area for throughout the Cretaceous with published paleoshoreline models. Any given set of paleoshorelines can be reconstructed using alternative relative and/or absolute plate kinematic models. We aim to construct a data model and workflow framework which allows for future ground-truthing of surface dynamic topography models. Ultimately these models may include mantle convection-driven effects on topography as well as lithospheric extension/compression and eustatic sea level effects. Notes Figure 1. 90Ma global paleoshorelines rotated to match present day tectonic plate positions • We obtained our main paleoshoreline dataset (Model G ) by reverse engineering published from Model G1 and Model B2, with well data from an community fossil database3 paleogeographic maps1 which was compared mainly with Model B2 • Our study is currently focused on relatively stable continental interiors (which better record deep earth signals than deforming regions) including Australia, Africa, Antarctica and the Americas Between 90Ma and 105Ma Methodology Example data in map view Reverse-engineering published paleogeographic maps1 to obtain Model G1 90Ma Outside scope of study paleoshorelines paleoshorelines (Model G) and relative uplift/subsidence maps Model G1 90Ma possible paleoshorelines Paleogeographic Maps Model G1 105Ma paleoshorelines Delayer and georeference maps, Model G1 105Ma then extract paleoshorelines paleoshorelines Reverse-engineered Uplift paleoshorelines Figure 2. Global distribution of relative uplift and Subsidence “Cookie-cut” subsidence between 90 and 105Ma . Paleoshorelines are paleoshorelines and rotated to match present day tectonic plate positions assign to tectonic plates; then rotate to present day 140Ma – Model G rotation file 140Ma – Model SUB (Subduction Reverse-engineered paleoshorelines reference frame) rotation file in present day coordinates Present day closed plate polygons Difference maps (relative uplift/subsidence) 140Ma paleoshorelines from model G1 Between 76 and 90Ma Figure 1. Present day Model G closed plate polygons1 reconstructed to 140Ma (top figures) Figure 4. Comparison of land area by continent and 140Ma paleo-shorelines1 assigned to different tectonic plates, reconstructed using throughout time between our extracted different rotation files: Model G for figures on the left, Model SUB for figures at right. The paleoshorelines (model G1) and model B2 different colours denote areas covered by different tectonic plates Australia paleoshorelines 4 30000000 West Gondwana = Africa and South America Model G1 81-58Ma paleoshorelines Geoscience Australia : Frake5: white-blue – marine; Area (km sq) 25000000 Model G 1 present day shorelines shaded - land yellow-brown - land Australia- Australia- Australia 20000000 Antarctica- 15000000 Antarctica India 10000000 5000000 0 150 130 110 90 70 Age Shale (65Ma) North America South America Sandstone (65-80Ma) 40000000 20000000 Carbonates (65-74Ma) Area (km sq) Area (km sq) 30000000 15000000 Figure 5. Australian paleoshorelines at 81-58Ma from model G1 (left) with well data (source 20000000 10000000 classified), Geoscience Australia4 at 66-76Ma (middle) and Frake5 at 65.5-89.3Ma (right). Paleoshorelines are rotated to match present day tectonic plate positions 10000000 5000000 0 0 Variations in Paleoshorelines 150 130 110 90 70 110 100 90 80 70 • Paleoshoreline models examined cover a time range of a 2nd order sea level change (>5Ma6) • Geographic variation in timing of transgressions and regressions, the accuracy of biostratigraphic Age Age correlations, post depositional erosion and the fact that marine rocks often grade through marginal marine to non-marine rocks are also considerations • Different interpretations of paleoshorelines and tectonic plate movements also exist (e.g. Different Africa West Gondwana timings for Africa-South America divergence between Model G1 and B2 (Figure 4) and Different timings 40,000,000 47000000 for Africa-South America divergence between Model G and Frake’s model (Figure 5) Area (km sq) Area (km sq) 46500000 30,000,000 References 46000000 20,000,000 45500000 1. Golonka, J., Krobicki, M., Pająk, J., Van Giang, N. & Zuchiewicz, W. Global Plate Tectonics and 10,000,000 Paleogeography of Southeast Asia. (Faculty of Geology, Geophysics and Environmental Protection, 45000000 AGH University of Science and Technology, Arkadia, 2006). 0 44500000 2. Smith, A. G., Smith, D.G., Funnell, B.M. Atlas of Mesozoic and Cenozoic Coastlines. (Cambridge 110 100 90 80 70 160 140 120 100 University Press, 1994). Age Age 3. Paleobiology Database (ed Paleobiology Database group) (2011). 4. Yeung, M. J. B., M. (ed Geoscience Australia) (Geoscience Australia, Canberra, 2009). Africa diverges from South Africa diverges from South 5. Frakes, L. et al. Australian Cretaceous shorelines, stage by stage. Palaeogeography, palaeoclimatology, America after 105Ma (Model B) America after 126Ma (Model G) palaeoecology 59, 31-48 (1987). 6. Haq, B. U. & Schutter, S. R. A chronology of Paleozoic sea-level changes. Science 322, 64 (2008).
- 2. Abstract No.:189852 Title: ESTIMATING VERTICAL MOTIONS THROUGH TIME USING PALEOGEOGRAPHIES Authors: Lune Gene YEO, Christian HEINE, Dietmar MÜLLER Contact: LUNE.YEO@SYDNEY.EDU.AU Institution: EarthByte Group, School of Geosciences, The University of Sydney:2006 NSW, Australia Abstract 140Ma – Model G rotation file 140Ma – Model SUB (Subduction The topography of the Earth's surface is subject to constant change due to tectonic, surface processes and reference frame) rotation file mantle-driven vertical motions. However, determining the individual contributions of different mechanisms for vertical motion change through geological history from the sedimentary record is Present day closed plate extremely difficult due to a missing absolute reference base level. We reverse-engineered data from polygons independent sets of paleogeographic maps using the GPlates software to construct a set of time-dependent, global paleoshorelines from the for most of the Cretaceous (76-140Ma). Within this framework, we then verify the paleoshorelines against a community fossil database, and comparisons with published literature. We compute the amount of change in the lateral shoreline position between individual time-steps to derive spatio-temporal patterns of relative subsidence and uplift. By taking stable cratonic blocks as our geographic base reference, we derive the tilting of these blocks and compare changes in land area for throughout the Cretaceous with published paleoshoreline models. Based on the amount of change, we 140Ma paleoshorelines from identify potential basins in Australia to be queried in greater detail using additional data in further studies. model G Any given set of paleoshorelines can be reconstructed using alternative relative and/or absolute plate kinematic models. We aim to construct a data model and workflow framework which allows for future ground-truthing of surface dynamic topography models. Ultimately these models may include mantle Figure 1. Present day Model G closed plate polygons1 reconstructed to 140Ma (top figures) convection-driven effects on topography as well as lithospheric extension/compression and eustatic sea and 140Ma paleo-shorelines1 assigned to different tectonic plates, reconstructed using level effects. different rotation files: Model G for figures on the left, Model SUB for figures at right. The different colours denote areas covered by different tectonic plates Notes • We obtained our main paleoshoreline dataset (Model G ) by reverse engineering published Between 76Ma and 90Ma paleogeographic maps1 which was compared mainly with Model B2 • Our study is currently focused on relatively stable continental interiors (which better record deep earth signals than deforming regions) including Australia, Africa, Antarctica and the Americas Outside scope of study Methodology Example data in map view Reverse-engineering published paleogeographic maps1 to obtain paleoshorelines (Model G) and relative uplift/subsidence maps Sandstone (65-83Ma) Paleogeographic Maps Carbonates (65-74Ma) Shale (65Ma) Delayer and georeference maps, Between 90Ma and 105Ma then extract paleoshorelines Reverse-engineered Outside scope paleoshorelines of study “Cookie-cut” paleoshorelines and assign to tectonic plates; then rotate to present day Sandstone (97Ma) Reverse-engineered paleoshorelines Shale (97Ma) in present day coordinates Extrusive igneous (97Ma) Mudstone (95Ma) Between 105Ma and 126Ma Outside scope Difference maps of study (relative uplift/subsidence) Between 76 and 90Ma Is attached as one landmass (126Ma only) Figure 4. Comparison of land area by continent Is attached as throughout time between our extracted Sandstone (112-125Ma) one landmass paleoshorelines (model G1) and model B2 Australia paleoshorelines 30000000 West Gondwana = Africa and South America Area (km sq) 25000000 Between 126Ma and 140Ma Australia- Australia- Australia 20000000 Antarctica- 15000000 Antarctica India 10000000 Outside scope 5000000 of study 0 150 130 110 90 70 Age Is attached as one landmass Is attached as Sandstone (132-135Ma) North America South America one landmass 40000000 20000000 Area (km sq) Area (km sq) 30000000 15000000 Model G later paleoshorelines Model G earlier paleoshorelines 20000000 10000000 Model G later possible paleoshorelines Model G earlier paleoshorelines 10000000 5000000 Uplift Subsidence 0 0 Figure 2. Global distribution of relative uplift and subsidence throughout the Cretaceous. 150 130 110 90 70 110 100 90 80 70 Paleoshorelines are rotated to match present day tectonic plate positions Age Age Potential for more detailed examination (from Figure 2) • Basin histories may be queried in further detail at basin level using more data Africa West Gondwana (e.g.: well, seismic) for comparison with uplift/subsidence distributions 47000000 above. Some potential study areas in Australia (see inset figures of Australia 40,000,000 in Figure 2 and map of basins in Northwest Australia on right) include: Area (km sq) Area (km sq) 46500000 30,000,000 o Browse basin – is the uplift between 105 and 90Ma due to higher sediment 46000000 deposition rates or tectonic inversion? 20,000,000 45500000 o Bonaparte basin – does the subsidence between 140 and 126Ma and the 10,000,000 45000000 subsequent uplift from 105Ma correspond to tectonic or sedimentary 44500000 influence? 0 o Are any of these vertical changes in topography due to deep earth influences? 110 100 90 80 70 160 140 120 100 Age Age References 1 Golonka, J., Krobicki, M., Pająk, J., Van Giang, N. & Zuchiewicz, W. Global Plate Tectonics and Africa diverges from South Africa diverges from South Paleogeography of Southeast Asia. (Faculty of Geology, Geophysics and Environmental America after 105Ma (Model B) America after 126Ma (Model G) Protection, AGH University of Science and Technology, Arkadia, 2006). 2 Smith, A. G., Smith, D.G., Funnell, B.M. Atlas of Mesozoic and Cenozoic Coastlines. (Cambridge University Press, 1994).