Download to read offline


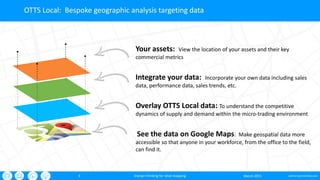


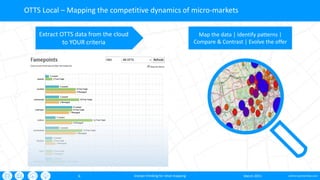
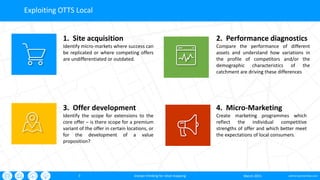
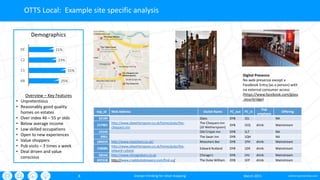


This document introduces OTTS Local, a new service from The Oxford Partnership that provides powerful on-trade data and competitive analysis for individual retail sites. OTTS Local quantifies the trading dynamics of a local market, including the number and type of competing offers and demand characteristics. It then overlays this data with a client's own performance data to identify the drivers of performance and enable micro-market strategies. The service extracts and maps competitive data from The Oxford Partnership's large database of on-trade outlets. Clients can access OTTS Local either through an annual subscription, individual site analyses, or daily-access data licenses.


![[DSC Europe 25] Bojan Djuricic - Predictive Design Process.pdf](https://cdn.slidesharecdn.com/ss_thumbnails/5awdrbedqdek3gqu2ezy-4-the-predictive-design-bojan-djuricic-260120105856-6c399e9b-thumbnail.jpg?width=640&height=640&fit=bounds)


