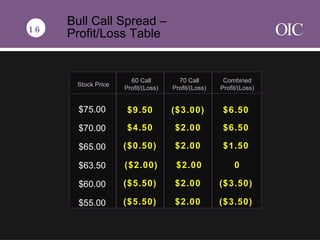
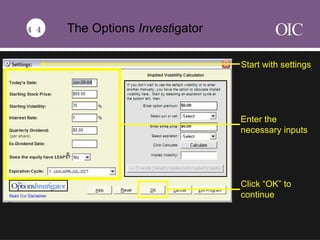
SlideShare a Scribd company logo
1 of 95
Spreads Barrington Capital Management, Inc . A Registered Investment Advisor (800) 944 2410  (952) 835 1000 THE OPTIONS INDUSTRY COUNCIL C O I
Understanding and Trading Options Spread Strategies C O I
The Options Industry Council 2 Understanding and Trading Options Spread Strategies For the sake of simplicity, the examples that follow do not take into consideration commissions and other transaction fees, tax considerations, or margin requirements, which are factors that may significantly affect the economic consequences of a given strategy. An investor should review transaction costs, margin requirements and tax considerations with a broker and tax advisor before entering into any options strategy. Options involve risk and are not suitable for everyone. Prior to buying or selling an option, a person must receive a copy of  Characteristics and Risks of Standardized Options . Copies have been provided for you today and may be obtained from your broker, one of the exchanges or The Options Clearing Corporation, One North Wacker Drive, Suite 500, Chicago, IL 60606 or call 1-888-OPTIONS or visit www.888options.com. Any strategies discussed, including examples using actual securities and price data, are strictly for illustrative and education purposes and are not to be construed as an endorsement, recommendation or solicitation to buy or sell securities. Supporting documentation will be supplied upon written request.
Presentation Outline ,[object Object],[object Object],[object Object],[object Object],[object Object],[object Object],[object Object],[object Object],[object Object],[object Object],[object Object],3
Review of Basics C O I
Unique Aspects Of Options ,[object Object],[object Object],[object Object],[object Object],[object Object],[object Object],[object Object],4 contracts rights the right to buy the right to sell obligations an obligation to sell an obligation to buy
Options Mechanics ,[object Object],[object Object],[object Object],[object Object],[object Object],[object Object],[object Object],[object Object],5
Options Require Planning 1 ,[object Object],[object Object],[object Object],[object Object],[object Object],6
Options Require Planning 2 ,[object Object],[object Object],[object Object],[object Object],[object Object],7
Review of Options Pricing C O I
The Impact Of Stock  Price Change ,[object Object],[object Object],[object Object],[object Object],[object Object],[object Object],[object Object],8 $3.50 Stock price up $1.00 Call price increases  less than  $1.00 (Assumes time is unchanged) ?
The Impact Of Changing Time ,[object Object],[object Object],[object Object],[object Object],[object Object],[object Object],[object Object],9 $2.00 Time decreases by 50% Call price decreases  less than  50% (Assumes stock price is unchanged) ?
Delta ,[object Object],[object Object],[object Object],[object Object],[object Object],10
Time Decay ,[object Object],[object Object],[object Object],[object Object],[object Object],11
Introduction to Spreads C O I
What Does “Spread” Mean? ,[object Object],[object Object],[object Object],12
Why Are Spreads Important? ,[object Object],[object Object],13
The Bull Call Spread C O I
Bull Call Spread Defined ,[object Object],[object Object],14
Bull Call Spread Example ,[object Object],[object Object],[object Object],[object Object],[object Object],[object Object],15
Bull Call Spread – Profit/Loss Table 16 $75.00 $70.00 $65.00 $63.50 $60.00 $55.00 Stock Price 60 Call Profit/(Loss) 70 Call Profit/(Loss) Combined Profit/(Loss) $9.50 ($3.00) $6.50 ($5.50) ($2.00) ($0.50) $4.50 ($5.50) $2.00 $2.00 $2.00 $2.00 $2.00 ($3.50) 0 $1.50 $6.50 ($3.50)
Bull Call Spread – Diagram 17 5 5 55 60 65 0 – + 10 70 75 Stock Price
Potential Outcomes 1 ,[object Object],[object Object],[object Object],[object Object],[object Object],[object Object],[object Object],18 ,[object Object],[object Object],[object Object]
Potential Outcomes 2 ,[object Object],[object Object],[object Object],[object Object],[object Object],[object Object],[object Object],19 Exercised – buy stock Expires worthless Long stock:  effective price at $63.50
Potential Outcomes 3 ,[object Object],[object Object],[object Object],[object Object],[object Object],[object Object],[object Object],20 Exercised – buy stock Assigned – sell stock No position, maximum profit realized
Potential Outcomes At Expiration 21 5 5 55 60 65 0 – + 10 70 75 Stock Price Both Calls Expire 60 Call Exercised 70 Call Expires 60 Call Exercised 70 Call Assigned No Position Long Stock No Position
Choosing Between Strategies ,[object Object],[object Object],[object Object],[object Object],[object Object],[object Object],22
Estimating Results 23 Stock Price 60 Call 70 Call 60-70 Call Spread Today At Expiration Profit/(Loss) $6.50 ($2.00) $4.50 $63.00 $7.00 $5.50 $2.00 $3.50 $70.00 $10.00 0 $10.00
Selection Considerations ,[object Object],24
The Bear Call Spread C O I
Bear Call Spread Defined ,[object Object],[object Object],25
Bear Call Spread Example ,[object Object],[object Object],[object Object],[object Object],[object Object],[object Object],26
Bear Call Spread – Profit/Loss Table 27 $75.00 $70.00 $65.00 $63.50 $60.00 $55.00 Stock Price 60 Call Profit/(Loss) 70 Call Profit/(Loss) Combined Profit/(Loss) $5.50 $2.00 $0.50 ($4.50) ($9.50) $5.50 ($2.00) ($2.00) ($2.00) ($2.00) $3.00 ($2.00) $3.50 0 ($1.50) ($6.50) ($6.50) $3.50
Bear Call Spread – Diagram 28 0 5 + 55 60 65 70 75 Stock Price Both Calls Expire 60 Call Assigned 70 Call Expires 60 Call Assigned 70 Call Exercised 5 No Position Short Stock No Position –
The Bear Put Spread C O I
Bear Put Spread Defined ,[object Object],[object Object],29
Bear Put Spread Example ,[object Object],[object Object],[object Object],[object Object],[object Object],30
Bear Put Spread – Profit/Loss Table 31 $45.00 $40.00 $38.50 $35.00 $30.00 Stock Price 40 Put Profit/(Loss) 35 Put Profit/(Loss) Combined Profit/(Loss) $7.50 $2.50 ($1.00) ($2.50) ($2.50) ($4.00) $1.00 $1.00 $1.00 $1.00 $3.50 $3.50 0 ($1.50) ($1.50)
Bear Put Spread – Diagram 32 0 5 – + 30 35 Stock Price 5 40 45
Potential Outcomes 1 ,[object Object],[object Object],[object Object],[object Object],[object Object],[object Object],[object Object],33 Expires worthless Expires worthless No position, 100% loss
Potential Outcomes 2 ,[object Object],[object Object],[object Object],[object Object],[object Object],[object Object],[object Object],34 Exercised – sell stock Expires worthless Short stock:  effective price is $38.50
Potential Outcomes 3 ,[object Object],[object Object],[object Object],[object Object],[object Object],[object Object],[object Object],35 Exercised – sell stock Assigned – buy stock No position, maximum profit realized
Possible Outcomes At Expiration 36 40 Put Exercised 35 Put Assigned 40 Put Exercised 35 Put Expires Both Puts Expire 0 5 – + 30 35 Stock Price 5 40 45 No Position Short Stock No Position
Selection Considerations ,[object Object],37
The Bull Put Spread C O I
Bull Put Spread Defined ,[object Object],[object Object],38
Bull Put Spread Example ,[object Object],[object Object],[object Object],[object Object],[object Object],39
Bull Put Spread – Profit/Loss Table 40 $45.00 $40.00 $38.50 $35.00 $30.00 Stock Price 40 Put Profit/(Loss) 35 Put Profit/(Loss) Combined Profit/(Loss) ($7.50) ($2.50) $1.00 $2.50 $2.50 $4.00 ($1.00) ($1.00) ($1.00) ($1.00) ($3.50) ($3.50) 0 $1.50 $1.50
Bull Put Spread – Diagram 41 40 Put Assigned 35 Put Exercised 40 Put Assigned 35 Put Expires Both Puts Expire 0 5 – + 30 35 Stock Price 5 40 45 No Position Short Stock No Position
Selection Considerations ,[object Object],[object Object],42
Intermission THE OPTIONS INDUSTRY COUNCIL ,[object Object],[object Object],[object Object],[object Object],[object Object],1-888-OPTIONS www.888options.com C O I
Introduction to  The Options  Invest igator C O I
The Options  Invest igator 43 Learn about strategies Learn through tutorials Simulate positions
The Options  Invest igator 44 Start with settings Enter the necessary inputs Click “OK” to continue
The Options  Invest igator Enter the position: Bull Call spread 45 Long the 60 Call Short the 65 Call The actual prices Net delta and dollars are calculated
Graph As Of Today 46 When you click “Proceed,” you will see the graph of the position as of today.
Graph at Expiration – or Any Date If you change the strike date or stock price, the Options  Invest igator will show you a graph for that information. 47
The Option  Invest igator ,[object Object],[object Object],[object Object],48 Practice first!
Comparing Spreads C O I
Why Are These Diagrams Similar? ,[object Object],49 Debit Call Spread Credit Put Spread
These Also Appear Similar! 50 Credit Call Spread Debit Put Spread
Pricing Behavior C O I
Pricing Behavior ,[object Object],[object Object],[object Object],[object Object],[object Object],51 Assumes XYZ stock is trading at $63.00. note:
[object Object],[object Object],Impact Of Changing Volatility ,[object Object],[object Object],[object Object],[object Object],[object Object],[object Object],[object Object],Stock Price Strike Price Time to Expiration Interest Rates and Dividend Volatility 52
Impact Of Changing Volatility ,[object Object],[object Object],[object Object],53
Impact Of Changing Volatility 54 Stock Price $63.00 $63.00 Implied Volatility 40% 30% 60 Call $5.50 $4.00 ($1.50) 70 Call $2.00 $1.00 ($1.00) 60-70 Spread $3.50 $3.00 ($0.50) INITIAL ESTIMATE CHANGE
Trading Scenario –  Changing Volatility ,[object Object],[object Object],[object Object],55
Trading Scenario –  Changing Volatility 56 Stock Price $44.00 $50.00 Days to Expiration 40 33 Implied Volatility  55%  40% 45 Call $2.80 50 Call $1.30 45-50 Spread $1.50 INITIAL ESTIMATE % CHANGE $5.60 100% $2.30 80% $3.30 120%
Options Prices And Spreads – Summary ,[object Object],[object Object],57
Diagonal Spreads C O I
Diagonal Spread Defined ,[object Object],[object Object],58
Diagonal Spread Example ,[object Object],[object Object],[object Object],[object Object],[object Object],59
Diagonal Call Spread At Expiration Of Short-Term Option 60 0 5 – + 75 80 5 85 90 95 Max profit at strike price Below strike, loss from long call can exceed profit of short call Above strike, call loses time value
Diagonal Call Spread At Expiration Of Short-Term Option ,[object Object],[object Object],[object Object],61
Straddles and Strangles C O I
Long Straddle Defined ,[object Object],62
Long Straddle Example ,[object Object],[object Object],[object Object],[object Object],[object Object],63
Long Straddle – Profit/Loss Table 64 $60.00 $55.00 $50.00 $45.00 $40.00 Stock Price 50 Call Profit/(Loss) 50 Put Profit/(Loss) Combined Profit/(Loss) ($3.20) ($3.20) ($3.20) $1.80 $6.80 $7.00 $2.00 ($3.00) ($3.00) ($3.00) $3.80 ($1.20) ($6.20) ($1.20) $3.80
Long Straddle – Diagram 65 0 5 – + 40 45 5 50 55 60 Short Stock 50 Call Expires 50 Put Exercised Long Stock 50 Call Exercised 50 Put Expires
Pricing Behavior Of Long Straddles 66 Stock Price $50.00 $60.00   20% Days to Expiration 60 32 50 Call $3.20 $10.20 220% 50 Put $3.00 $  0.15 (95%) 50 Straddle $6.20 $10.35   67% INITIAL ESTIMATE % CHANGE
Long Strangle Defined ,[object Object],67
Long Strangle Example ,[object Object],[object Object],[object Object],[object Object],[object Object],68
Long Strangle – Profit/Loss Table 69 $60.00 $55.00 $50.00 $45.00 $40.00 Stock Price 55 Call Profit/(Loss) 45 Put Profit/(Loss) Combined Profit/(Loss) ($1.40) ($1.40) ($1.40) ($1.40) $3.60 $3.95 ($1.05) ($1.05) ($1.05) ($1.05) $2.55 ($2.45) ($2.45) ($2.45) $2.55
Long Strangle – Diagram 70 0 5 – + 40 45 5 50 55 60 55 Call Expires 45 Put Exercised Both Options Expire 55 Call Exercised 45 Put Expires Short Stock No Position Long Stock
Pricing Behavior Of Long Strangles 71 Stock Price $50.00 $60.00   20% Days to Expiration 60 32 55 Call $1.40 $5.90  320% 45 Put $1.05 $  0 (100%) 45-55 Strangle $2.45 $5.90   140% INITIAL ESTIMATE % CHANGE
Straddles Versus Strangles ,[object Object],[object Object],[object Object],[object Object],[object Object],[object Object],[object Object],[object Object],72
Stock and Options Spreads C O I
Stock And Options Spreads ,[object Object],[object Object],[object Object],[object Object],[object Object],[object Object],[object Object],[object Object],[object Object],73
Buy Stock, Sell Strangle Defined ,[object Object],[object Object],74
Buy Stock, Sell Strangle Example ,[object Object],[object Object],[object Object],[object Object],[object Object],75
Short Strangle – Profit/Loss Table 76 $70.00 $65.00 $62.00 $60.00 $55.00 $50.00 Stock Price Stock 65 Call Profit/(Loss) 60 Put Profit/(Loss) Combined Profit/(Loss) $8.00 $3.00 0 ($2.00) ($7.00) ($12.00) ($2.50) $2.50 $2.50 $2.50 $2.50 $2.50 $2.00 $2.00 $2.00 $2.00 ($3.00) ($8.00) $7.50 $7.50 $4.50 $2.50 ($7.50) ($17.50)
Buy Stock, Sell Strangle – Diagram 77 0 10 – + 55 60 10 65 70 65 Call Expires 60 Put Assigned Long 100 65 Call Assigned 60 Put Expires Long 200 No Position
Selection Considerations ,[object Object],[object Object],[object Object],[object Object],78
Summary ,[object Object],[object Object],[object Object],79
Thank you for attending! Visit the OIC Web site at  www.888options.com

More Related Content

What's hot

Trading Stock Options
Trading Stock OptionsTrading Stock Options
Trading Stock OptionsInvestingTips
 
Option strategies part iii
Option strategies  part iiiOption strategies  part iii
Option strategies part iiiAmeya Ranadive
 
Derivatives - Option strategies.
Derivatives - Option strategies.Derivatives - Option strategies.
Derivatives - Option strategies.Ameya Ranadive
 
Options Trading Strategies
Options Trading StrategiesOptions Trading Strategies
Options Trading StrategiesMayank Bhatia
 
Market Strategies Using Options
Market Strategies Using OptionsMarket Strategies Using Options
Market Strategies Using OptionsNavin Bafna
 
Options Trading Strategies
Options Trading StrategiesOptions Trading Strategies
Options Trading Strategiesluv_sharma
 
Derivatives - Delta Gamma Vega Theta Rho
Derivatives - Delta  Gamma Vega Theta RhoDerivatives - Delta  Gamma Vega Theta Rho
Derivatives - Delta Gamma Vega Theta RhoAmeya Ranadive
 
A journey to stock market
A journey to stock market A journey to stock market
A journey to stock market Abhinav Jain
 
Derivatives- CALL AND PUT OPTIONS
Derivatives- CALL AND PUT OPTIONSDerivatives- CALL AND PUT OPTIONS
Derivatives- CALL AND PUT OPTIONSDinesh Kumar
 
HDFCsec-Learning Series - Option Trading Simplified
HDFCsec-Learning Series - Option Trading SimplifiedHDFCsec-Learning Series - Option Trading Simplified
HDFCsec-Learning Series - Option Trading SimplifiedHDFC securities
 
Option strategies part ii
Option strategies  part iiOption strategies  part ii
Option strategies part iiAmeya Ranadive
 

What's hot (20)

Option strategies
Option strategiesOption strategies
Option strategies
 
option basics
option basicsoption basics
option basics
 
Trading Stock Options
Trading Stock OptionsTrading Stock Options
Trading Stock Options
 
Option greeks
Option greeksOption greeks
Option greeks
 
Options strategies
Options strategiesOptions strategies
Options strategies
 
Straddle Options
Straddle OptionsStraddle Options
Straddle Options
 
Option strategies part iii
Option strategies  part iiiOption strategies  part iii
Option strategies part iii
 
Derivatives - Option strategies.
Derivatives - Option strategies.Derivatives - Option strategies.
Derivatives - Option strategies.
 
Options Trading Strategies
Options Trading StrategiesOptions Trading Strategies
Options Trading Strategies
 
Option ( Derivatives)
Option ( Derivatives)Option ( Derivatives)
Option ( Derivatives)
 
Market Strategies Using Options
Market Strategies Using OptionsMarket Strategies Using Options
Market Strategies Using Options
 
Options Trading Strategies
Options Trading StrategiesOptions Trading Strategies
Options Trading Strategies
 
Derivatives - Delta Gamma Vega Theta Rho
Derivatives - Delta  Gamma Vega Theta RhoDerivatives - Delta  Gamma Vega Theta Rho
Derivatives - Delta Gamma Vega Theta Rho
 
Basics of options
Basics of optionsBasics of options
Basics of options
 
Options
OptionsOptions
Options
 
A journey to stock market
A journey to stock market A journey to stock market
A journey to stock market
 
Derivatives- CALL AND PUT OPTIONS
Derivatives- CALL AND PUT OPTIONSDerivatives- CALL AND PUT OPTIONS
Derivatives- CALL AND PUT OPTIONS
 
Margin Trading
Margin TradingMargin Trading
Margin Trading
 
HDFCsec-Learning Series - Option Trading Simplified
HDFCsec-Learning Series - Option Trading SimplifiedHDFCsec-Learning Series - Option Trading Simplified
HDFCsec-Learning Series - Option Trading Simplified
 
Option strategies part ii
Option strategies  part iiOption strategies  part ii
Option strategies part ii
 

Similar to Option Spreads

How to Protect and Enhance Your Investment Portfolio
How to Protect and Enhance Your Investment PortfolioHow to Protect and Enhance Your Investment Portfolio
How to Protect and Enhance Your Investment Portfolioboblawson
 
Learn How to Buy Options To Avoid Time Decay Crush & Increase Your Chances fo...
Learn How to Buy Options To Avoid Time Decay Crush & Increase Your Chances fo...Learn How to Buy Options To Avoid Time Decay Crush & Increase Your Chances fo...
Learn How to Buy Options To Avoid Time Decay Crush & Increase Your Chances fo...Joshua Belanger
 
Binary options trading
Binary options tradingBinary options trading
Binary options tradingCIDzakir01
 

Similar to Option Spreads (20)

How to Protect and Enhance Your Investment Portfolio
How to Protect and Enhance Your Investment PortfolioHow to Protect and Enhance Your Investment Portfolio
How to Protect and Enhance Your Investment Portfolio
 
About Options
About OptionsAbout Options
About Options
 
Learn How to Buy Options To Avoid Time Decay Crush & Increase Your Chances fo...
Learn How to Buy Options To Avoid Time Decay Crush & Increase Your Chances fo...Learn How to Buy Options To Avoid Time Decay Crush & Increase Your Chances fo...
Learn How to Buy Options To Avoid Time Decay Crush & Increase Your Chances fo...
 
2017 09 17 Meetup Slides
2017 09 17 Meetup Slides2017 09 17 Meetup Slides
2017 09 17 Meetup Slides
 
2017 10 15 Meetup Slides
2017 10 15 Meetup Slides2017 10 15 Meetup Slides
2017 10 15 Meetup Slides
 
Meetup Slides for February 7, 2021
Meetup Slides for February 7, 2021Meetup Slides for February 7, 2021
Meetup Slides for February 7, 2021
 
2017 10 29 Meetup Slides
2017 10 29 Meetup Slides2017 10 29 Meetup Slides
2017 10 29 Meetup Slides
 
Binary options trading
Binary options tradingBinary options trading
Binary options trading
 
2017 09 24 Meetup Slides
2017 09 24 Meetup Slides2017 09 24 Meetup Slides
2017 09 24 Meetup Slides
 
Meetup Slides for May 15, 2022
Meetup Slides for May 15, 2022Meetup Slides for May 15, 2022
Meetup Slides for May 15, 2022
 
Meetup Slides for May 16, 2021
Meetup Slides for May 16, 2021Meetup Slides for May 16, 2021
Meetup Slides for May 16, 2021
 
Meetup Slides for July 18, 2021
Meetup Slides for July 18, 2021Meetup Slides for July 18, 2021
Meetup Slides for July 18, 2021
 
Meetup Slides for June 27, 2021
Meetup Slides for June 27, 2021Meetup Slides for June 27, 2021
Meetup Slides for June 27, 2021
 
Meetup Slides for May 2, 2021
Meetup Slides for May 2, 2021Meetup Slides for May 2, 2021
Meetup Slides for May 2, 2021
 
Meetup Slides for June 12, 2022.pptx
Meetup Slides for June 12, 2022.pptxMeetup Slides for June 12, 2022.pptx
Meetup Slides for June 12, 2022.pptx
 
Meetup Slides for May 29, 2022
Meetup Slides for May 29, 2022Meetup Slides for May 29, 2022
Meetup Slides for May 29, 2022
 
Meetup Slides for August 12 2021
Meetup Slides for August 12 2021Meetup Slides for August 12 2021
Meetup Slides for August 12 2021
 
Meetup Slides for May 30, 2021
Meetup Slides for May 30, 2021Meetup Slides for May 30, 2021
Meetup Slides for May 30, 2021
 
Meetup Slides for November 26, 2021
Meetup Slides for November 26, 2021Meetup Slides for November 26, 2021
Meetup Slides for November 26, 2021
 
Meetup Slides for September 19, 2021
Meetup Slides for September 19, 2021Meetup Slides for September 19, 2021
Meetup Slides for September 19, 2021
 

Option Spreads

  • 1. Spreads Barrington Capital Management, Inc . A Registered Investment Advisor (800) 944 2410 (952) 835 1000 THE OPTIONS INDUSTRY COUNCIL C O I
  • 2. Understanding and Trading Options Spread Strategies C O I
  • 3. The Options Industry Council 2 Understanding and Trading Options Spread Strategies For the sake of simplicity, the examples that follow do not take into consideration commissions and other transaction fees, tax considerations, or margin requirements, which are factors that may significantly affect the economic consequences of a given strategy. An investor should review transaction costs, margin requirements and tax considerations with a broker and tax advisor before entering into any options strategy. Options involve risk and are not suitable for everyone. Prior to buying or selling an option, a person must receive a copy of Characteristics and Risks of Standardized Options . Copies have been provided for you today and may be obtained from your broker, one of the exchanges or The Options Clearing Corporation, One North Wacker Drive, Suite 500, Chicago, IL 60606 or call 1-888-OPTIONS or visit www.888options.com. Any strategies discussed, including examples using actual securities and price data, are strictly for illustrative and education purposes and are not to be construed as an endorsement, recommendation or solicitation to buy or sell securities. Supporting documentation will be supplied upon written request.
  • 4.
  • 6.
  • 7.
  • 8.
  • 9.
  • 10. Review of Options Pricing C O I
  • 11.
  • 12.
  • 13.
  • 14.
  • 16.
  • 17.
  • 18. The Bull Call Spread C O I
  • 19.
  • 20.
  • 21. Bull Call Spread – Profit/Loss Table 16 $75.00 $70.00 $65.00 $63.50 $60.00 $55.00 Stock Price 60 Call Profit/(Loss) 70 Call Profit/(Loss) Combined Profit/(Loss) $9.50 ($3.00) $6.50 ($5.50) ($2.00) ($0.50) $4.50 ($5.50) $2.00 $2.00 $2.00 $2.00 $2.00 ($3.50) 0 $1.50 $6.50 ($3.50)
  • 22. Bull Call Spread – Diagram 17 5 5 55 60 65 0 – + 10 70 75 Stock Price
  • 23.
  • 24.
  • 25.
  • 26. Potential Outcomes At Expiration 21 5 5 55 60 65 0 – + 10 70 75 Stock Price Both Calls Expire 60 Call Exercised 70 Call Expires 60 Call Exercised 70 Call Assigned No Position Long Stock No Position
  • 27.
  • 28. Estimating Results 23 Stock Price 60 Call 70 Call 60-70 Call Spread Today At Expiration Profit/(Loss) $6.50 ($2.00) $4.50 $63.00 $7.00 $5.50 $2.00 $3.50 $70.00 $10.00 0 $10.00
  • 29.
  • 30. The Bear Call Spread C O I
  • 31.
  • 32.
  • 33. Bear Call Spread – Profit/Loss Table 27 $75.00 $70.00 $65.00 $63.50 $60.00 $55.00 Stock Price 60 Call Profit/(Loss) 70 Call Profit/(Loss) Combined Profit/(Loss) $5.50 $2.00 $0.50 ($4.50) ($9.50) $5.50 ($2.00) ($2.00) ($2.00) ($2.00) $3.00 ($2.00) $3.50 0 ($1.50) ($6.50) ($6.50) $3.50
  • 34. Bear Call Spread – Diagram 28 0 5 + 55 60 65 70 75 Stock Price Both Calls Expire 60 Call Assigned 70 Call Expires 60 Call Assigned 70 Call Exercised 5 No Position Short Stock No Position –
  • 35. The Bear Put Spread C O I
  • 36.
  • 37.
  • 38. Bear Put Spread – Profit/Loss Table 31 $45.00 $40.00 $38.50 $35.00 $30.00 Stock Price 40 Put Profit/(Loss) 35 Put Profit/(Loss) Combined Profit/(Loss) $7.50 $2.50 ($1.00) ($2.50) ($2.50) ($4.00) $1.00 $1.00 $1.00 $1.00 $3.50 $3.50 0 ($1.50) ($1.50)
  • 39. Bear Put Spread – Diagram 32 0 5 – + 30 35 Stock Price 5 40 45
  • 40.
  • 41.
  • 42.
  • 43. Possible Outcomes At Expiration 36 40 Put Exercised 35 Put Assigned 40 Put Exercised 35 Put Expires Both Puts Expire 0 5 – + 30 35 Stock Price 5 40 45 No Position Short Stock No Position
  • 44.
  • 45. The Bull Put Spread C O I
  • 46.
  • 47.
  • 48. Bull Put Spread – Profit/Loss Table 40 $45.00 $40.00 $38.50 $35.00 $30.00 Stock Price 40 Put Profit/(Loss) 35 Put Profit/(Loss) Combined Profit/(Loss) ($7.50) ($2.50) $1.00 $2.50 $2.50 $4.00 ($1.00) ($1.00) ($1.00) ($1.00) ($3.50) ($3.50) 0 $1.50 $1.50
  • 49. Bull Put Spread – Diagram 41 40 Put Assigned 35 Put Exercised 40 Put Assigned 35 Put Expires Both Puts Expire 0 5 – + 30 35 Stock Price 5 40 45 No Position Short Stock No Position
  • 50.
  • 51.
  • 52. Introduction to The Options Invest igator C O I
  • 53. The Options Invest igator 43 Learn about strategies Learn through tutorials Simulate positions
  • 54. The Options Invest igator 44 Start with settings Enter the necessary inputs Click “OK” to continue
  • 55. The Options Invest igator Enter the position: Bull Call spread 45 Long the 60 Call Short the 65 Call The actual prices Net delta and dollars are calculated
  • 56. Graph As Of Today 46 When you click “Proceed,” you will see the graph of the position as of today.
  • 57. Graph at Expiration – or Any Date If you change the strike date or stock price, the Options Invest igator will show you a graph for that information. 47
  • 58.
  • 60.
  • 61. These Also Appear Similar! 50 Credit Call Spread Debit Put Spread
  • 63.
  • 64.
  • 65.
  • 66. Impact Of Changing Volatility 54 Stock Price $63.00 $63.00 Implied Volatility 40% 30% 60 Call $5.50 $4.00 ($1.50) 70 Call $2.00 $1.00 ($1.00) 60-70 Spread $3.50 $3.00 ($0.50) INITIAL ESTIMATE CHANGE
  • 67.
  • 68. Trading Scenario – Changing Volatility 56 Stock Price $44.00 $50.00 Days to Expiration 40 33 Implied Volatility 55% 40% 45 Call $2.80 50 Call $1.30 45-50 Spread $1.50 INITIAL ESTIMATE % CHANGE $5.60 100% $2.30 80% $3.30 120%
  • 69.
  • 71.
  • 72.
  • 73. Diagonal Call Spread At Expiration Of Short-Term Option 60 0 5 – + 75 80 5 85 90 95 Max profit at strike price Below strike, loss from long call can exceed profit of short call Above strike, call loses time value
  • 74.
  • 76.
  • 77.
  • 78. Long Straddle – Profit/Loss Table 64 $60.00 $55.00 $50.00 $45.00 $40.00 Stock Price 50 Call Profit/(Loss) 50 Put Profit/(Loss) Combined Profit/(Loss) ($3.20) ($3.20) ($3.20) $1.80 $6.80 $7.00 $2.00 ($3.00) ($3.00) ($3.00) $3.80 ($1.20) ($6.20) ($1.20) $3.80
  • 79. Long Straddle – Diagram 65 0 5 – + 40 45 5 50 55 60 Short Stock 50 Call Expires 50 Put Exercised Long Stock 50 Call Exercised 50 Put Expires
  • 80. Pricing Behavior Of Long Straddles 66 Stock Price $50.00 $60.00 20% Days to Expiration 60 32 50 Call $3.20 $10.20 220% 50 Put $3.00 $ 0.15 (95%) 50 Straddle $6.20 $10.35 67% INITIAL ESTIMATE % CHANGE
  • 81.
  • 82.
  • 83. Long Strangle – Profit/Loss Table 69 $60.00 $55.00 $50.00 $45.00 $40.00 Stock Price 55 Call Profit/(Loss) 45 Put Profit/(Loss) Combined Profit/(Loss) ($1.40) ($1.40) ($1.40) ($1.40) $3.60 $3.95 ($1.05) ($1.05) ($1.05) ($1.05) $2.55 ($2.45) ($2.45) ($2.45) $2.55
  • 84. Long Strangle – Diagram 70 0 5 – + 40 45 5 50 55 60 55 Call Expires 45 Put Exercised Both Options Expire 55 Call Exercised 45 Put Expires Short Stock No Position Long Stock
  • 85. Pricing Behavior Of Long Strangles 71 Stock Price $50.00 $60.00 20% Days to Expiration 60 32 55 Call $1.40 $5.90 320% 45 Put $1.05 $ 0 (100%) 45-55 Strangle $2.45 $5.90 140% INITIAL ESTIMATE % CHANGE
  • 86.
  • 87. Stock and Options Spreads C O I
  • 88.
  • 89.
  • 90.
  • 91. Short Strangle – Profit/Loss Table 76 $70.00 $65.00 $62.00 $60.00 $55.00 $50.00 Stock Price Stock 65 Call Profit/(Loss) 60 Put Profit/(Loss) Combined Profit/(Loss) $8.00 $3.00 0 ($2.00) ($7.00) ($12.00) ($2.50) $2.50 $2.50 $2.50 $2.50 $2.50 $2.00 $2.00 $2.00 $2.00 ($3.00) ($8.00) $7.50 $7.50 $4.50 $2.50 ($7.50) ($17.50)
  • 92. Buy Stock, Sell Strangle – Diagram 77 0 10 – + 55 60 10 65 70 65 Call Expires 60 Put Assigned Long 100 65 Call Assigned 60 Put Expires Long 200 No Position
  • 93.
  • 94.
  • 95. Thank you for attending! Visit the OIC Web site at www.888options.com

Editor's Notes

  1. Good evening. My name is ___________________, and am a ________ with the _______________ exchange. Tonight, I represent The Options Industry Council, which is a consortium of six options exchanges and The Options Clearing Corporation that have combined efforts to bring you this series of educational seminars. OIC is now 12 years old, and we have spoken to over 500,000 people. Can you please tell me a little about who you are and your investment experience. Please raise your hand if you have any experience trading options. Thank you. And how many of you make more than 5 trades per month. And how many of you have traded spreads? Thank you, that gives me some idea. This evening I plan to talk until 7:20-7:25 and then we will take a 15 minute break. After the break I will talk until about 9:00. There is a seminar evaluation form, which can be found in the front of your manual. Please take a moment at the end of the seminar to fill out the evaluation.
  2. Before we begin, I would like to make the following points. First, I am not a licensed broker or a registered investment advisor, so everything I say tonight is for educational purposes only. Nothing I say should be considered investment advice. Second, the examples in the presentation do not include transactions costs, but they are important to consider in real life strategies. Finally, the options disclosure document “Characteristics and Risks of Standardized Options” is included in you packet of materials. Please read this thoroughly before engaging in any options transactions. Questions? Now let’s get into the presentation
  3. Here is an outline of what I will discuss this evening. After a very brief review of the basics, we will focus specifically on spread strategies. This is not a basic-level seminar, so if you have never traded options, then some of this may be too complicated. The Options Investigator is the software disk included in your materials, and can be a useful tool to analyze option prices and option strategies. Please feel free to raise your hand and to ask questions at any time. My goal is to make sure you get what you need to feel good about coming here tonight.
  4. Any questions before we start? Let’s get going.
  5. The first point I want to make is that options are contracts. When you buy an option, you do not get a vote in corporate affairs or the right to receive dividends. Since spread strategies involve both long and short options, it is very important that you know the right or obligation of each part of your position.
  6. Exercise and assignment create stock transactions. Rights are invoked when options are exercised, and obligations must be fulfilled when an assignment notice is received. Yes, these transactions involve commissions. Buying and selling stock also involves paying for the stock or getting money. So you must plan ahead when using options.
  7. Options are sold on any business day, just like stock, but closing a position is not your only alternative. You can also exercise an option you own or carry it to expiration. The point is to have a plan when the position is initiated.
  8. The same holds true for option writers. First, you can “buy back” the option to close the obligation. Second, you can let it be assigned and fulfill the obligation. And, third, you can carry the position to expiration and let the option expire. But, again, having a plan when the position is initiated is important, and having a back-up plan is equally important. What if the trade goes against you? What is your plan? Do you have a stop-loss point? These questions should be answered when the position is established, not when you feel pain or when expiration is two days away.
  9. Now a few words on option prices and how they change.
  10. Look at the assumptions and then answer the question. There are three assumptions: The stock price is $50. Today is 90 days to expiration. The 50-strike Call is trading at $3.00. (Note that this is an at-the-money call.) The question is this: If the stock prices rises by $1 today to $51, then what will the price of the 50-strike call be? Will it rise, fall or stay the same? If it changes, how much will it change? Everybody, please write down your answer. Here is the answer. The call rises by 50 cents to $3.50. I will discuss why in a minute, but let’s look at another question first.
  11. The second question starts with the same three assumptions. The stock price is $50. It is 90 days to expiration, and the at-the-money 50-strike Call is trading at $3.00 The question is: If the stock price stays at $50, but 45 days pass, then what is the price of the 50-strike Call? The passage of time causes option prices to decrease, but by how much? What is your guess? Please write down your answer. Answer: The new price of the 50-strike Call is $2.00. One-half of the time to expiration passed, but the option price declined by only approx. 33%.
  12. The first concept is “delta.” (Explain.)
  13. The second concept is time decay. (Explain.)
  14. Now let’s get into tonight’s topic, which is spreads. If you have never traded spreads before, let me warn you that this can get a little technical. Spreads, however, is a strategy you will need to learn if you want to advance beyond the basics.
  15. Let me also warn you that the word “spread” means many different things, so please don’t automatically assume that when you hear the word spread that it will mean what I am talking about tonight.
  16. I am frequently asked what the “best” strategy is. Frankly, if I knew the answer to that question, then I would be rich and retired. No strategy is “better” in an absolute sense. Rather, every strategy offers trade-offs. For your situation and your forecast, one strategy might be better than another, but it is not a “better” strategy. Spreads are no different. They have their own set of trade-offs, and sometimes they are right for you, and sometimes they are not. But you have to understand them before you decide if they are good or bad for you in a particular situation.
  17. I will talk about four different spreads, and the first one is the “Bull Call Spread.” How many of you have heard of this strategy? How many of you have traded these?
  18. (Read the first bullet point.) A bull call spread is a 2-part strategy. You buy one call and sell another call with a higher strike price. “Debit” means that you have to pay a net amount to establish the position, and “vertical” describes the relationship of the two strike prices. One strike price is over, or vertical to, the other strike price. There are also horizontal spreads and diagonal spreads.
  19. Here is an example. The stock price is $63, and this bull call spread consists of buying one 60-strike Call and selling 70-strike Call The net cost – or net debit – is $3.50 per share. Note that this is frequently is called the “60-70 Call Spread.” The lower strike price is first when talking about spreads.
  20. Here is the first tough problem for tonight. Please fill out the table starting with the top row. If the stock price is $75 at expiration, then what is your profit or loss on the long 60 Call, and what is your profit or loss on the 70 Call? Now work your way down the rows. First the 60 Call, and then the 70 Call.
  21. Now take the numbers in the right-most column and plot them on this profit-and-loss graph. What we have is a strategy that has limited risk but also limited profit potential. What is the maximum risk? Maximum profit? (Explain.)
  22. Calculating profit and loss is only the first step. The next step is to discuss what happens at expiration. By this I mean, is an option exercised, assigned, or does it expire? Let’s go through this for each of the three potential outcomes. In this case, the stock price is below $60, the lower strike price. What happens to the 60 Call? Right – it expires worthless. And what happens to the 70 Call? Right – it also expires worthless. If both options expire, then you lose 100% of the money invested, and you have no position.
  23. What if the stock price is between the two strike prices? What happens to the 60 Call? Right – it is exercised. And what happens to the 70 Call? Right – it expires worthless. So what is the “final position” that you end up with? That’s right – the exercise means that you end up long stock, 100 shares for each call that is exercised.
  24. The third possible outcome is that the stock price is above the higher strike price, above $70 in this example. What happens to the 60 Call? Right – it is exercised and you have to buy the stock. What happens to the 70 Call? Right – it is assigned. So you buy stock and immediately sell it. What are you left with? Yes, commissions to pay, that’s right, but what else? Cash, but how much cash do you have? The answer is $6.50. That’s $10 less the $3.50 you paid to establish the spread position.
  25. Here is a graphed summary of the three outcomes.
  26. Now let’s make this practical. Here is a simple forecast and three strategy choices. The stock price is $63, and you think the stock price will rise to $70 by expiration. Which strategy would you pick? Would you buy the 60 Call, the 70 Call, or the 60-70 Call Spread?
  27. To answer this question, it helps to fill out the table. The stock price is up $7.00; the 60 Call is up $4.50; the 70 Call expires worthless, and the 60-70 Spread rises $6.50. So which strategy would you pick? Buying the stock does make 50 cents more, but you had to invest $63. The spread makes $6.50, and you only had to invest $3.50. The spread will not always produce the highest profit for every forecast, but sometimes it will. And that is when you should use it.
  28. When are those times? There are no “hard and fast” rules but frequently, spreads are appropriate for smaller stock price moves over a month or two.
  29. Okay, on to the second spread. If a bull call spread was good for a rising stock price, when would you think about using a bear call spread? That’s right, when stock prices are falling.
  30. Bear Call Spreads are, essentially, the opposite of bull call spreads. You are selling the call with the lower strike price and buying the call with the higher strike.
  31. This is just the opposite of the bull call spread. This time we are selling the 60 Call and buying the 70 Call. And we are receiving $3.50. This is a credit .
  32. Now let’s fill out the profit-loss table. Keep in mind that the 60 Call is short, and the 70 Call is long.
  33. Now let’s go over these three outcomes. If the stock price is below the lower strike, then both options expire, and you get to keep the $3.50. If the stock price is in between the two strikes, then what happens to the 60 Call? That’s right, it is assigned , and you have a short stock position. How many of you have ever shorted stock? You should learn about shorting stock before you try this strategy! And what if the stock price is above the higher strike? Look at each part of the spread and ask, is the option exercised or assigned? Well, the short call is assigned – short stock – and the long call is exercised – buy stock – so the net is no position.
  34. On to puts spreads! Some people have trouble with puts, so now is the time to think it through and learn. If you want to be a trader, you have to learn to trade bull and bear markets. So here we go.
  35. A bear put spread is another two-part strategy. We are buying the higher-strike put and selling another put with a lower strike. This is a debit , because we are paying a net amount for the strategy.
  36. Here is an example. The stock price is $39. We buy the 40-strike put and sell the 35-strike Put. The net cost is $1.50. Personally, I call this the “35-40” put spread, but some people obviously call it the “40-35” put spread.
  37. Now fill out the profit-loss table, and let’s spend a few minutes on this, because it is really important to get it right. If you want to learn about puts and put spreads, then this is your chance. Remember, we are buying the 40 Put and selling the 35 Put. (Go through table line by line.)
  38. Now take the numbers in the right-most column and draw the diagram.
  39. The next step is to discuss what “happens” to each of the options. If the stock price is above the higher strike, then both options expire worthless, and you have the maximum loss.
  40. Between the strikes . What happens to the 40 Put? That’s right, it is exercised – short stock. What happens to the 35 Put? That’s right, it expires – no stock transaction. And the result? That’s right, short stock. What do you do if you don’t want a short stock position? One, you could buy back the short stock. Two, you could anticipate that this might happen at expiration and close the spread prior to expiration.
  41. The third possible outcome is the stock price is below the lower strike. What happens to the 40 Put? Exercised – short stock. What happens to the 35 Put? Assigned – buy stock. And the resulting position? Sell, then buy; result is no position (but lots of commissions).
  42. And here is the diagram. Note that the bends in the lines occur at the strike prices, and that is where different stock positions begin and end.
  43. When do we use spreads? That’s right, a 5-10% gradual move. Not in a day or two or this week, but in 4 to 8 weeks. What’s different about a bear put spread? That’s right, we want a 5-10% down move .
  44. And our fourth spread is a bull put spread.
  45. It is the opposite of the bear put spread. We are selling the put with higher strike and buying the put with lower strike. This is a credit spread .
  46. And this is the opposite of the bear put spread. We are selling the 40 Put and buying the 35 Put. The net credit is $1.50, so that is the maximum profit.
  47. And here is your last chance to fill out a profit-loss table. Remember, we are short the 40 Put and long the 35 Put. (Go through line by line.)
  48. Take the numbers in the right-most column and draw the diagram. I am not going to go through this exercise in agonizing detail, but it is important that you understand what would happen. (Use as filler as necessary. Go through each step, if necessary.)
  49. We’ve gone through a lot so far, and some parts may have seemed repetitive, but if you want to learn how to use spreads, you must understand the mechanics of exercise and assignment. Here are the important concepts. Debit spreads are good for 5-10% price moves that occur over 4 to 8 weeks, and credit spreads are a way of selling options and limiting risk at the same time. How many of you prefer to “sell options,” and collect the premium? How many of you have had some sleepless nights? You can still lose money with credit spreads, but the risk is limited.
  50. After the break, I will show you the important features of OIC’s educational software, The Options Investigator. We will talk more about option price behavior, and we will also take a look at some other types of spreads.
  51. (Optional: There were some good questions during the break, and I would like to discuss one in particular…) In this second half, I will first demonstrate The Options Investigator software. Then I will talk more about option price behavior and more spreads.
  52. Here is what The Options Investigator’s main page looks like. Some of the great features are the tutorials , the strategy explorer , and the position simulator .
  53. Within the strategy explorer is the option calculator. This is a simple tool, but it is very valuable in learning about option prices and comparing strategies. If you have an opinion and you can’t decide between two strategies, then the pricing calculator will help you quantify your thinking, and that might help you decide. The first thing you do is input the “settings” that do not change. You need the date, because the calculator figures out the days to expiration. You also input the current stock price, interest rates, and an estimate of volatility.
  54. To enter a Bull Call Spread, you enter the strike price and the price of the long call, and then the strike price and price of the short call. The calculator figures out the net cost and the delta of the position. This is a 60-65 Bull Call Spread established for a net debit of $1.98 or $198.
  55. This graph is the graph of “today’s” profit or loss if the stock price moves today. You can change the days to expiration moving the slide under “Test Date.” The calculated dollar profit and loss appears in the upper-left section.
  56. Here is a graph of the strategy at expiration – just like the ones we drew before the break.
  57. Like any software, The Options Investigator takes some time to learn how to use, but it is a very helpful tool. If you want to learn about options, or if you want to move beyond the basic strategies, then it is very worthwhile to take the time to learn how to use this software.
  58. On to the next topic.
  59. Some of you undoubtedly noticed that the debit call spread and the credit put spread looked very similar. The question is why? They look alike because the ending position is the same, whether you are below, in between, or above the strike prices. Also, the maximum profit potential and maximum risk are very similar. There is actually part of options theory known as “put-call parity” that explains exactly why this is, but you don’t need to know the theory. This happens throughout options, and I tell people not to worry about it. The most important thing is to have a forecast and to pick a strategy that is within your risk limits. That is how money is made over time.
  60. What I just said also is true for the credit call spread and the debit put spread. They look alike, because they result in the same position and they have the same maximum profit potential and risk.
  61. Several of you traders were asking me about options pricing during the break, so let’s get into pricing and how it affects trading decisions. On this slide, we are looking at the deltas of each option and the net delta of the 60-70 Bull Call Spread. Note that the net delta is in between the deltas of the two individual options. Remember, time decay is not in delta, so this is just an estimate of option price change if the underlying stock price changes today. If there is a big price move today, then the spread will not make the most.
  62. Taking a step back for just a second, we cannot forget that options are simply insurance policies.
  63. And volatility is like the “risk factor” in an insurance policy. If there is higher perceived risk, then insurance premiums rise. In the stock market, the perception of risk changes all the time. When an earnings report is due, then everyone is more worried that the stock price will change in a big way – up or down. When this happens, option buyers scramble to buy options, and option sellers back off. The result is that, other factors being constant, option prices rise. Implied volatility is what explains the market price of an option.
  64. Here is a simplified example. With the stock price at $63 and a given interest rate, a given number of days to expiration and some dividend assumption, then here are option prices under two different assumptions. If implied volatility is 40%, then the option prices would be $5.50 and $2.00. However, if the implied volatility is 30%, then the prices would be $4.00 and $1.00. Can this much of a change happen in a day or two? Yes. While it is not a frequent occurrence, implied volatility can and does change, and it can change dramatically.
  65. So let’s look at a trading scenario in which you expect implied volatility to decline. There might be an earnings report next week, and we might think that, after the report, implied volatility will decline.
  66. If this is our forecast, then let’s see what happens. We are forecasting that the stock price will rise from $44 to $50 this week, because of great earnings. But we also think that implied volatility will drop as all the option buyers before the report are now selling their options to realize their profits. If this is our forecast, what strategy should we pick? These numbers come out of the Investigator, so let’s see. The 45 Call rises 100% - very nice. The 50 Call rises 80% - very good, but second place. The spread – look at this – rises 120%. Yes there are two commissions, but with the higher profits, you can pay those commissions. This is an example when spreads are the strategy of choice.
  67. Remember, spreads will not always be the strategy with the highest expected profit, but sometimes they will be. If you learn to study more than one strategy every time you trade, then there will be times that you pick vertical spreads.
  68. Here is a variation on straight vertical spreads – diagonal spreads.
  69. They are called “diagonal” spreads because one strike price is in a different month. For diagonal spreads with calls, the long call has a lower strike and a longer time to expiration than the short option.. For puts…
  70. Here is an example of a diagonal spread using LEAPS – long term options. Has anyone in the audience done this strategy? Did you do it as a substitute for covered calls? That is the common motivation. This spread is more expensive than a straight vertical spread, but is much less expensive than a covered write.
  71. This is kind of a mind blower graph, but it shows the profit or loss at expiration of the short option. If the short option of a diagonal spread expires, then you are left with the risk of owning a long call. If the stock price rises dramatically, then the time value of both options goes to zero, and there will be a loss. You need to know this, because you need a stop-loss point on both the downside and on the upside.
  72. Unfortunately, it is never as simple as it seems. Diagonal spreads can get complicated if the short option is assigned. This is why you have to thoroughly understand exercise and assignment.
  73. How many of you have heard of straddles (and strangles)? Has anyone traded them? (Why? Why not?) They are not as complicated as they might sound.
  74. A straddle is simply buying both a call and a put with the same strike price and the same expiration.
  75. This is the “50 Straddle” on LMN stock.
  76. Can you quickly fill out the profit-loss table?
  77. And draw the diagram. What is the stock position if the stock price is below the strike price at expiration? What is the stock position if the stock price is above the strike price at expiration?
  78. If you think this stock price could change by $10 in 4 weeks, then you could use The Options Investigator software to estimate the potential results as follows: Here we have an estimated profit on the straddle of 67%.
  79. The difference between a strangle and a straddle is that, with a strangle, the strike prices are different.
  80. This is a 45-55 Strangle. Notice that it is “cheaper,” $2.45 versus $6.20.
  81. Here is the profit-loss table.
  82. And here is the diagram. There are three possible outcomes: above the higher strike, between the strikes and below the lower strike. Above – the call is exercised – long stock Between – both expire – 100% loss of premium paid Below – the put is exercised – short stock
  83. And here is the estimated result if the stock price rises $10 in 4 weeks. This is a 140% profit. Which is “better,” the straddle or strangle? Straddle (from slide 66) – $6.20 – 410.35 up 67%, profit of $4.15 Strangle $2.45 – $5.90 up 140%, profit of $3.45 Percentage or dollars? What are you after?
  84. Neither is “better,” they both have trade-offs. If you had “$13,” then you could buy 2 straddles (approx.) or 5 strangles. In this case, the 140% profit from the strangle is better. However, if you “buy 5,” then the larger dollars of the straddle are better. Review other trade-offs.
  85. So far we have talked about options-only spreads, but most active traders will combine options positions with stock.
  86. This is kind of a “laundry list.” We don’t have much time, so I picked just one. It is the second one on the list.
  87. Buy stock and sell strangle is very popular. Have any of you done this? Remember, there is a short put in this strategy, so you need special approval from your broker.
  88. In this example, we are not told how many days there are until expiration, but let’s say it is 60 days. If the stock price is unchanged, then we keep $4.50 on a $57.50 investment. If we could repeat this five more times in a year, then we would make $27 over the year on a $57.50 investment. That is over 50% before commissions. You can see why people are drawn to this strategy, but we can’t forget the risks.
  89. First, look at the profit and loss table.
  90. Then draw the diagram. Note that, if the stock price is below the lower strike price, then the short put is assigned. That means we have to buy more stock. And then we would be long 200 shares. That means we have to come up with more money! Potentially, the risk is very big. This is a good strategy for aggressive traders who can stay on top of the market and who can take a loss if the market goes the wrong way.
  91. This is appropriate for a neutral market forecast. The short put means that special approval might be required. Upside profit is limited, and risk is leveraged on the downside. The strategy must be watched closely!
  92. Wow! We have covered much material this evening. Let me leave you with three thoughts. First, spreads are a possible next step after the basic strategies of buying options and covered calls. They tend to be used by more active traders, but they have a wide range of uses. Second, an understanding of option price behavior is important. Generally, spreads are not the best for very short-term trades. They tend to be best for 4-week to 8-week trades and a 5-10% stock price move. If you really get into trading earnings reports and other “events,” then spreads can protect you against declining implied volatility. Thank you all for coming. Please fill out the evaluation. Visit us at 888.options.com or call us at 888-OPTIONS.