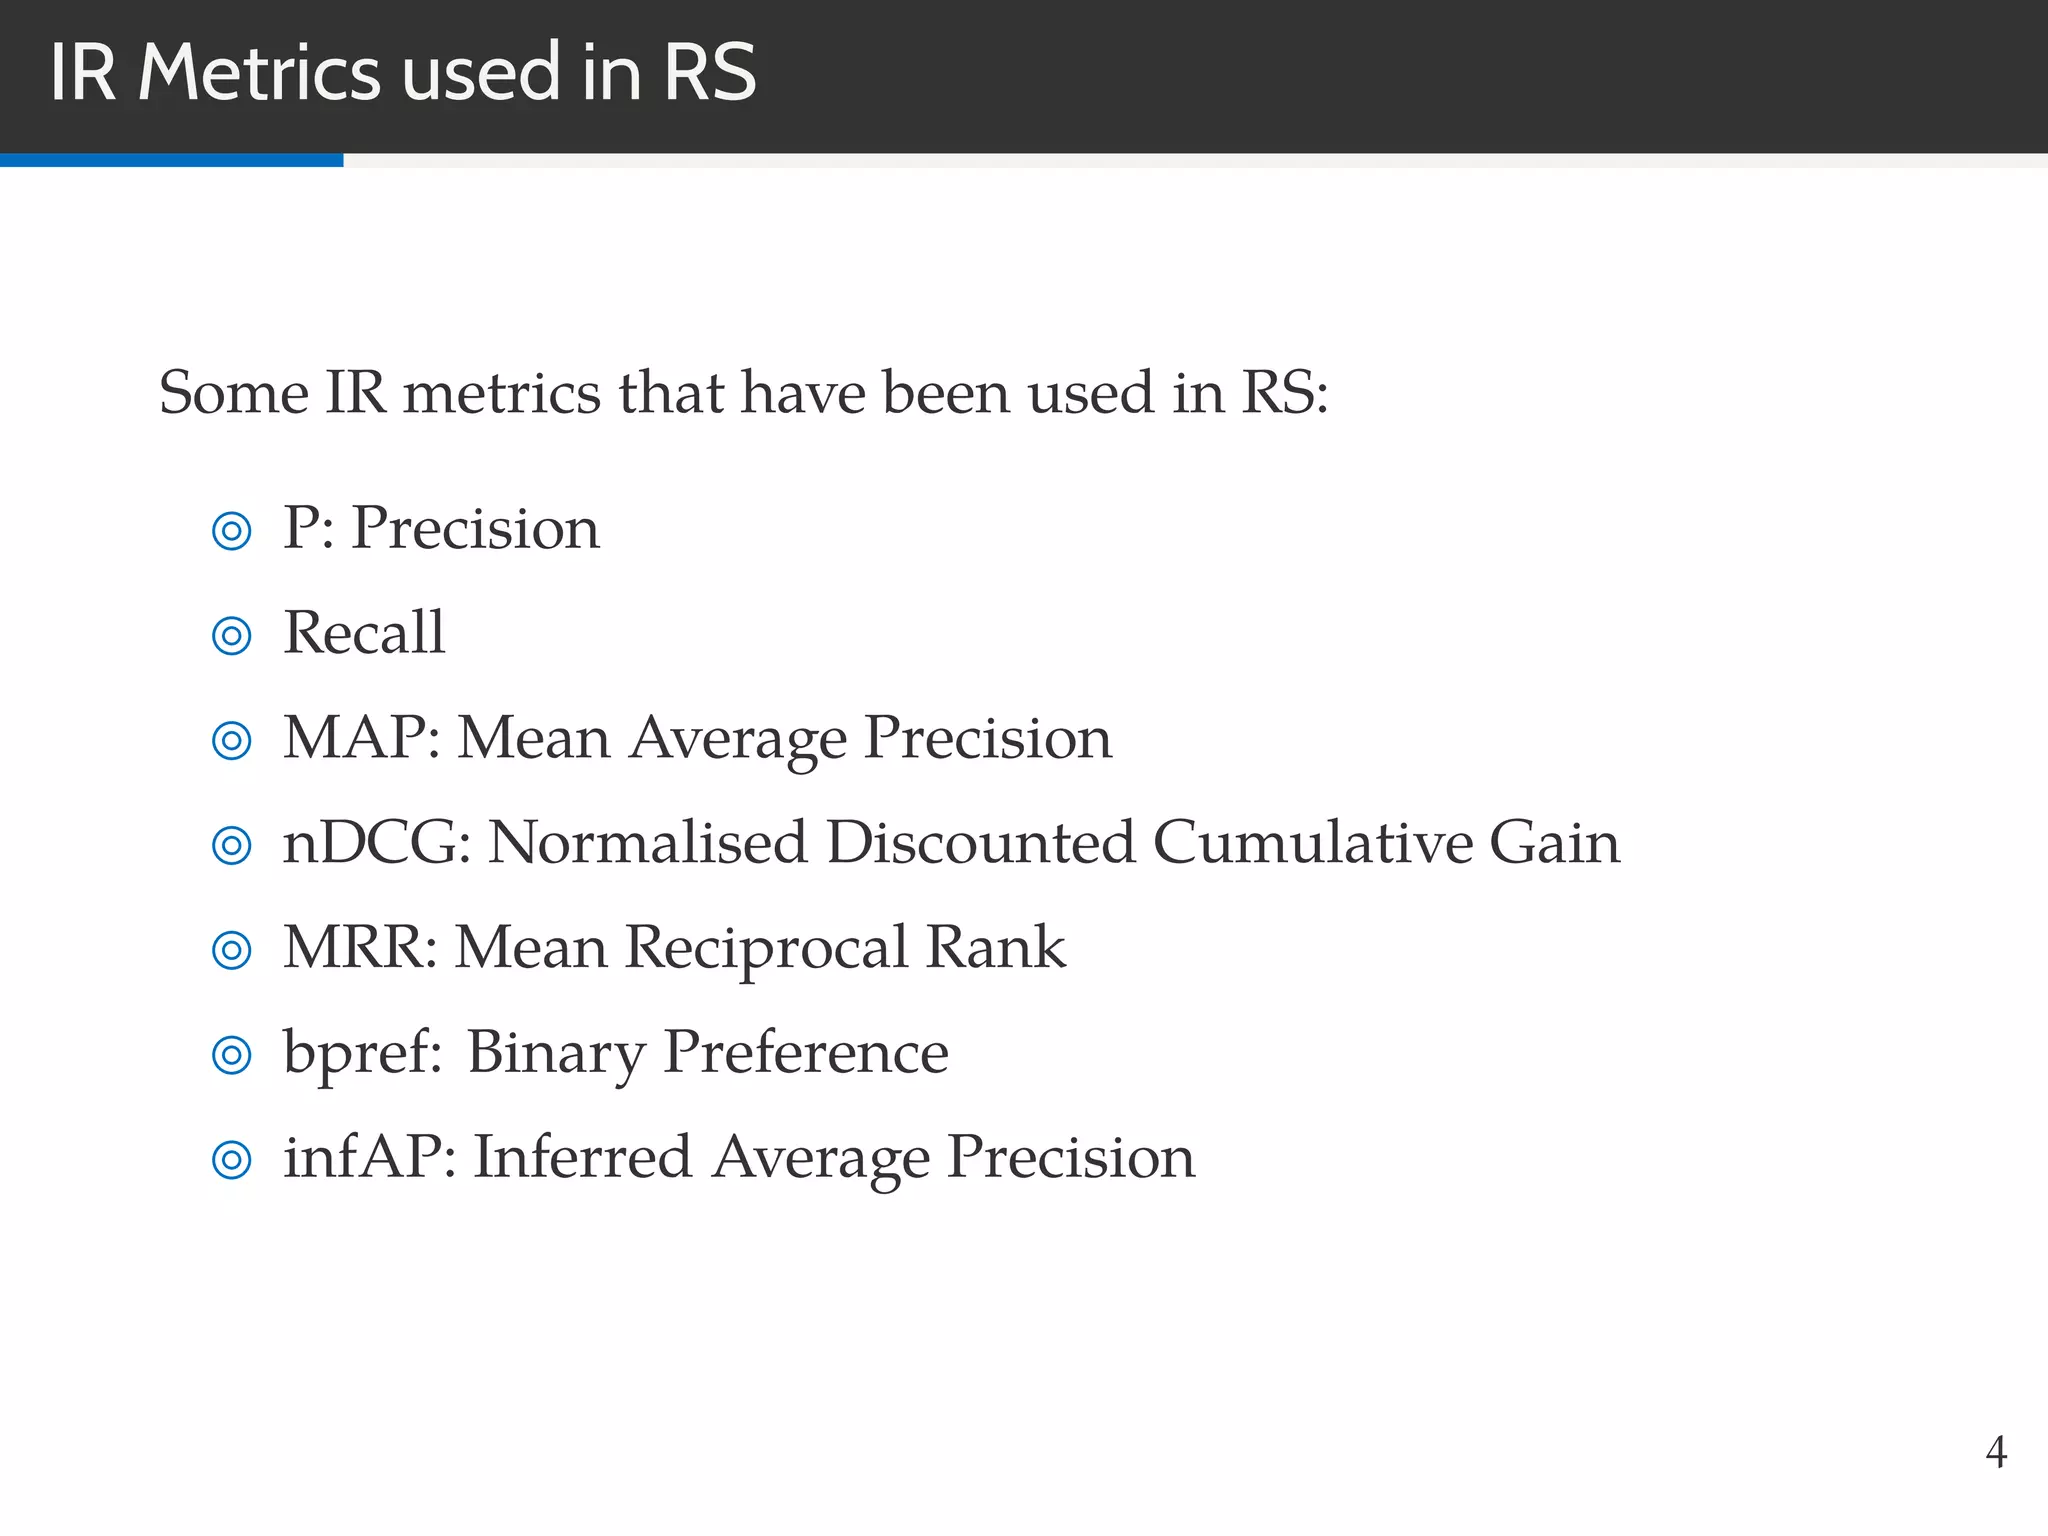
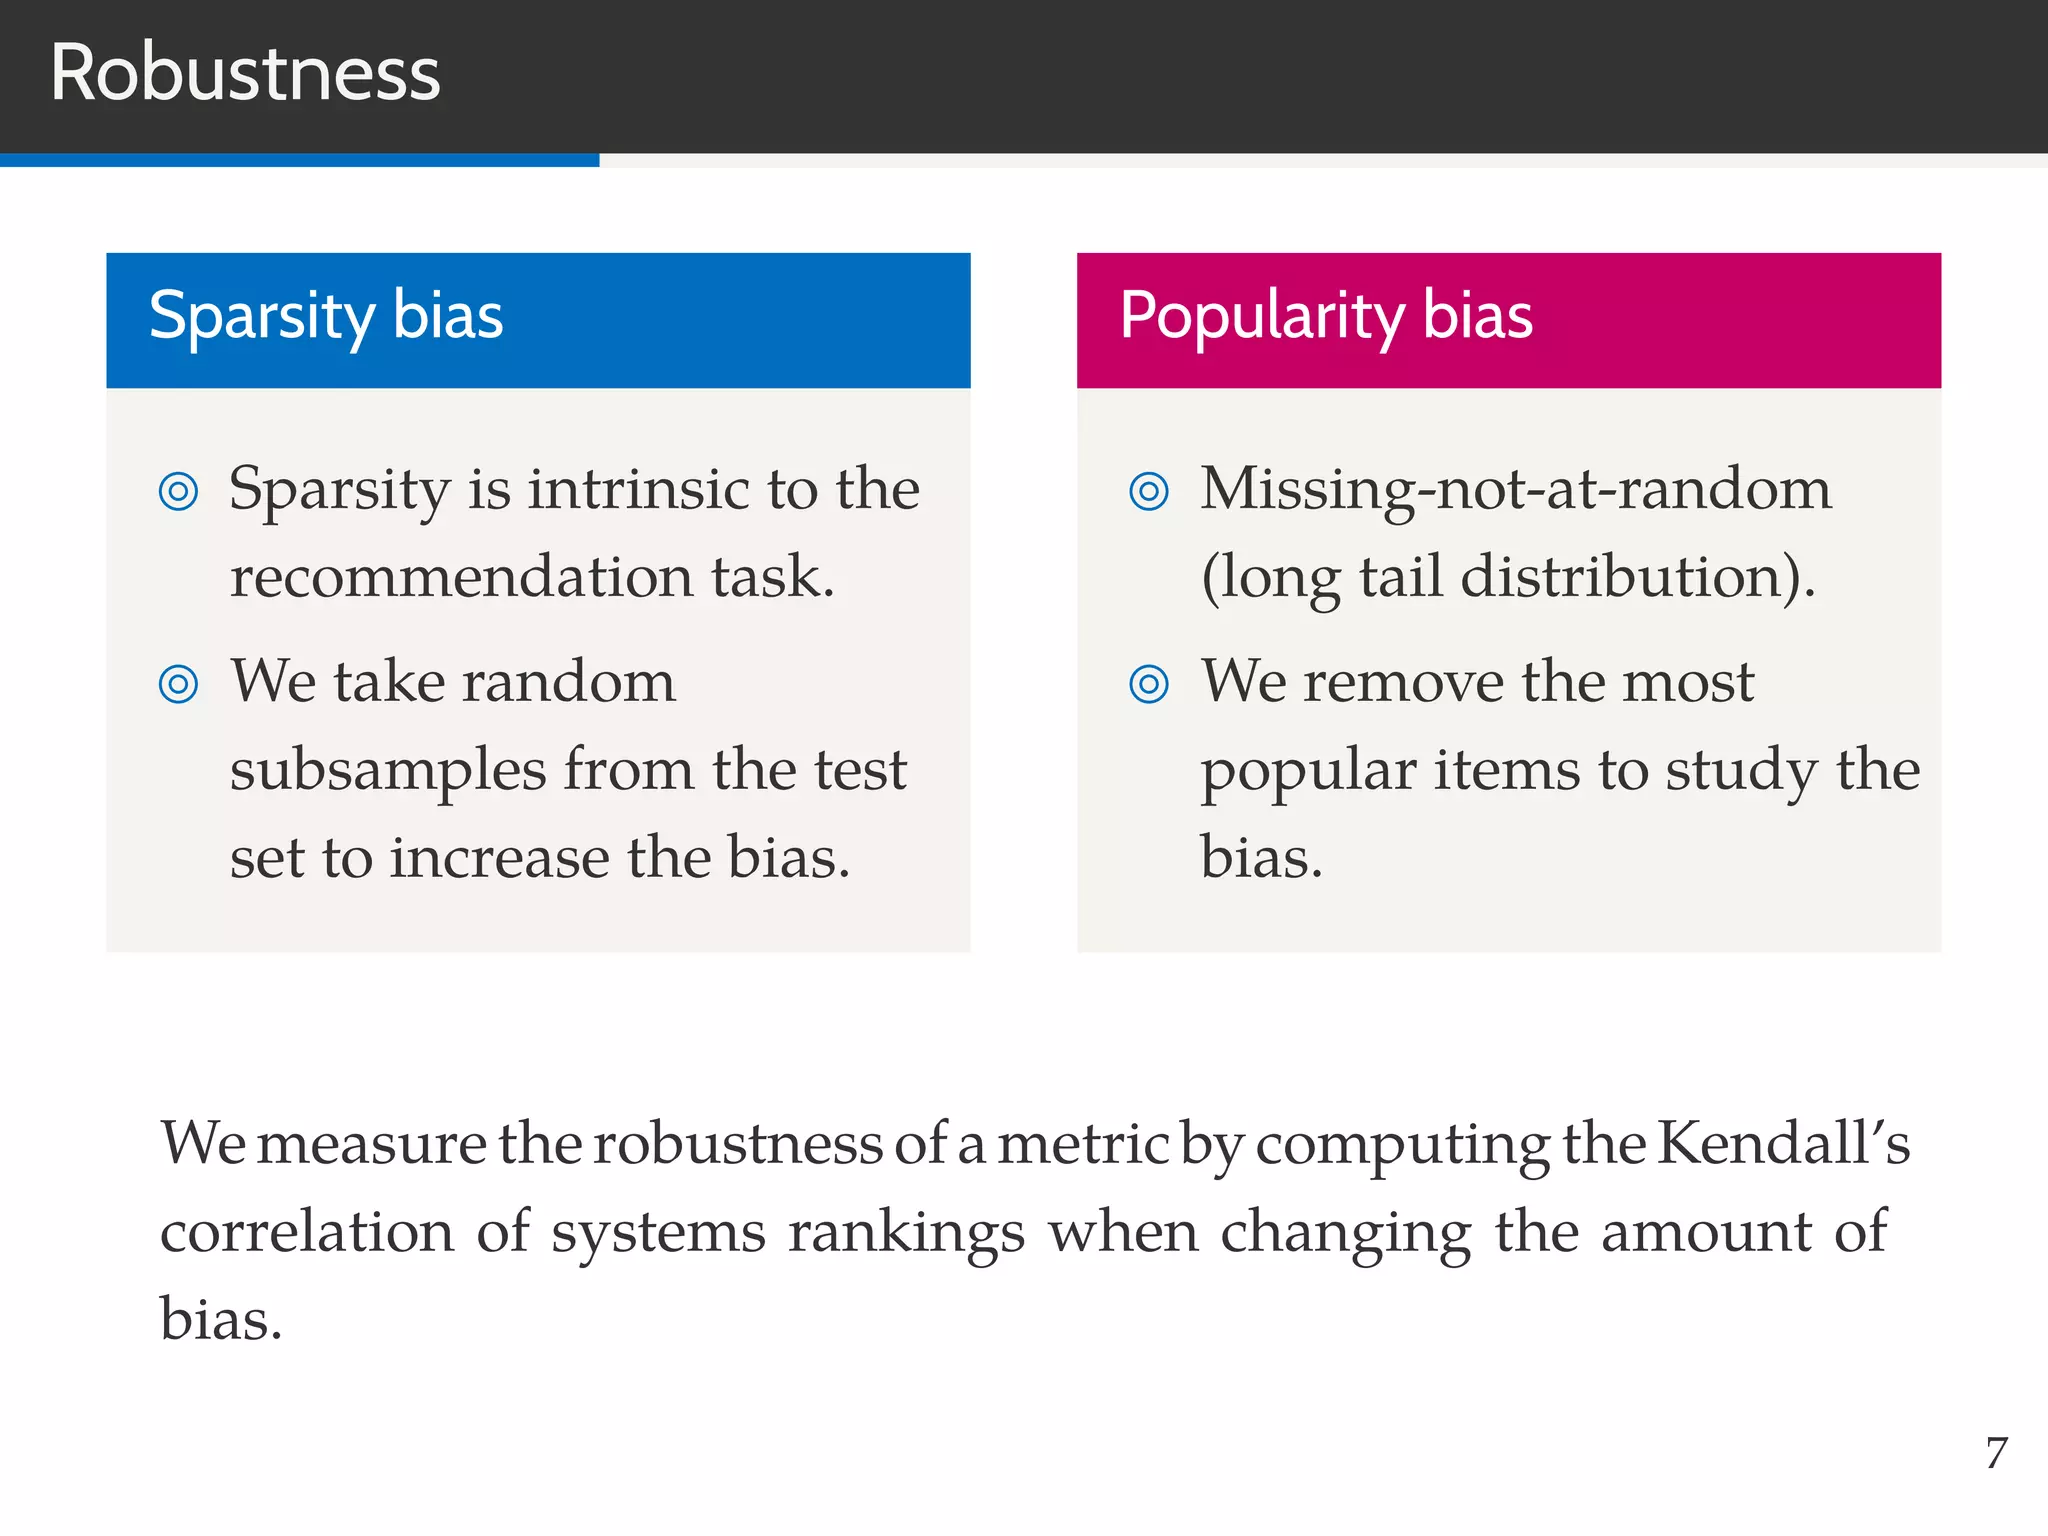
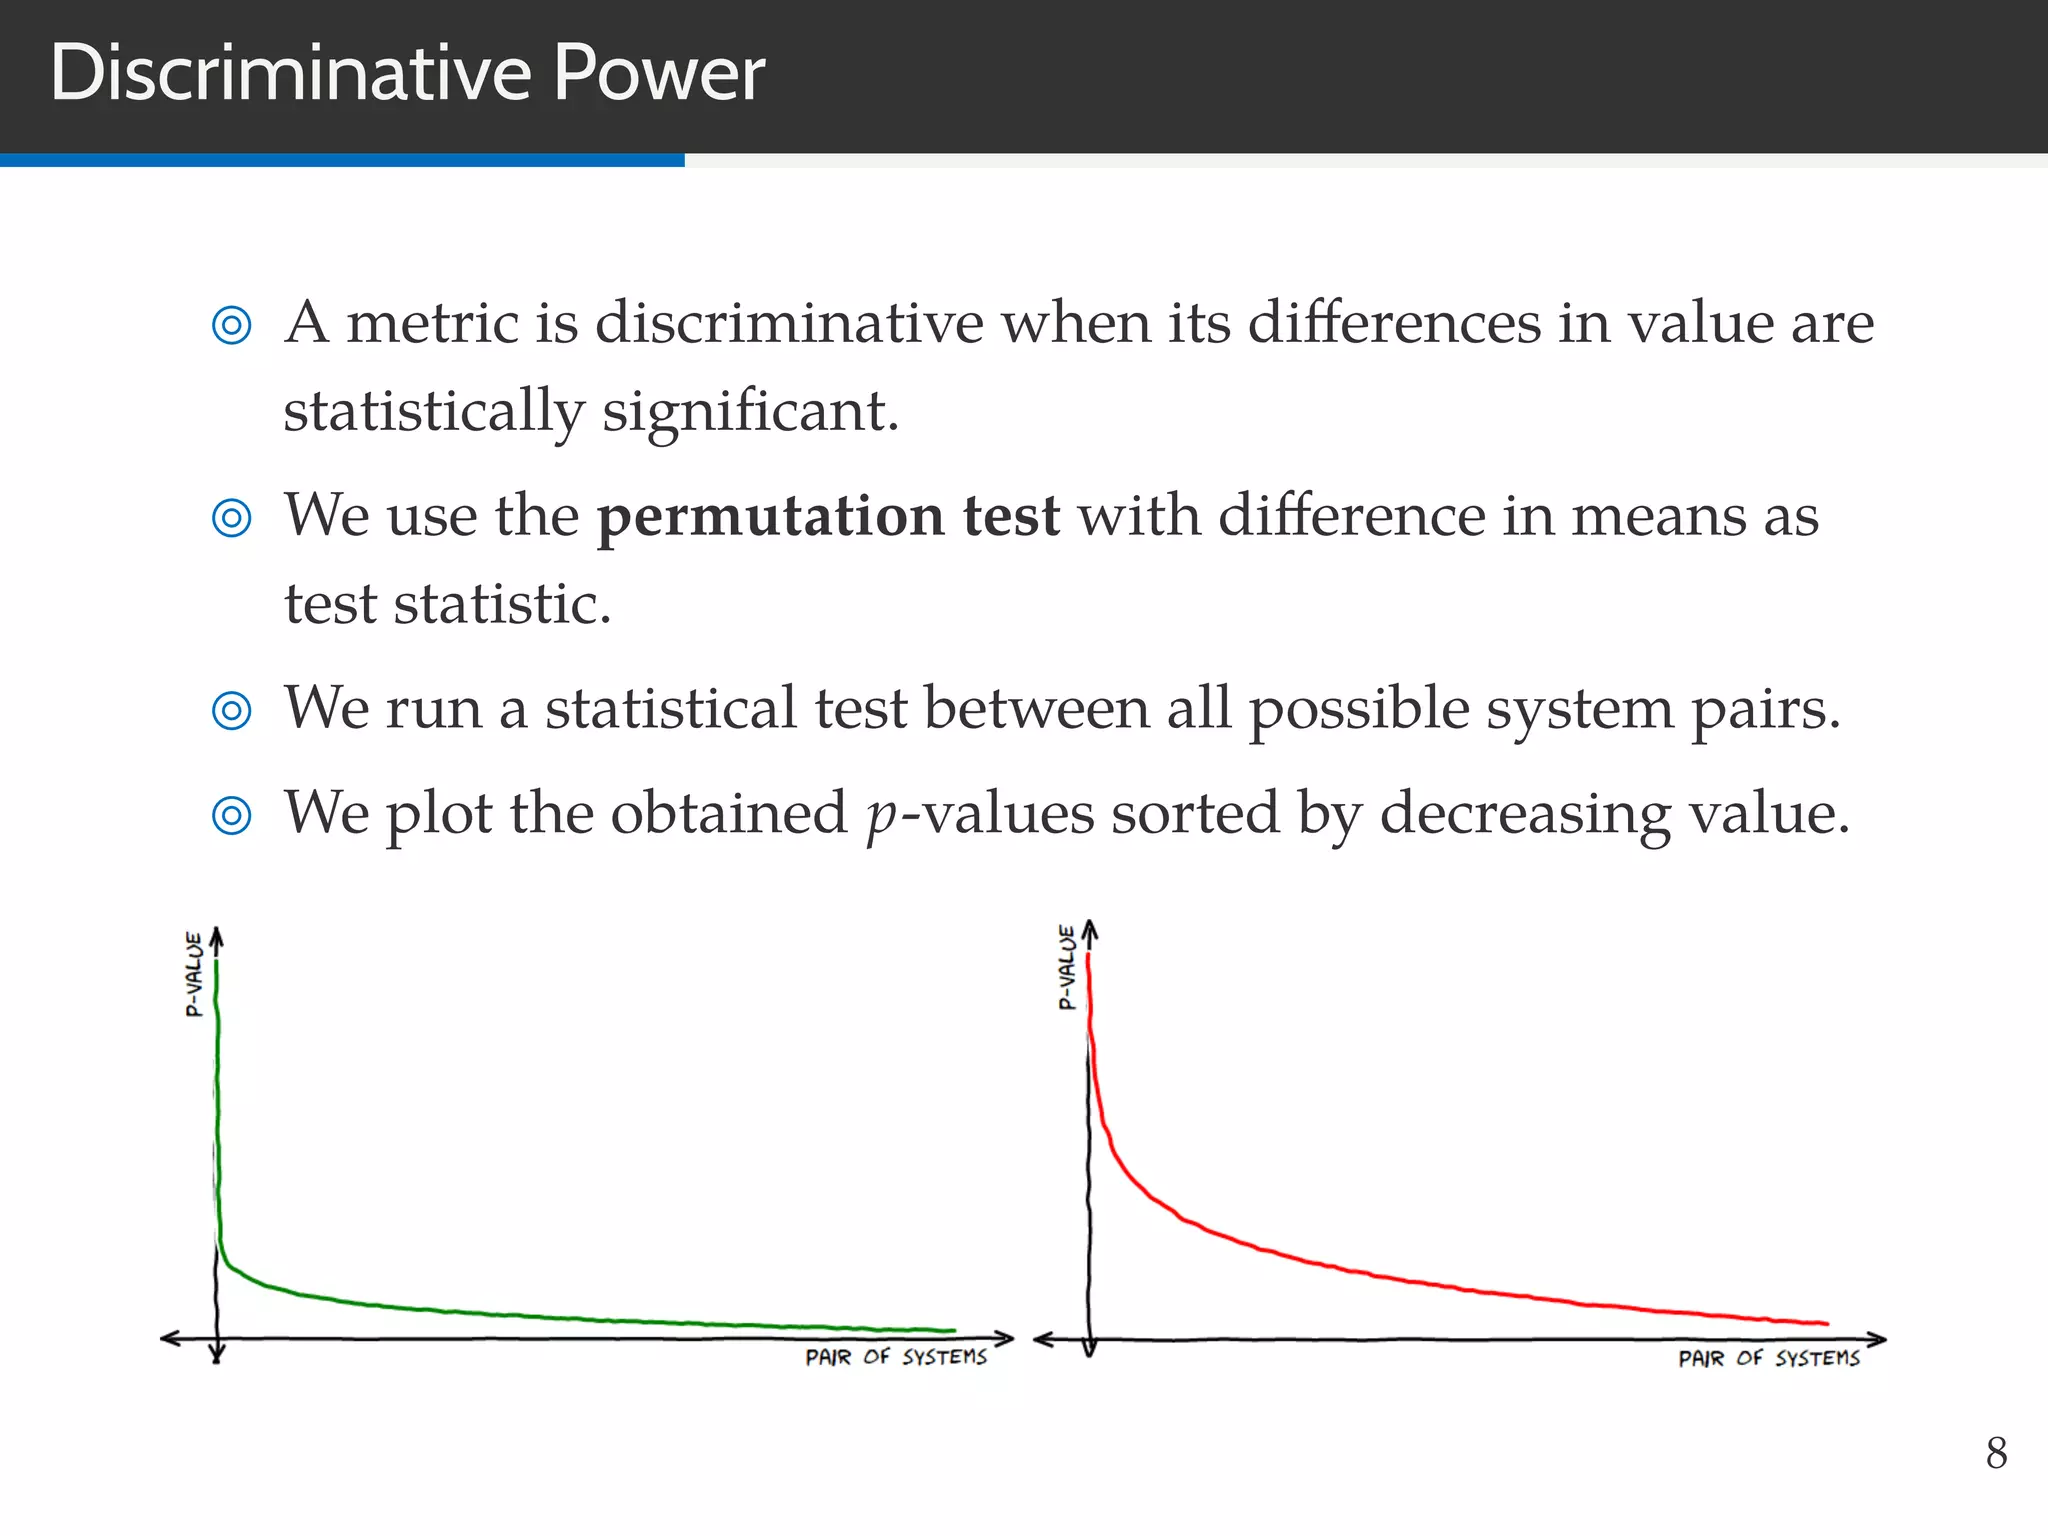
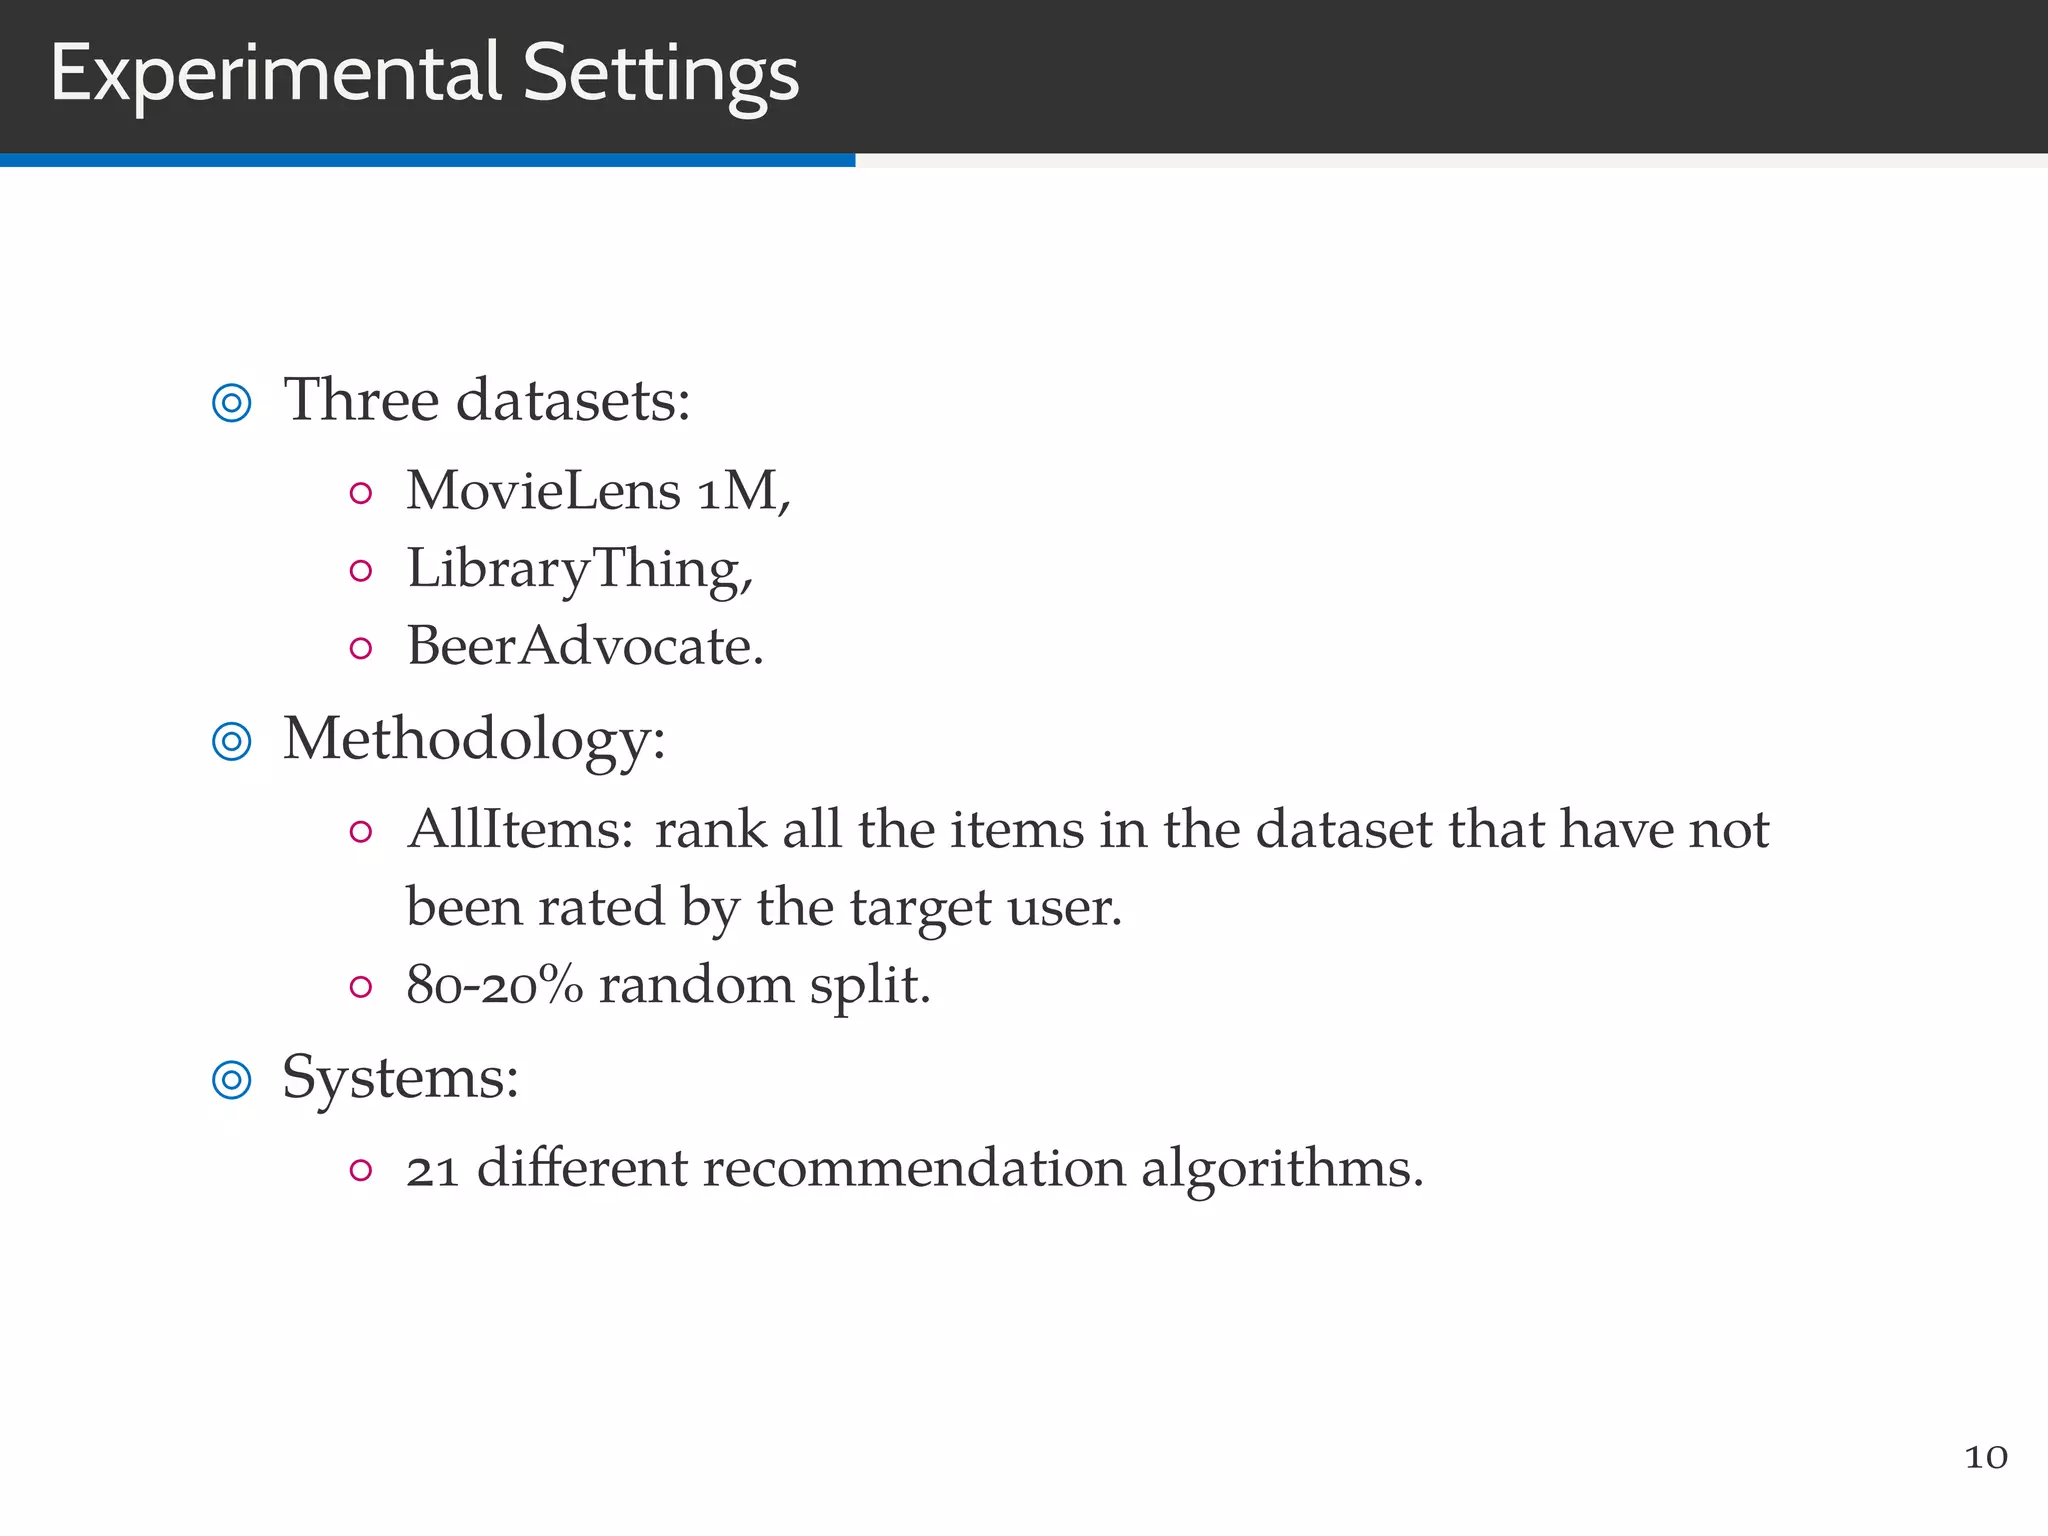
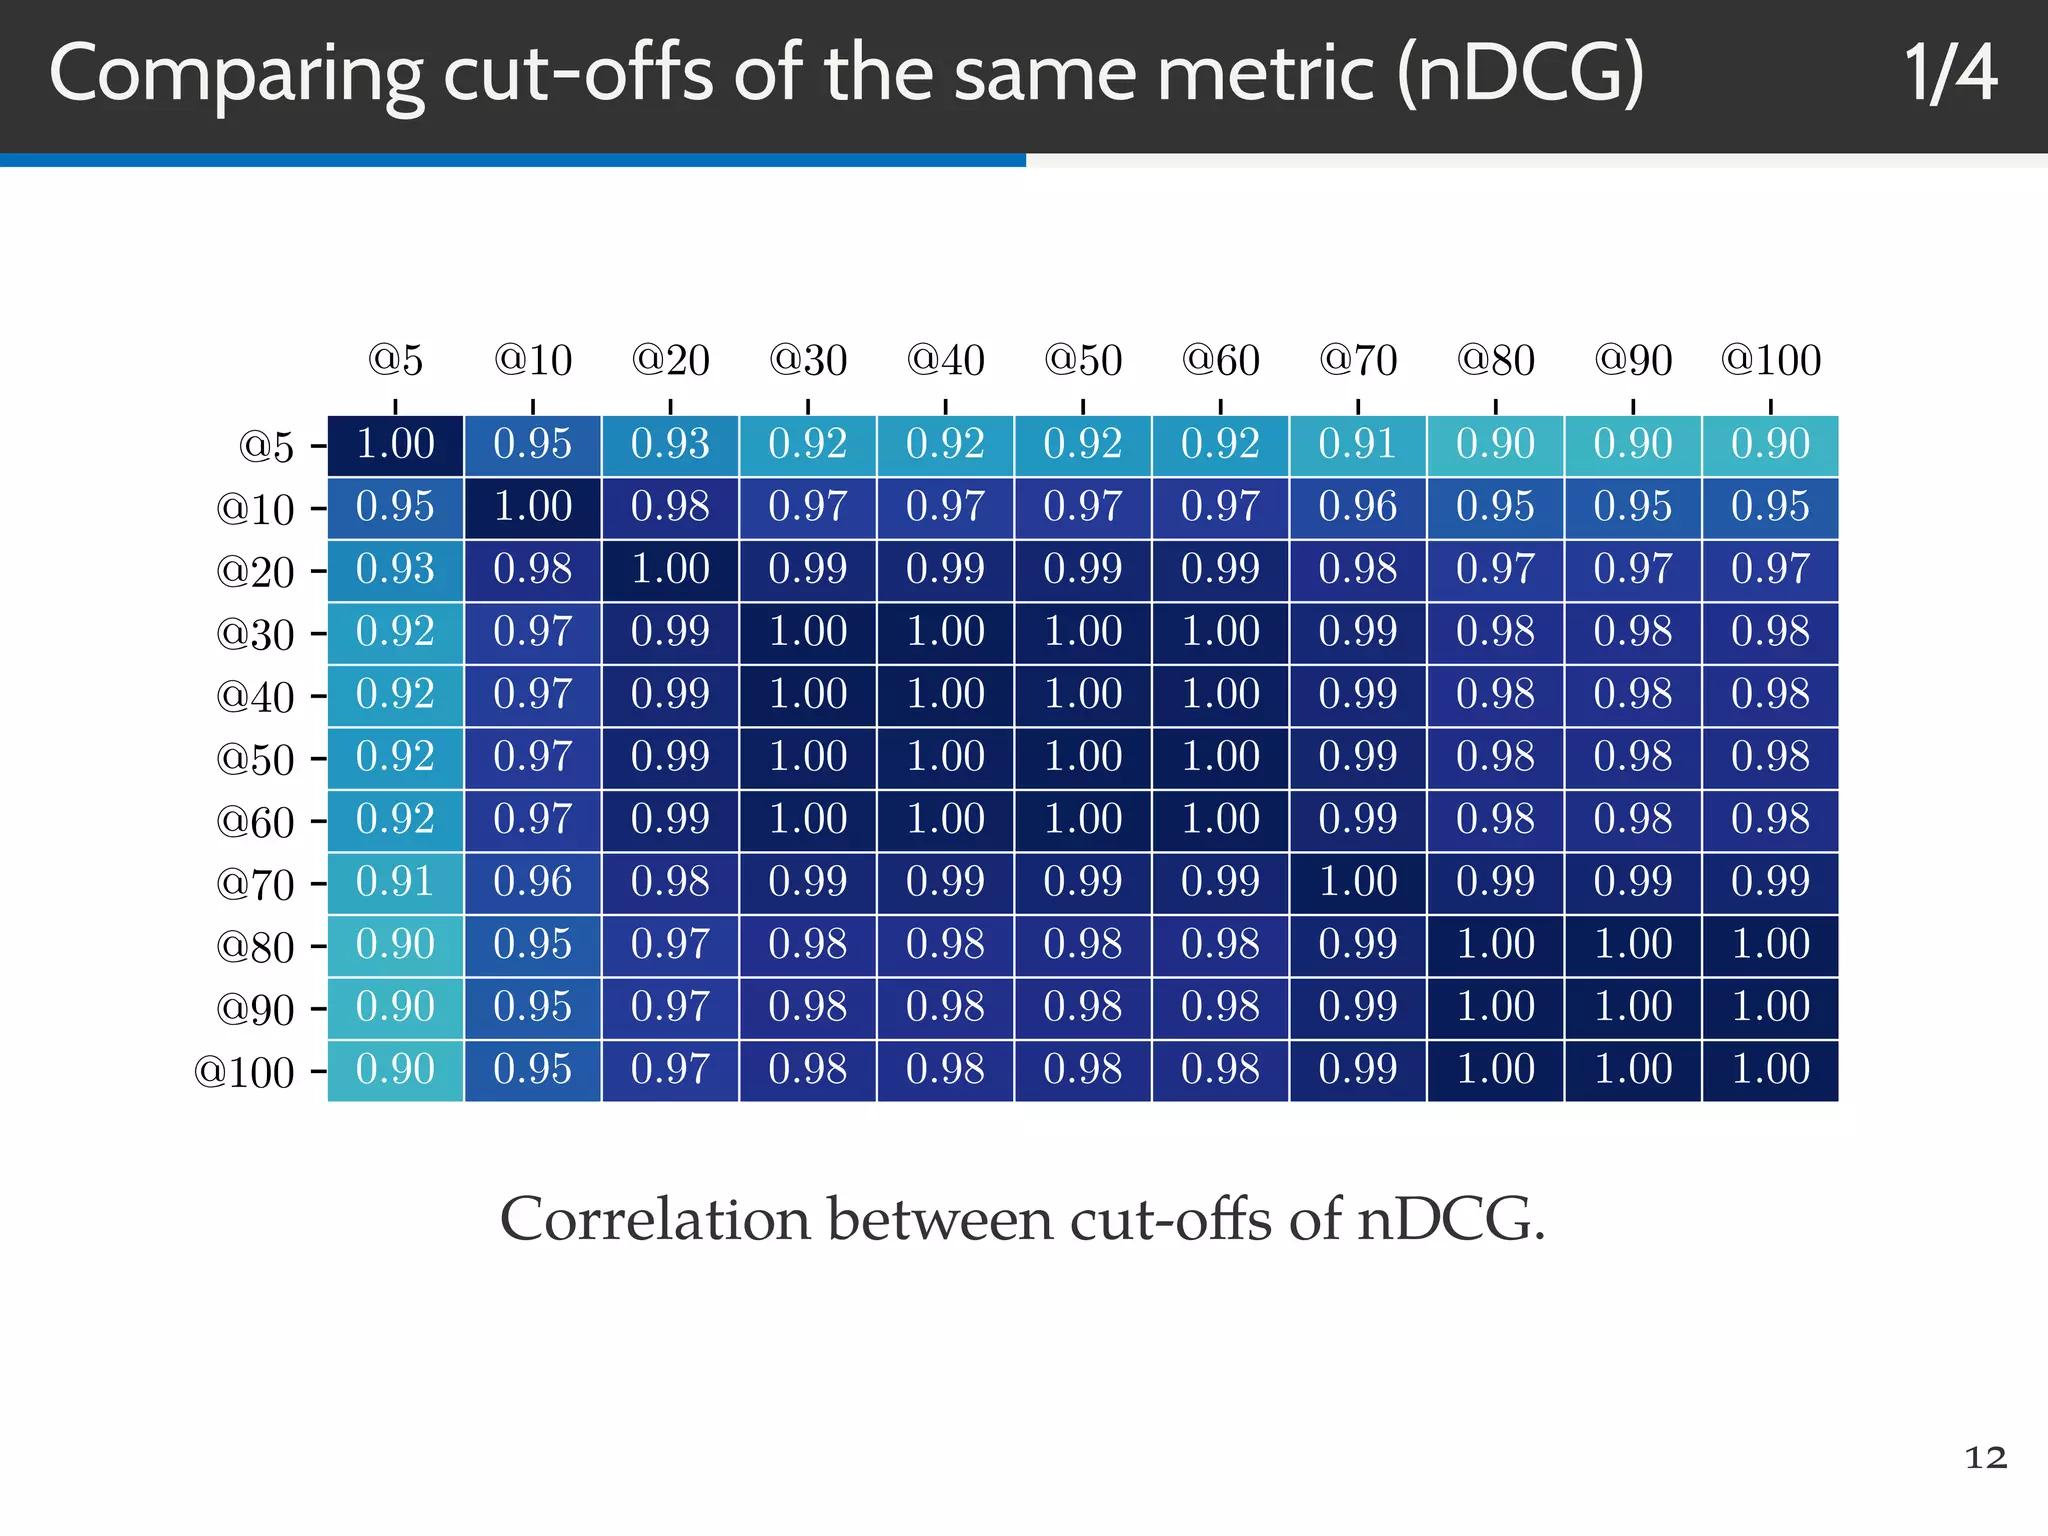
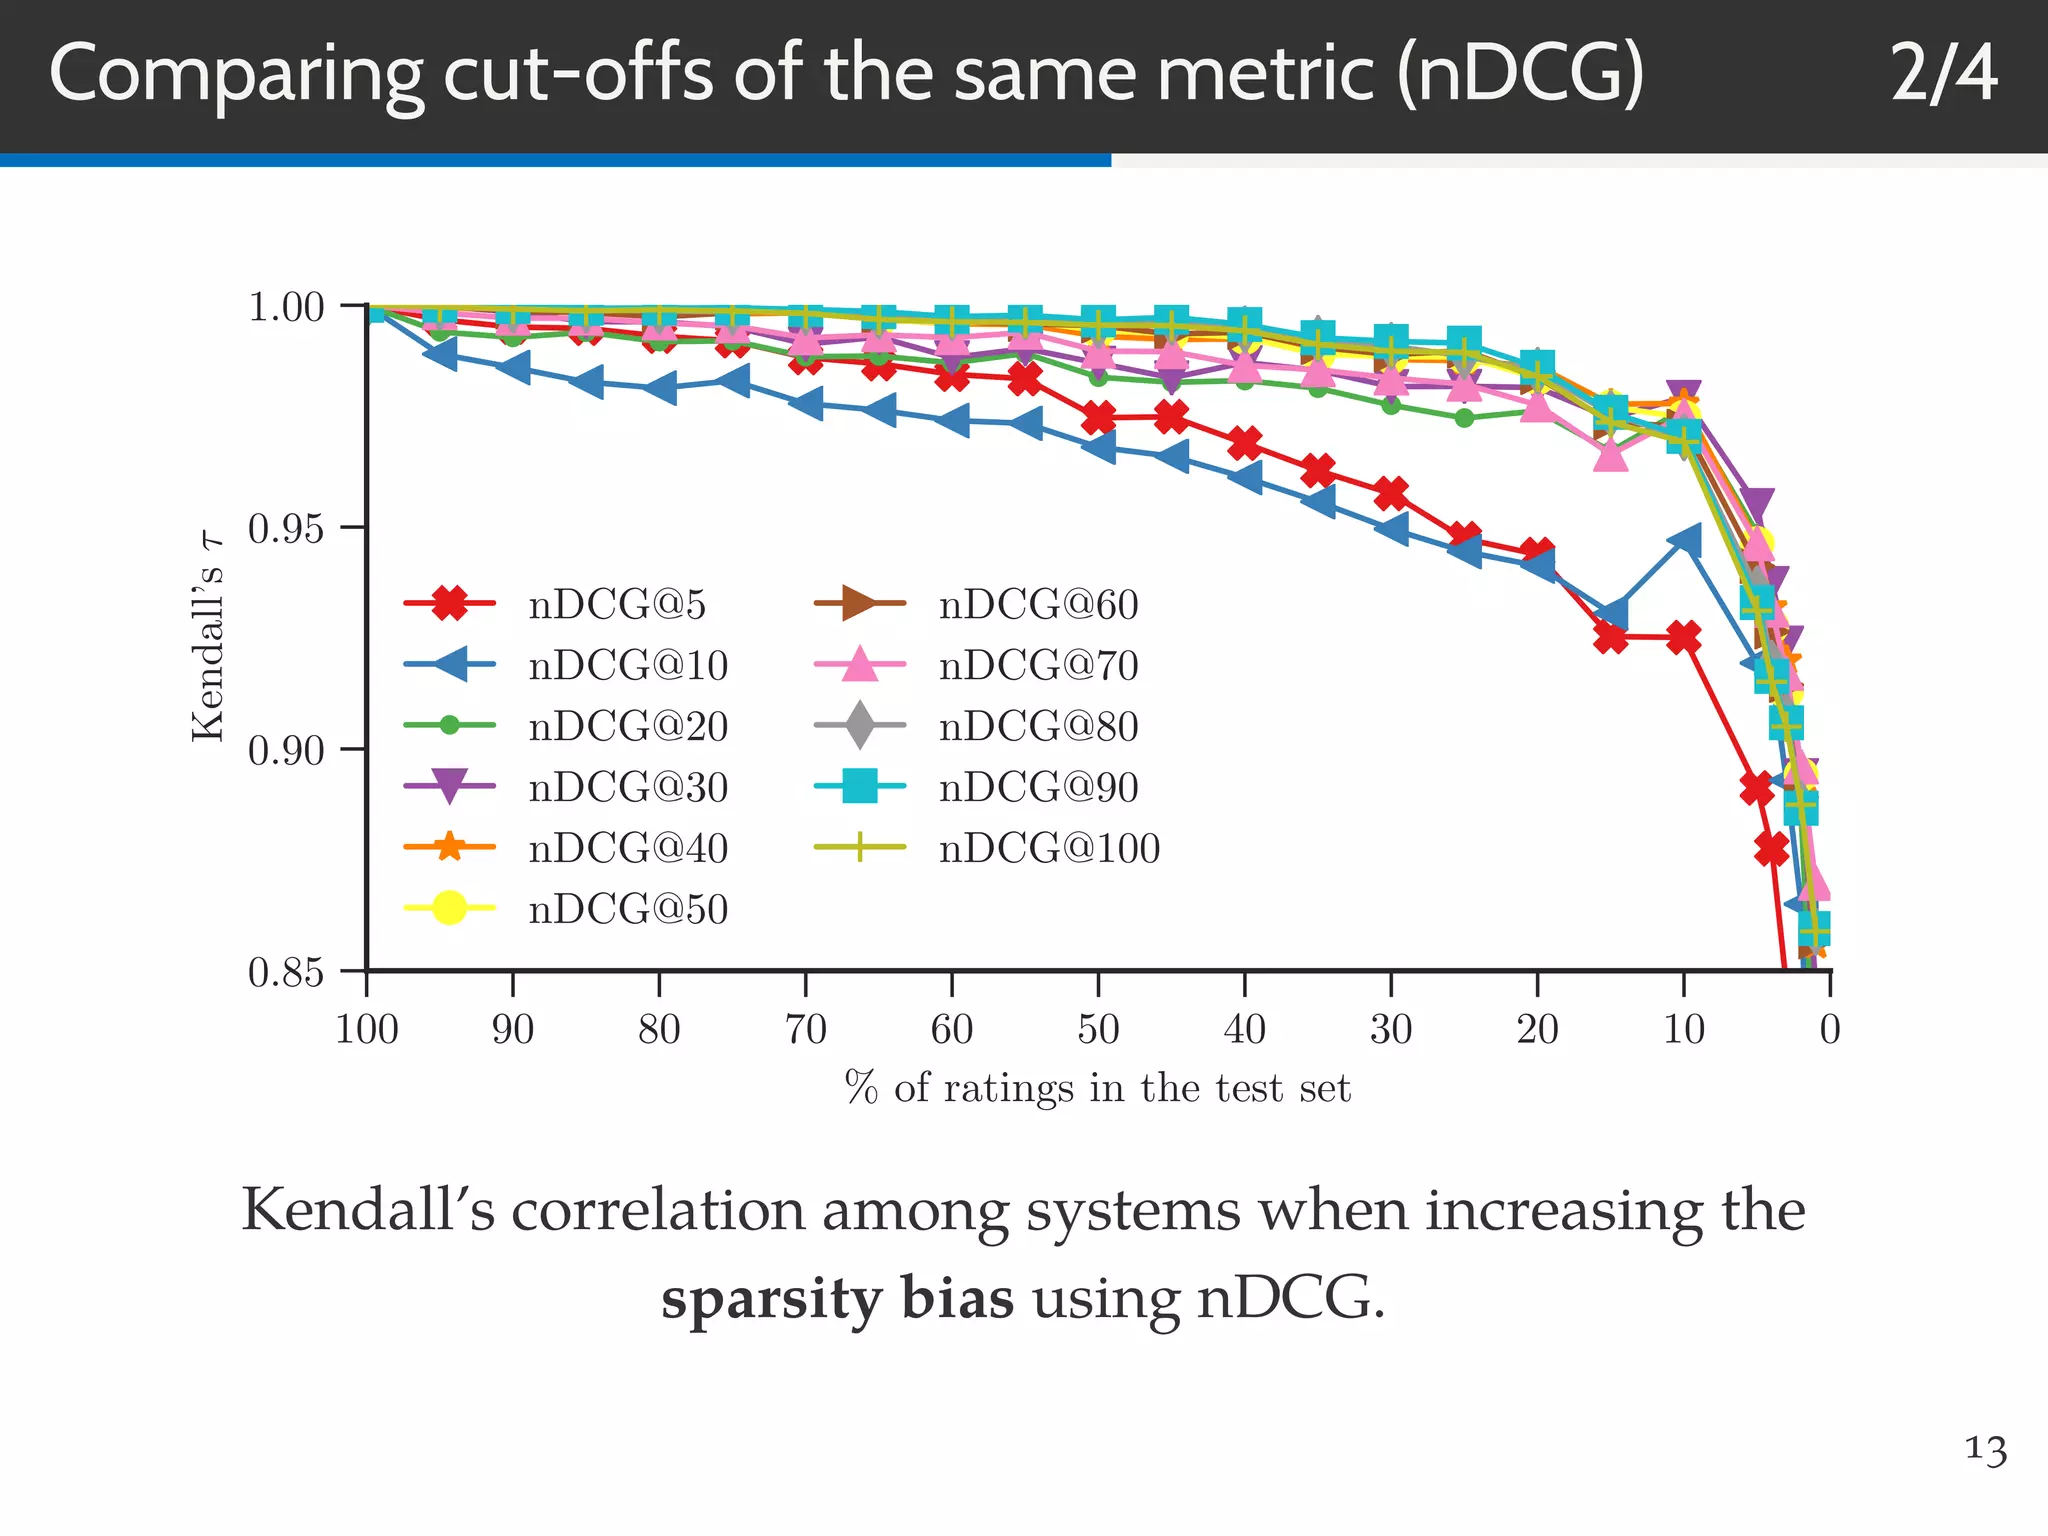
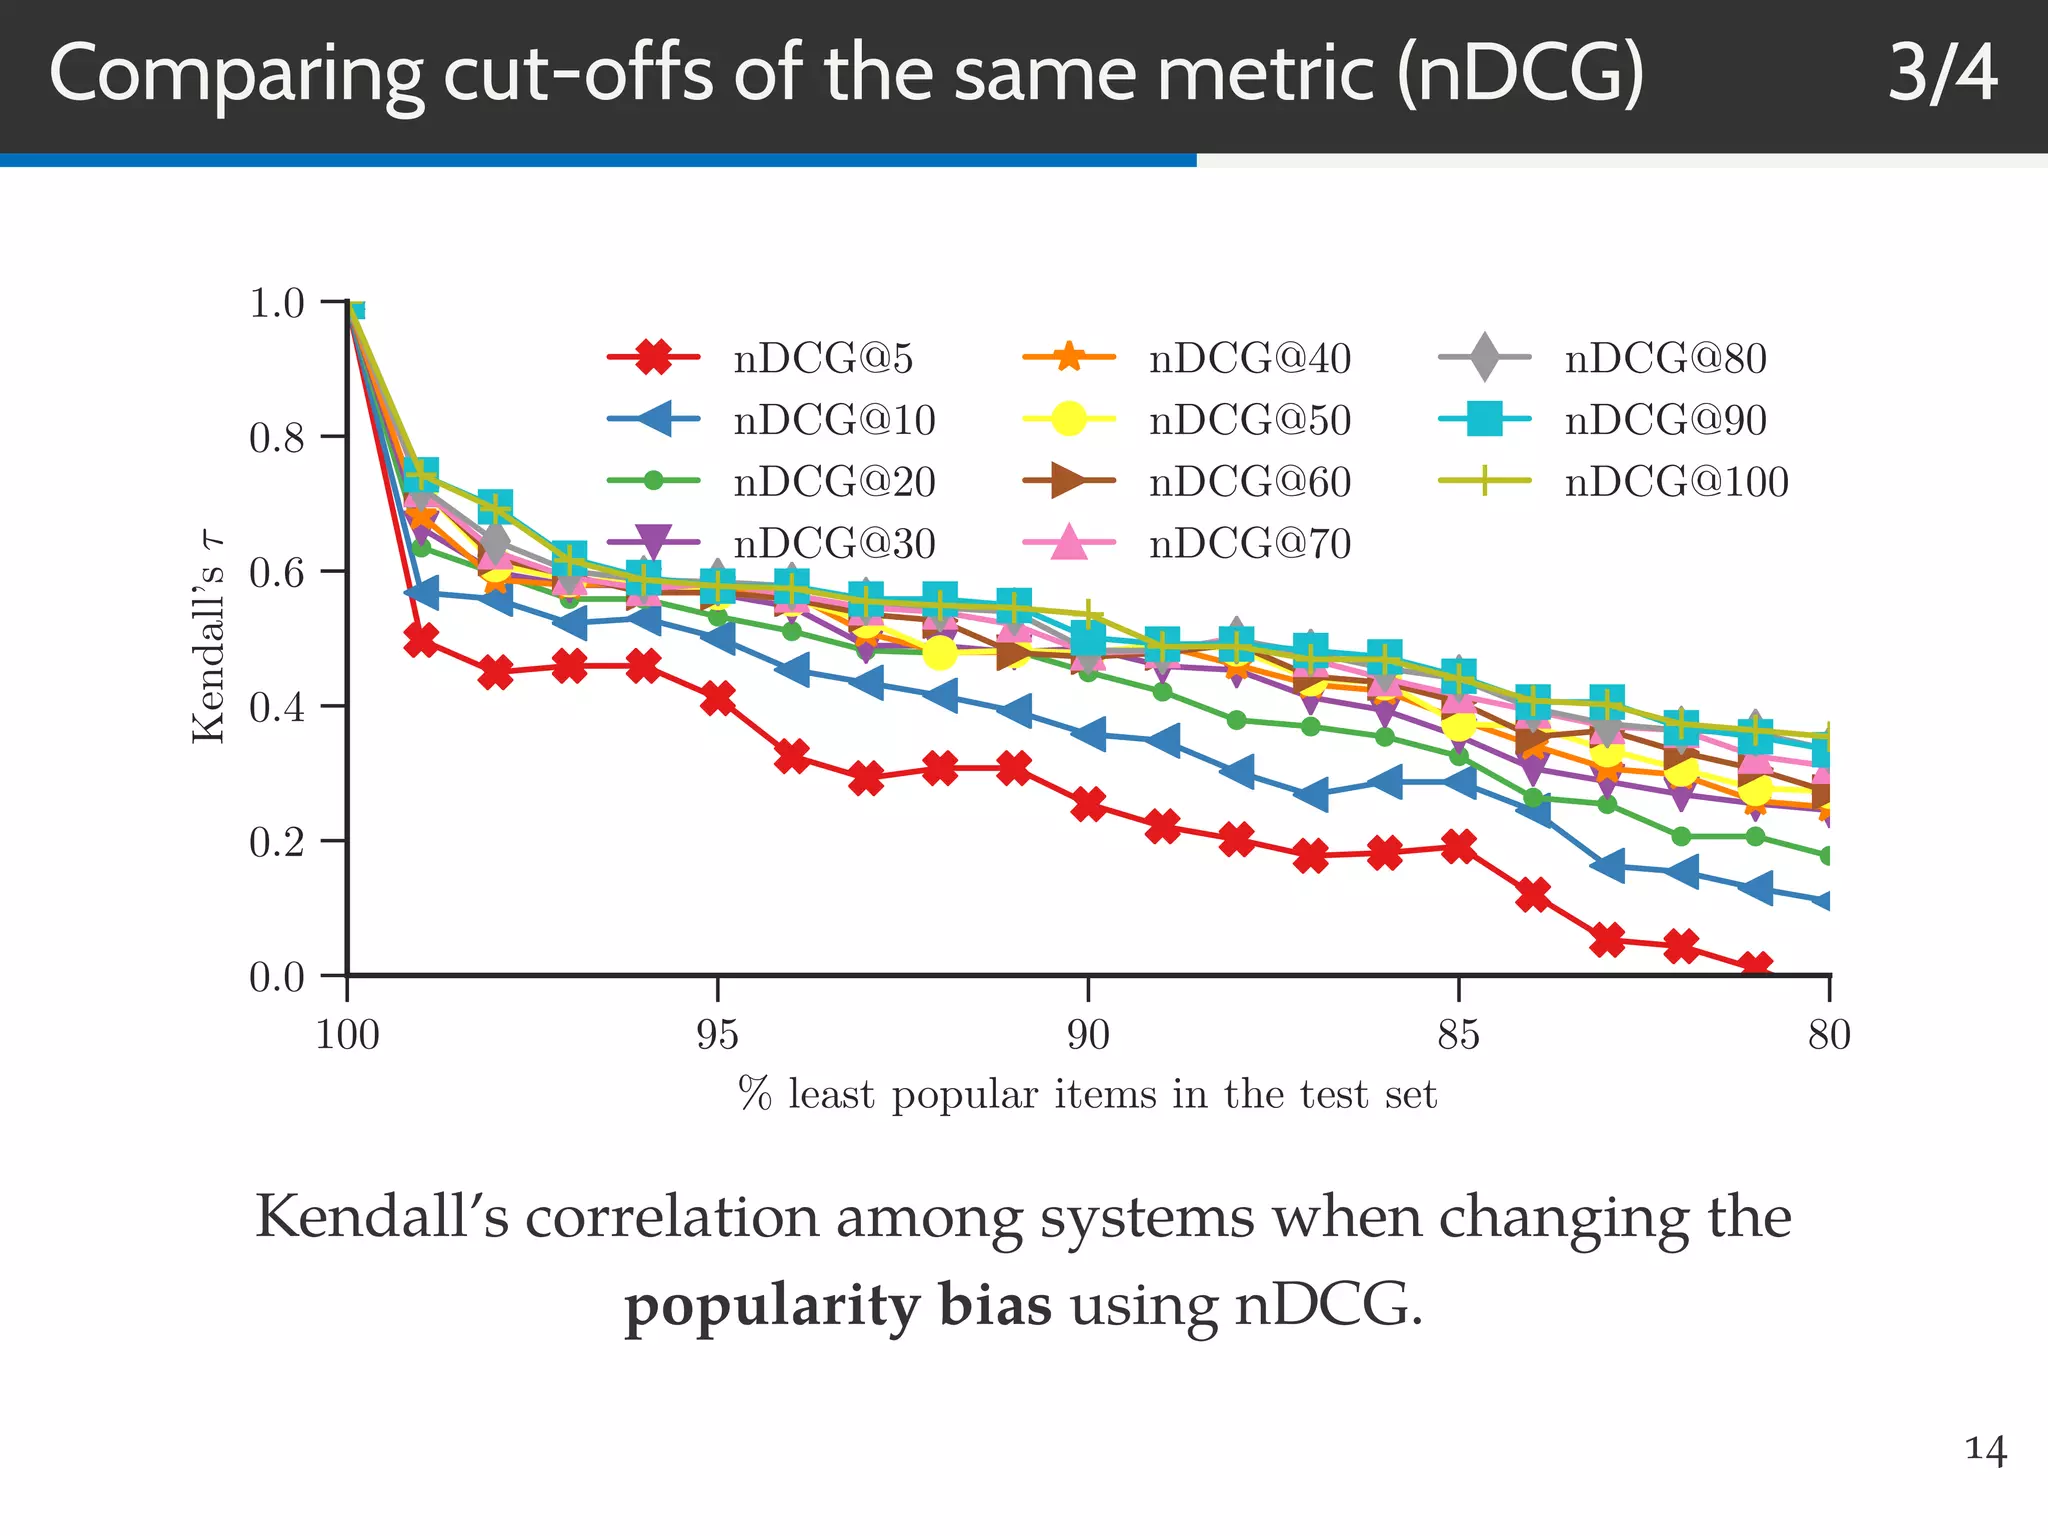
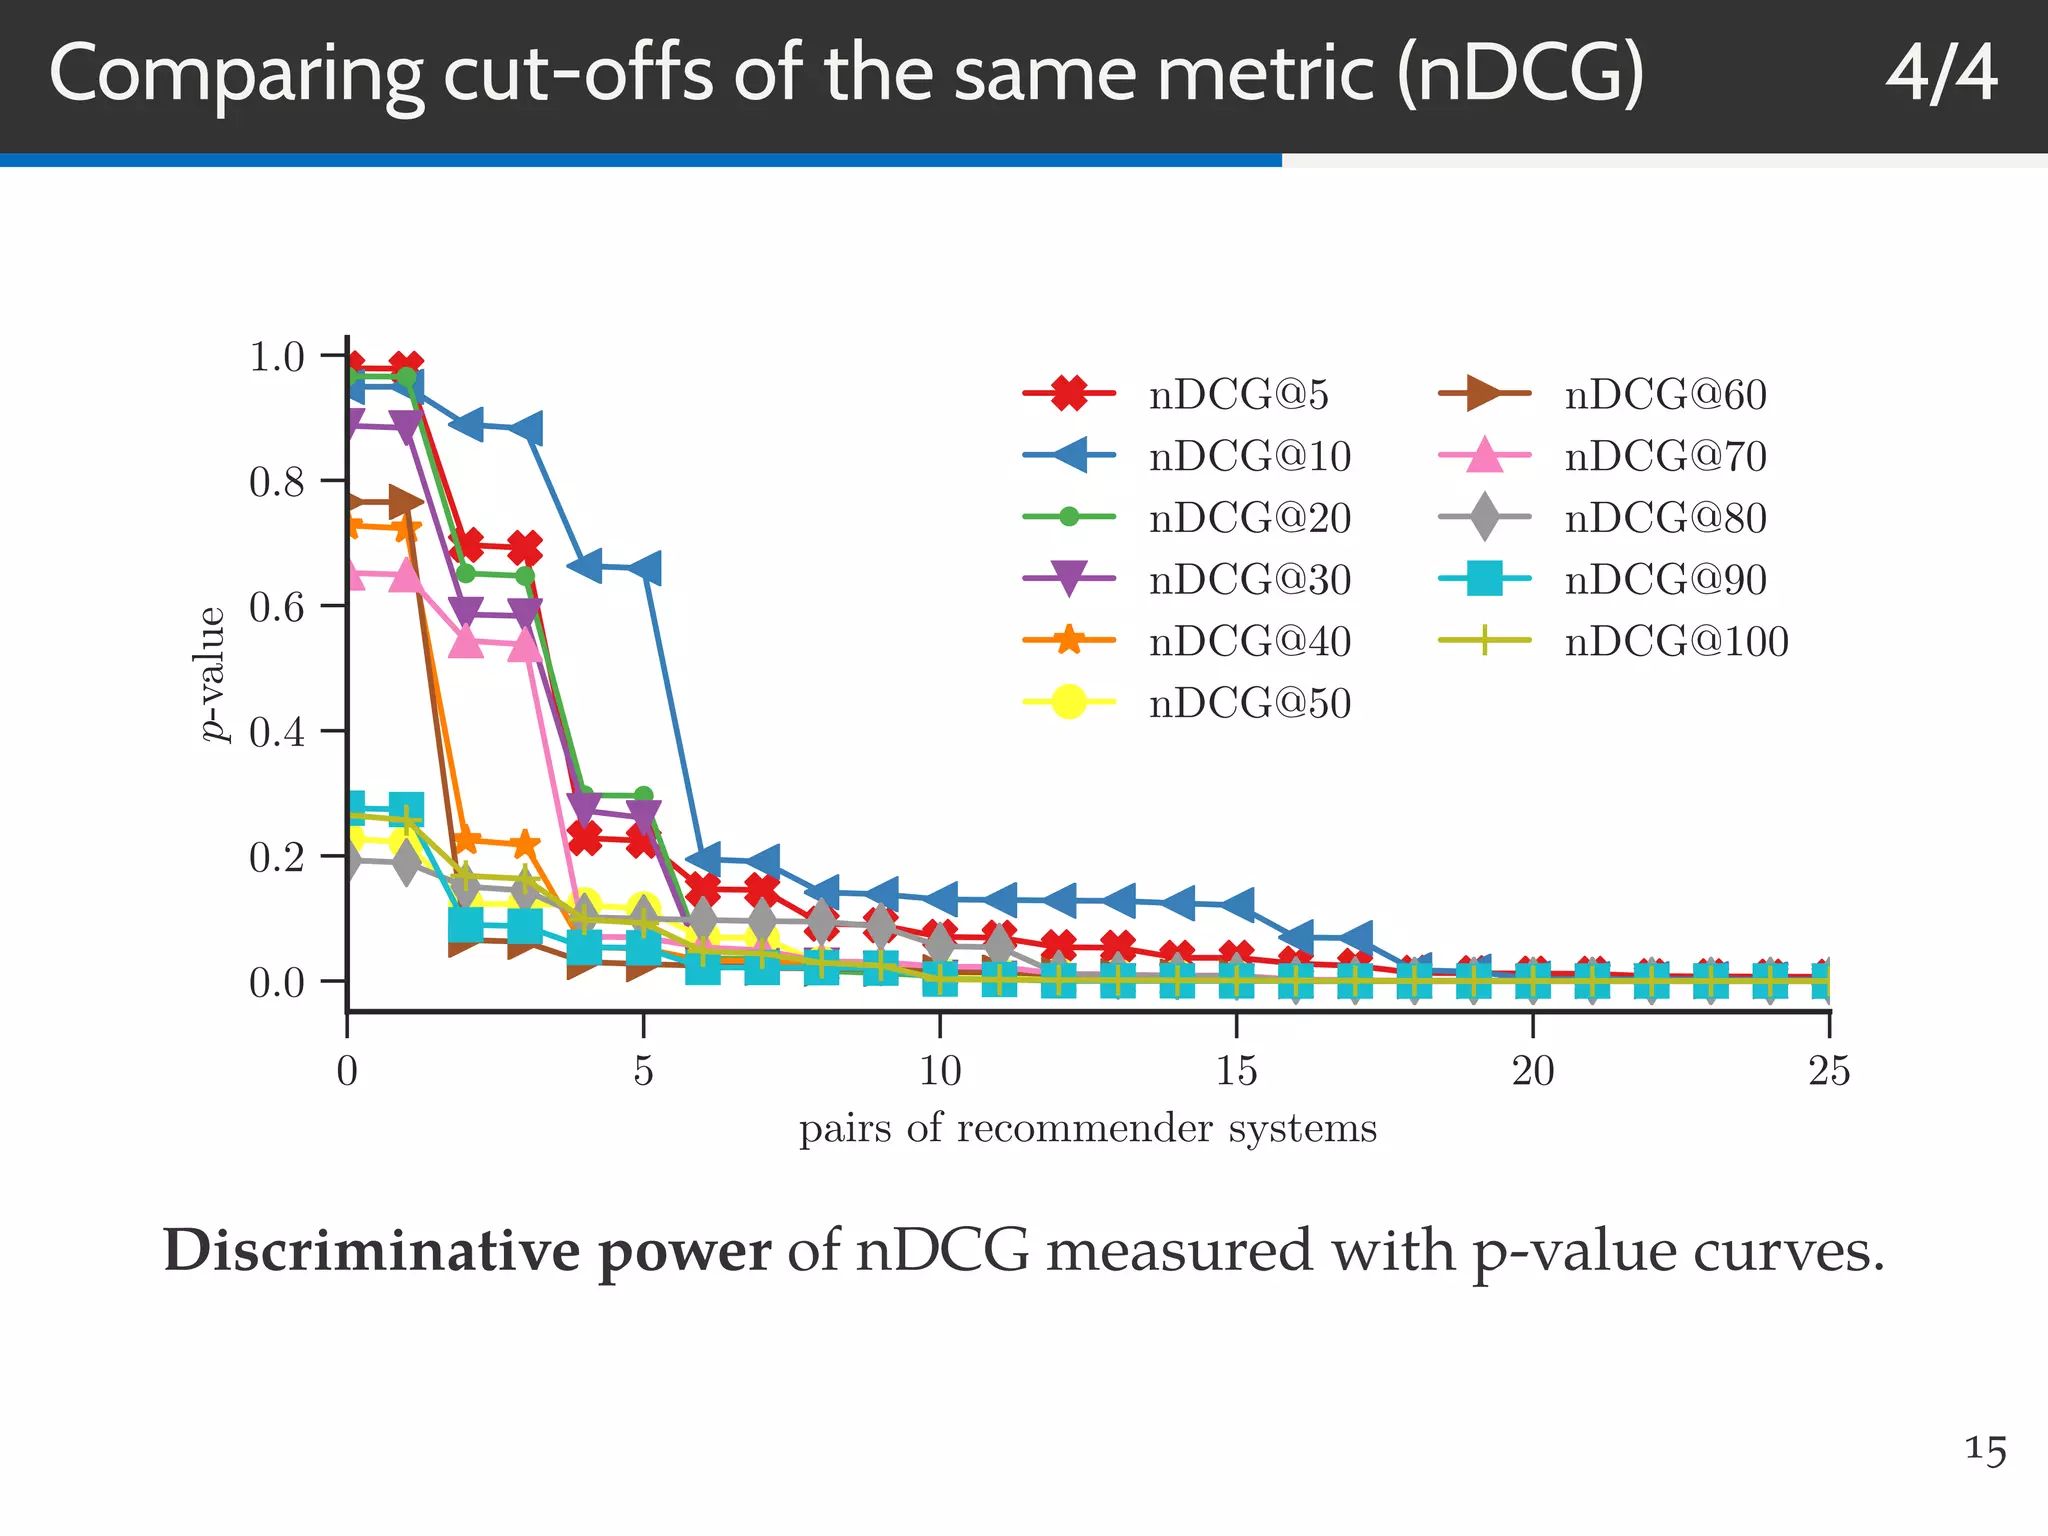
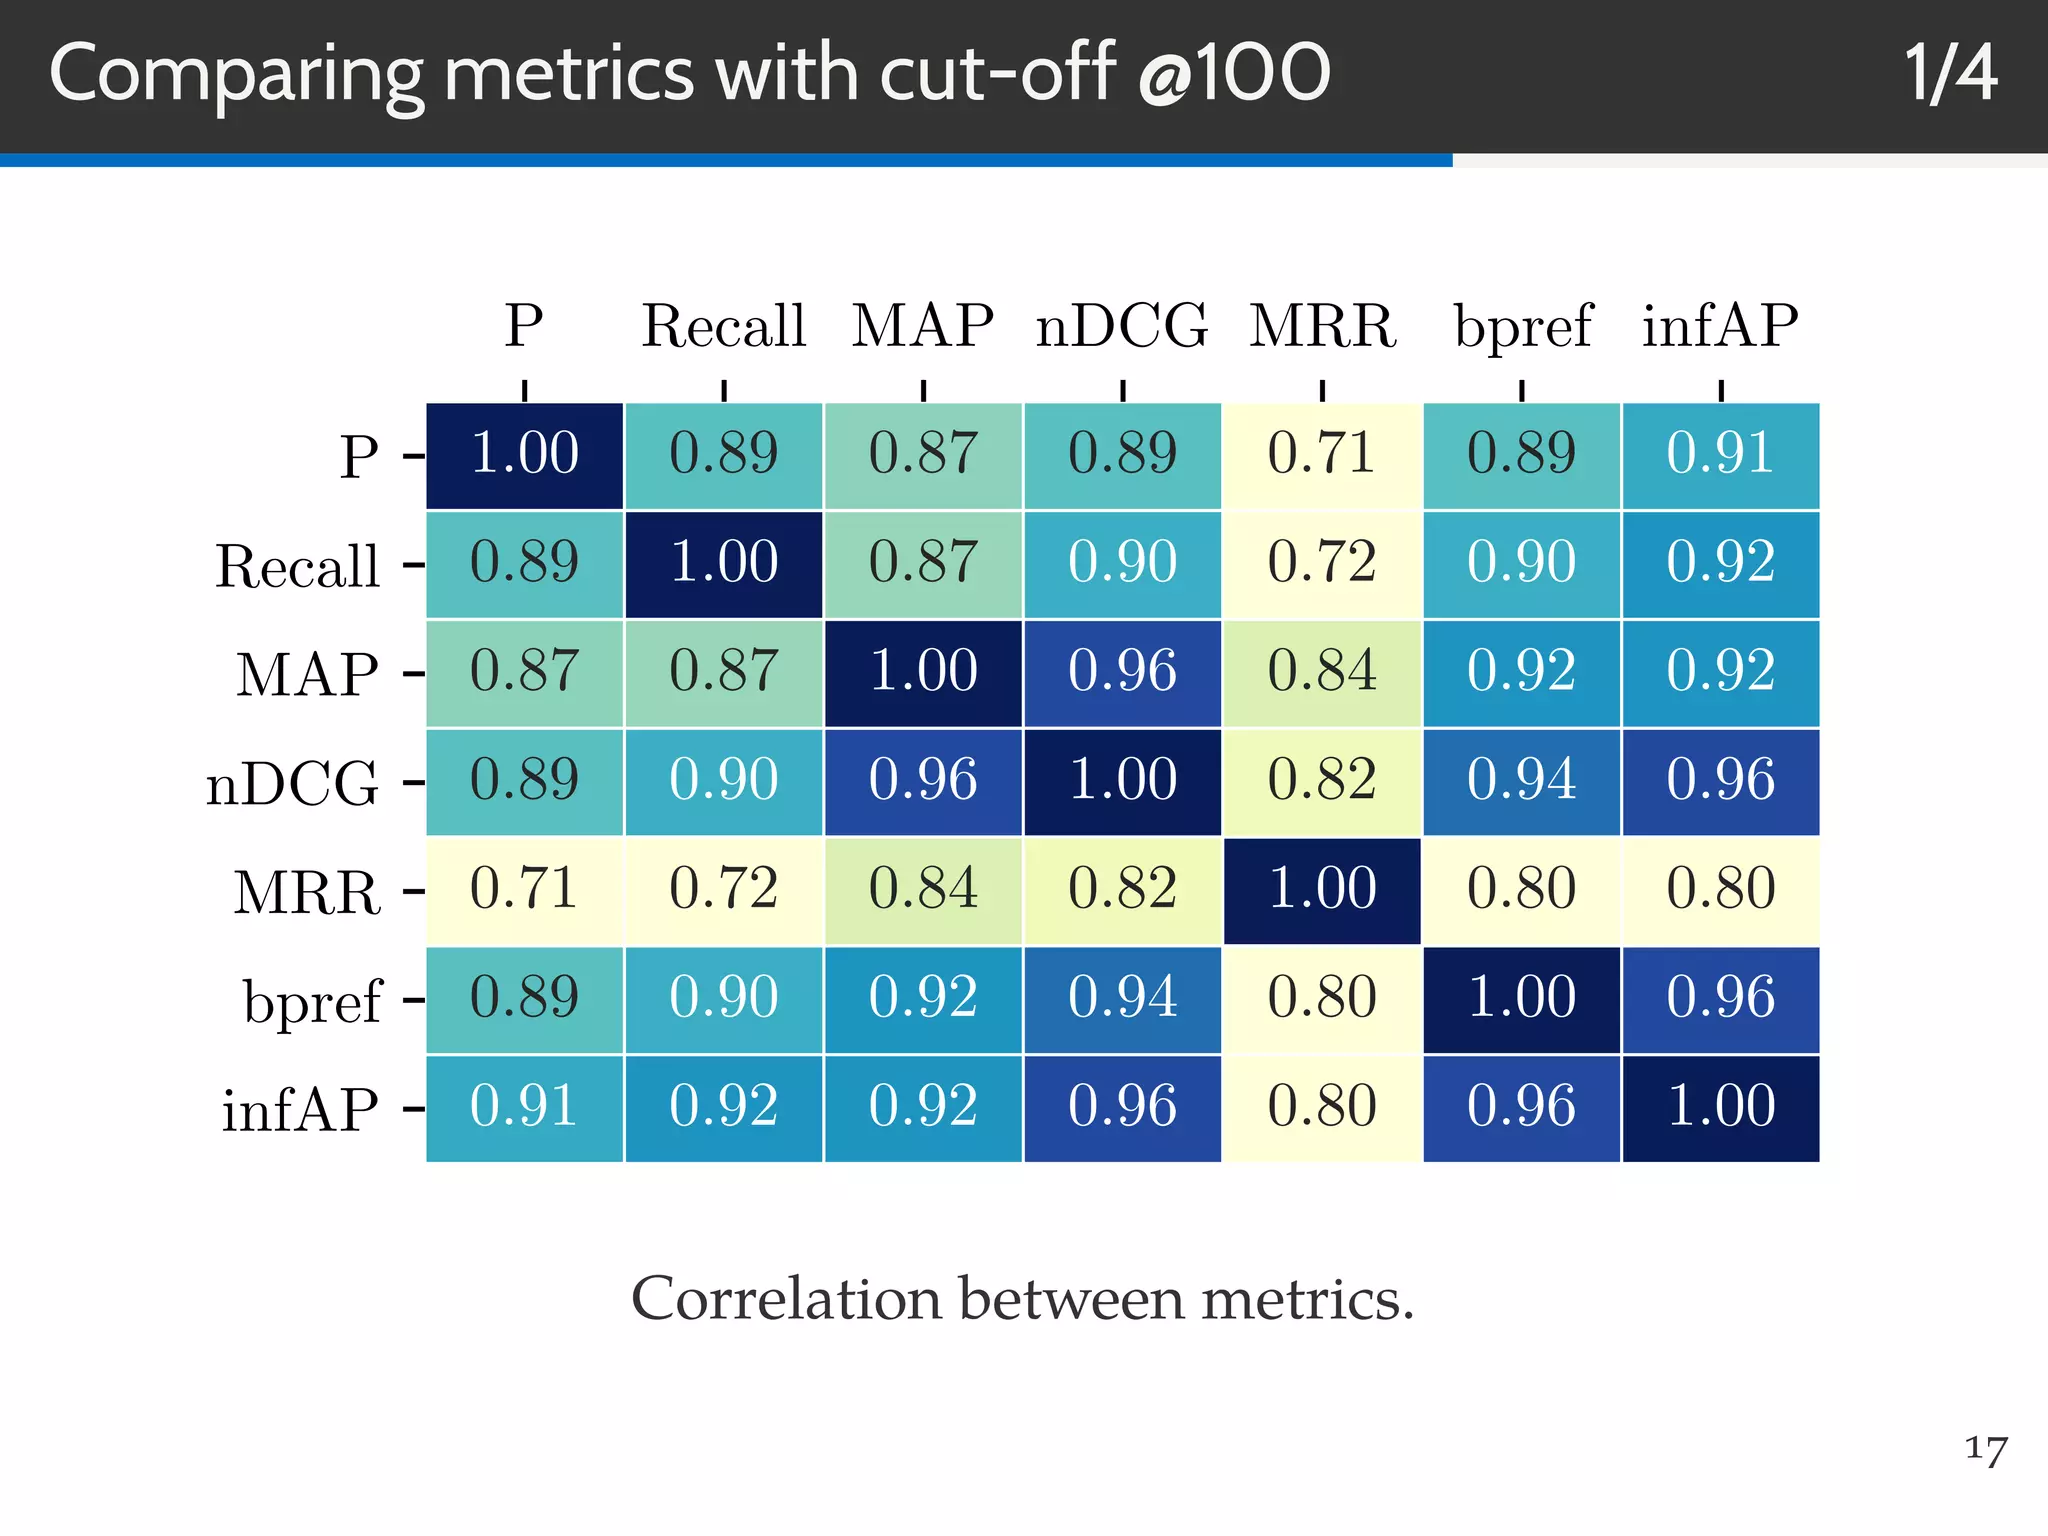
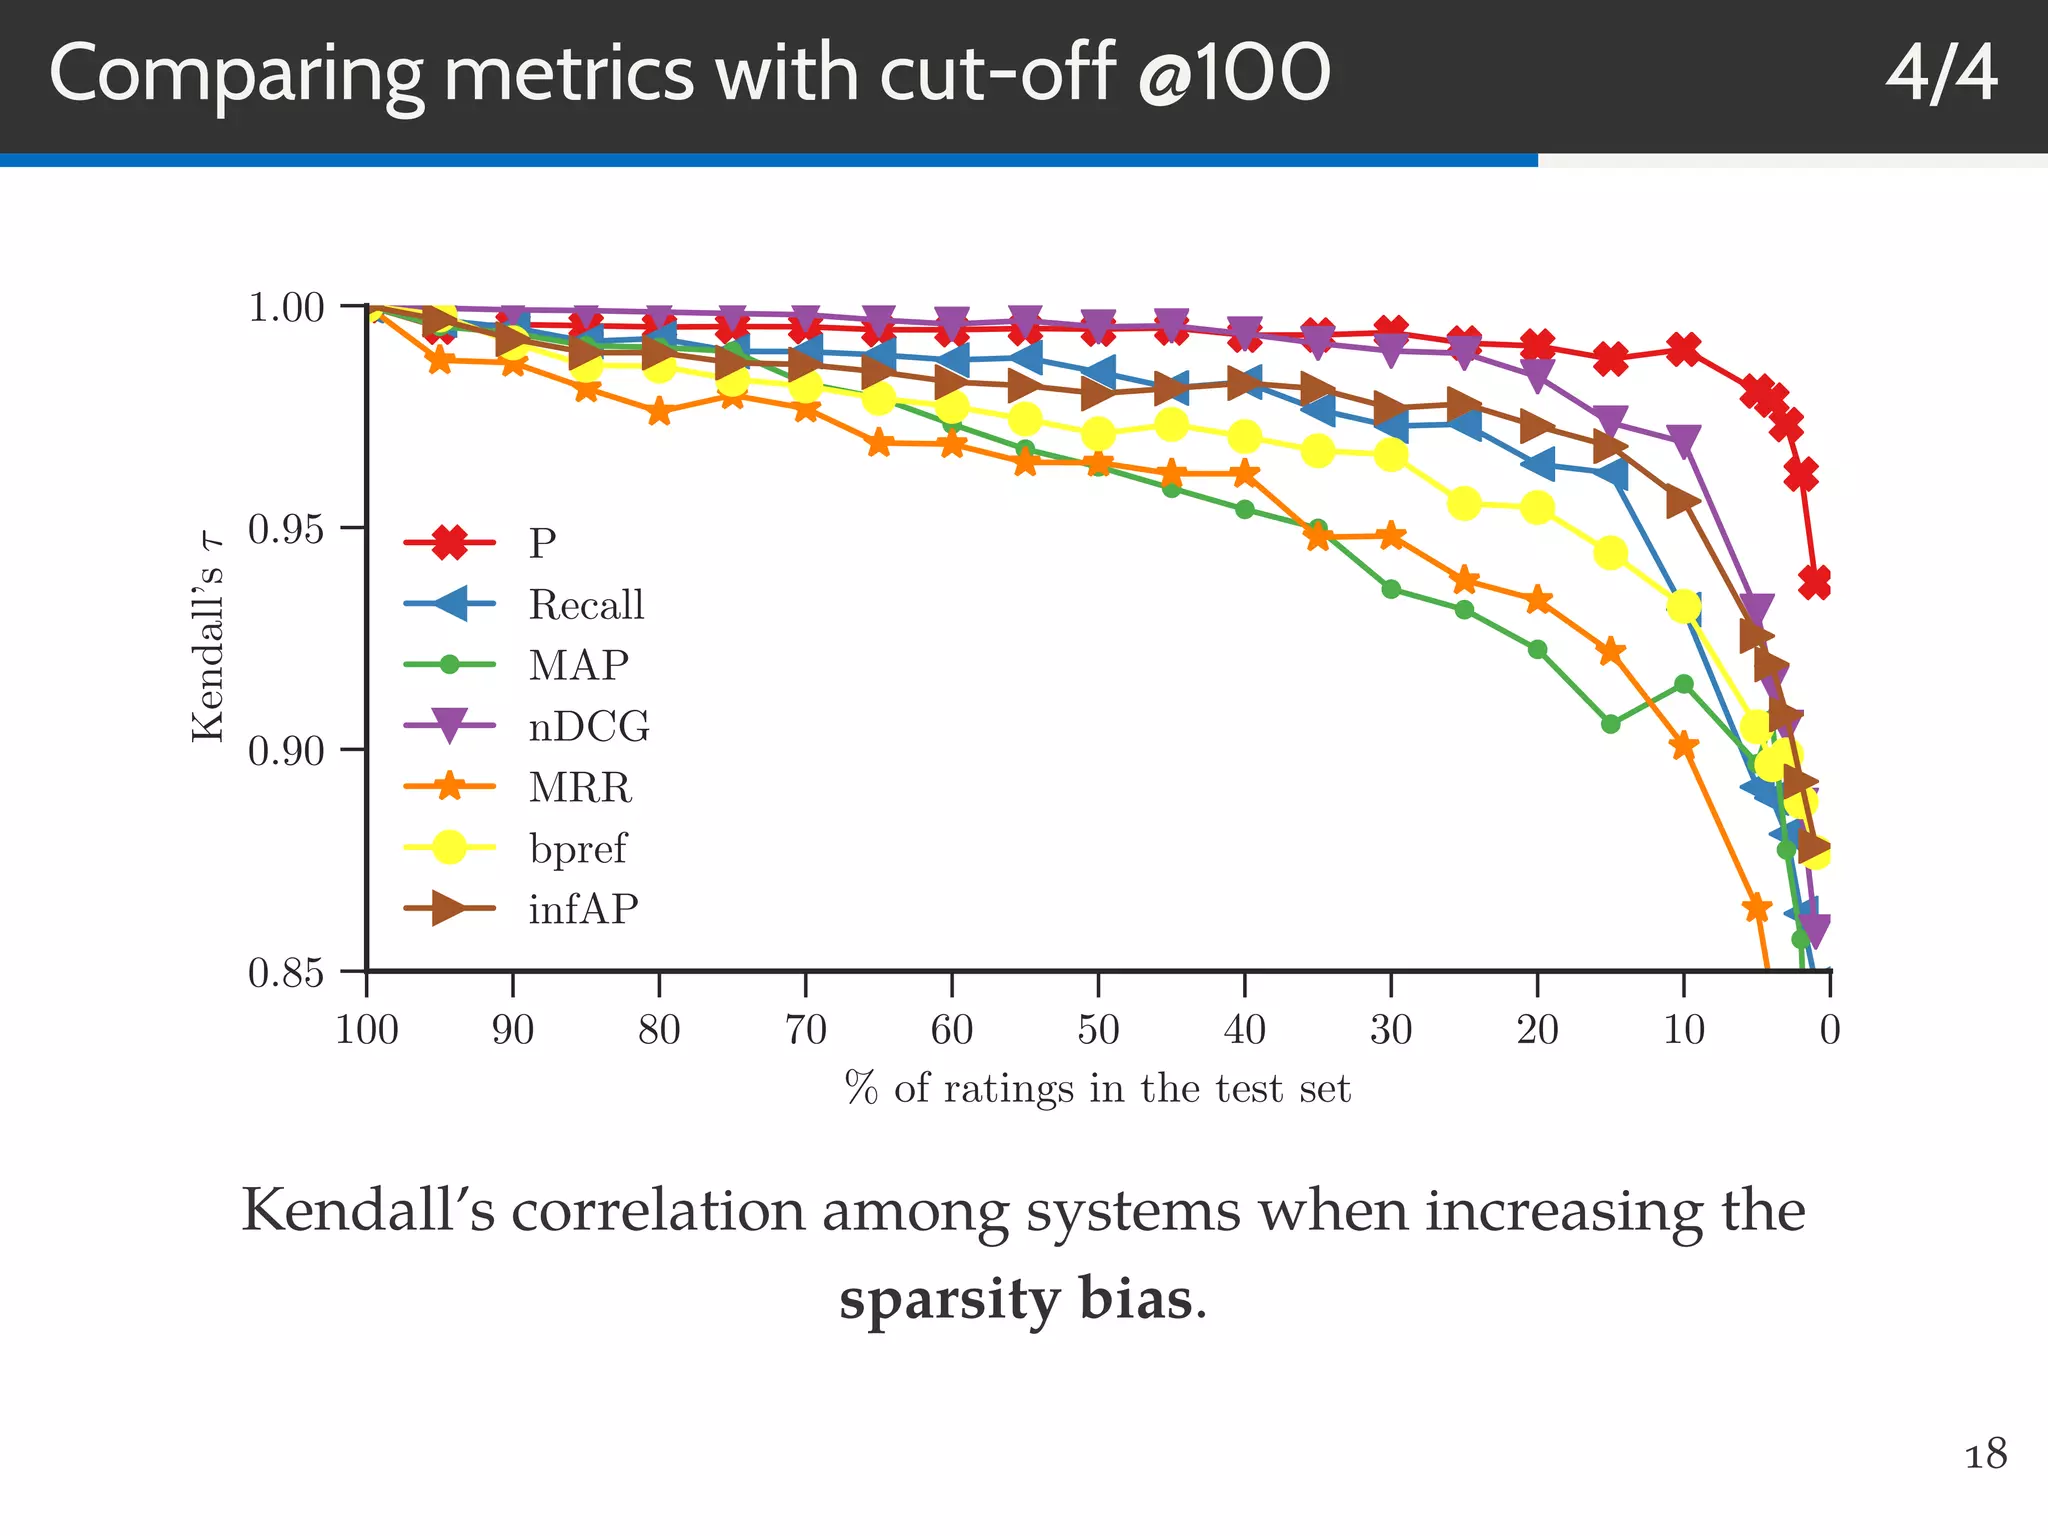
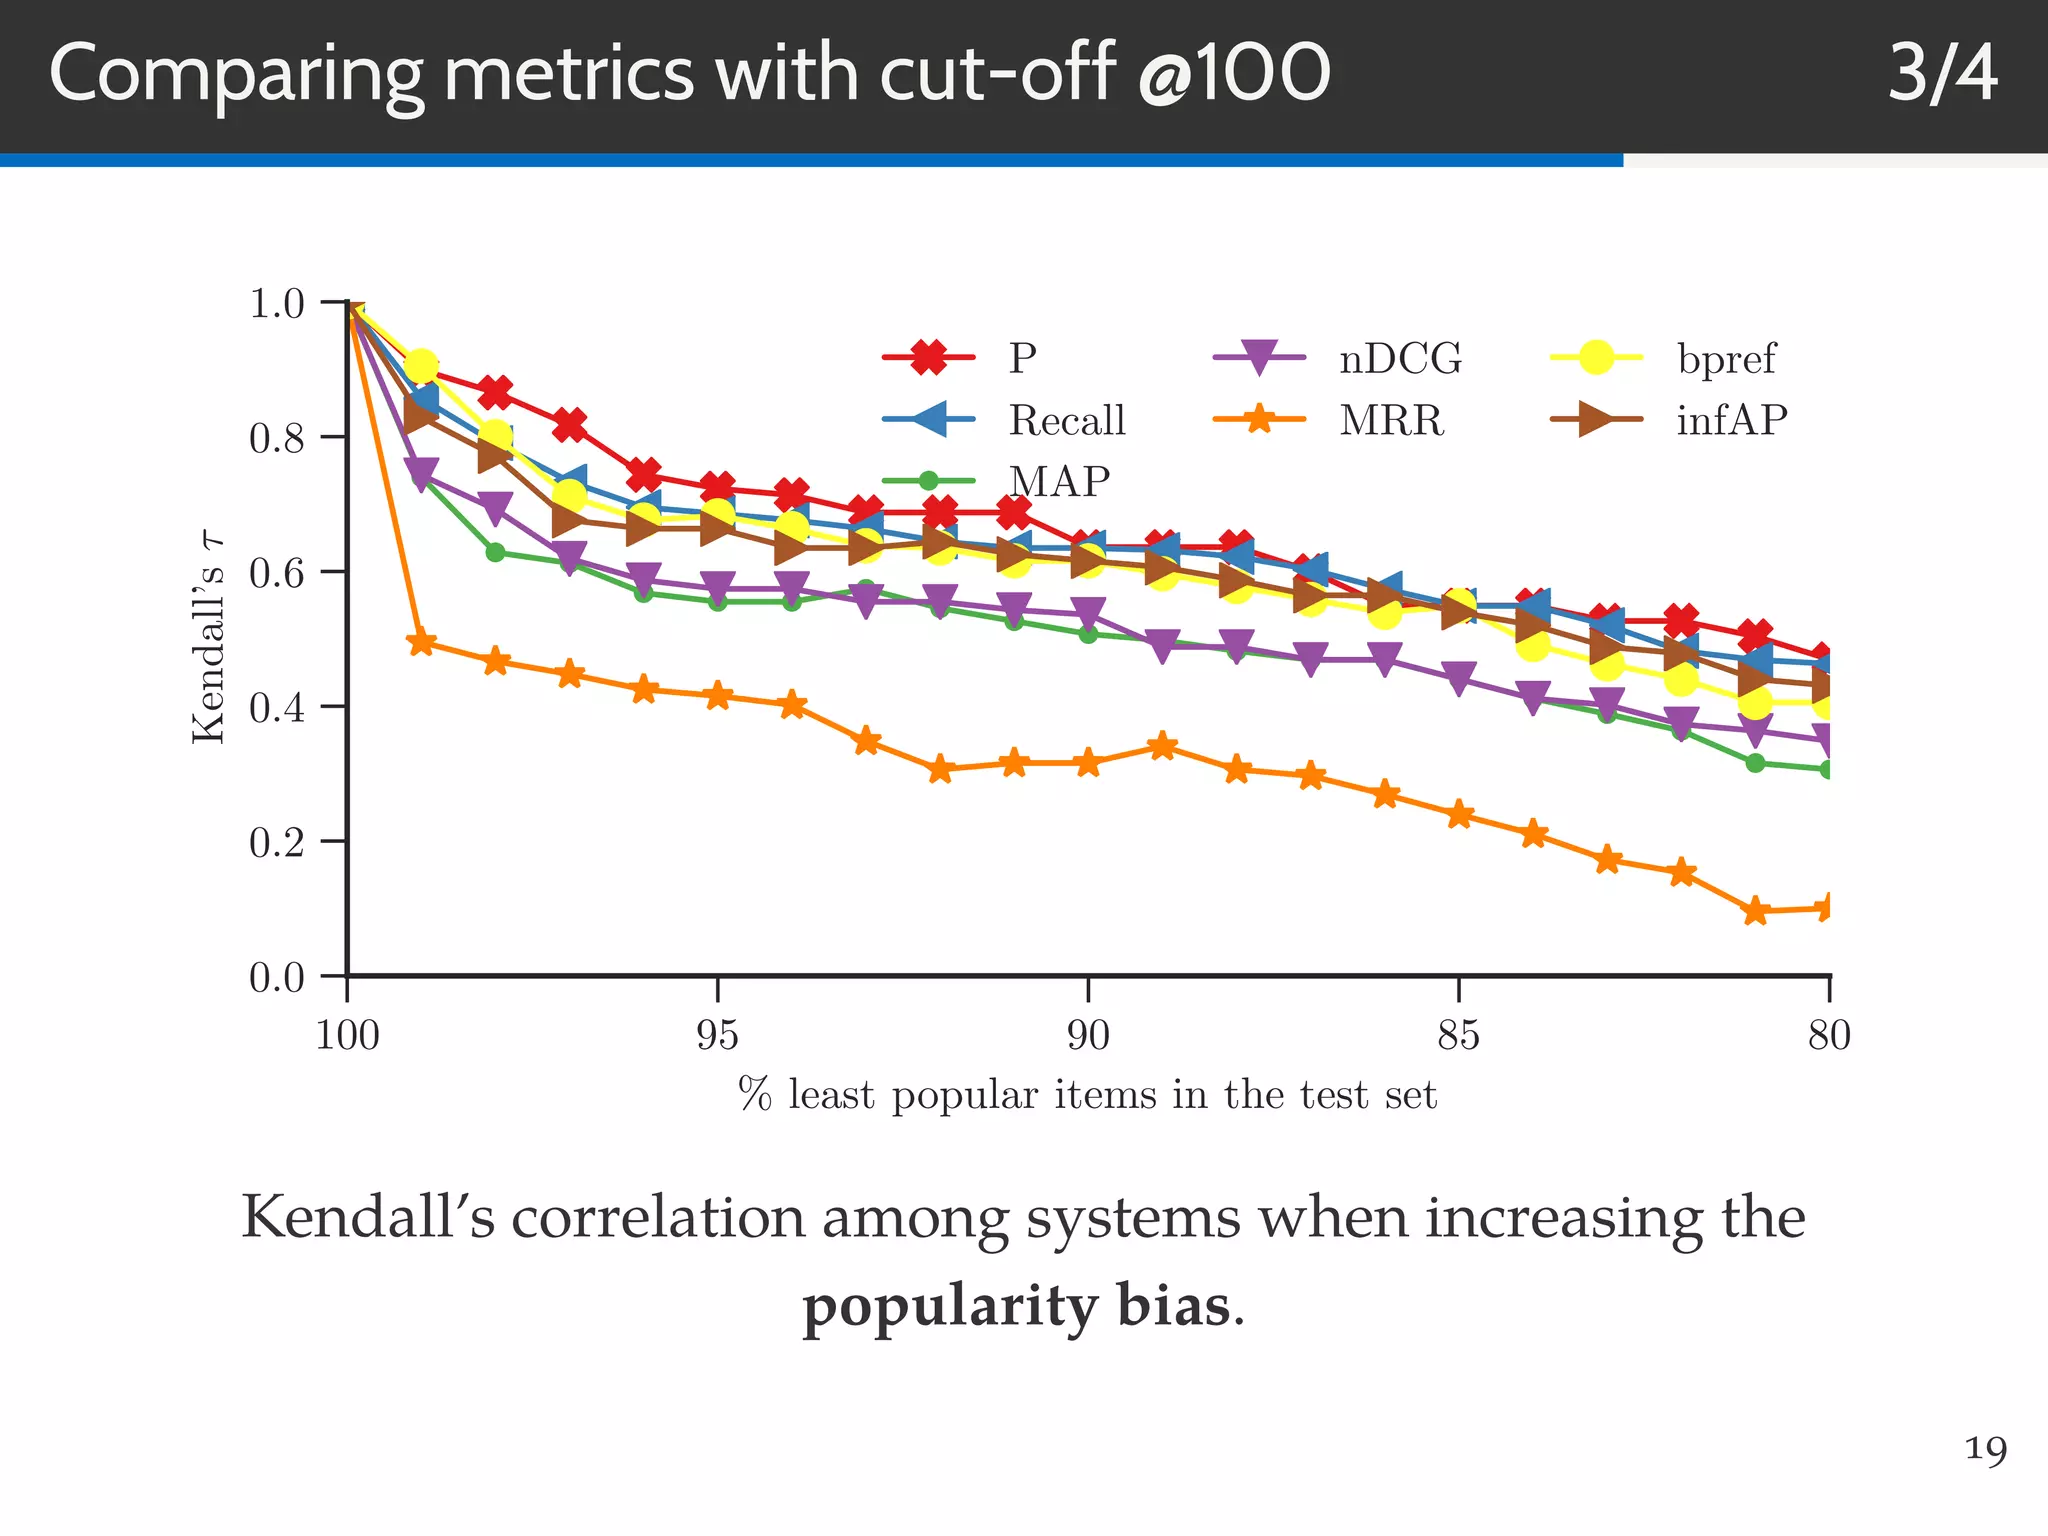
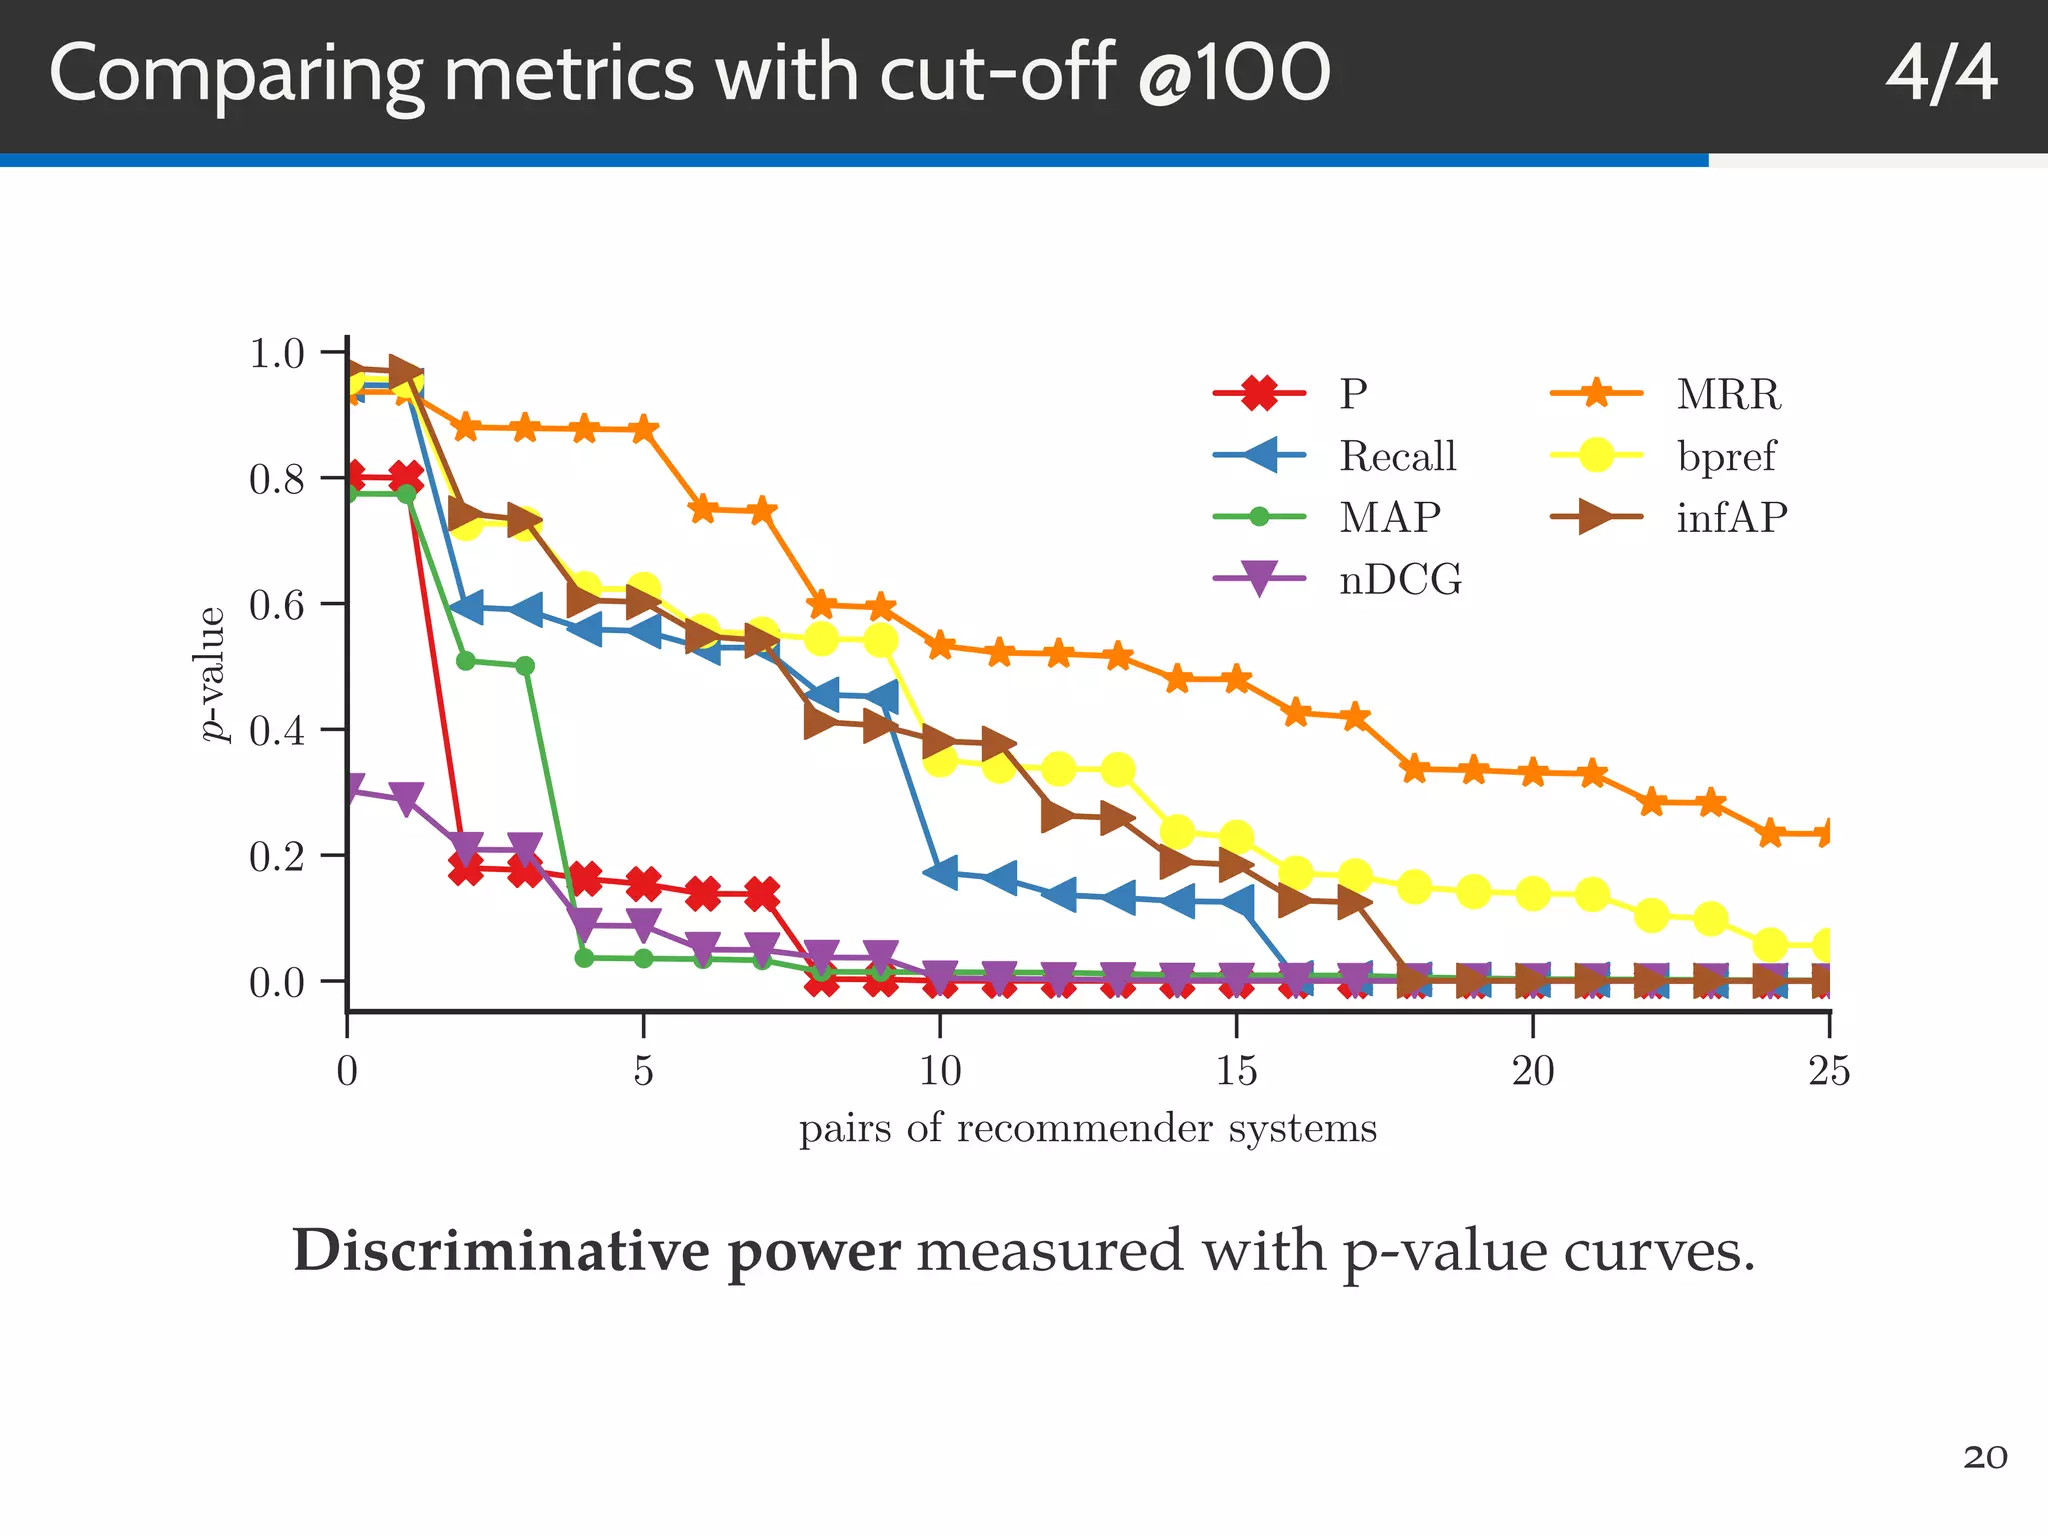
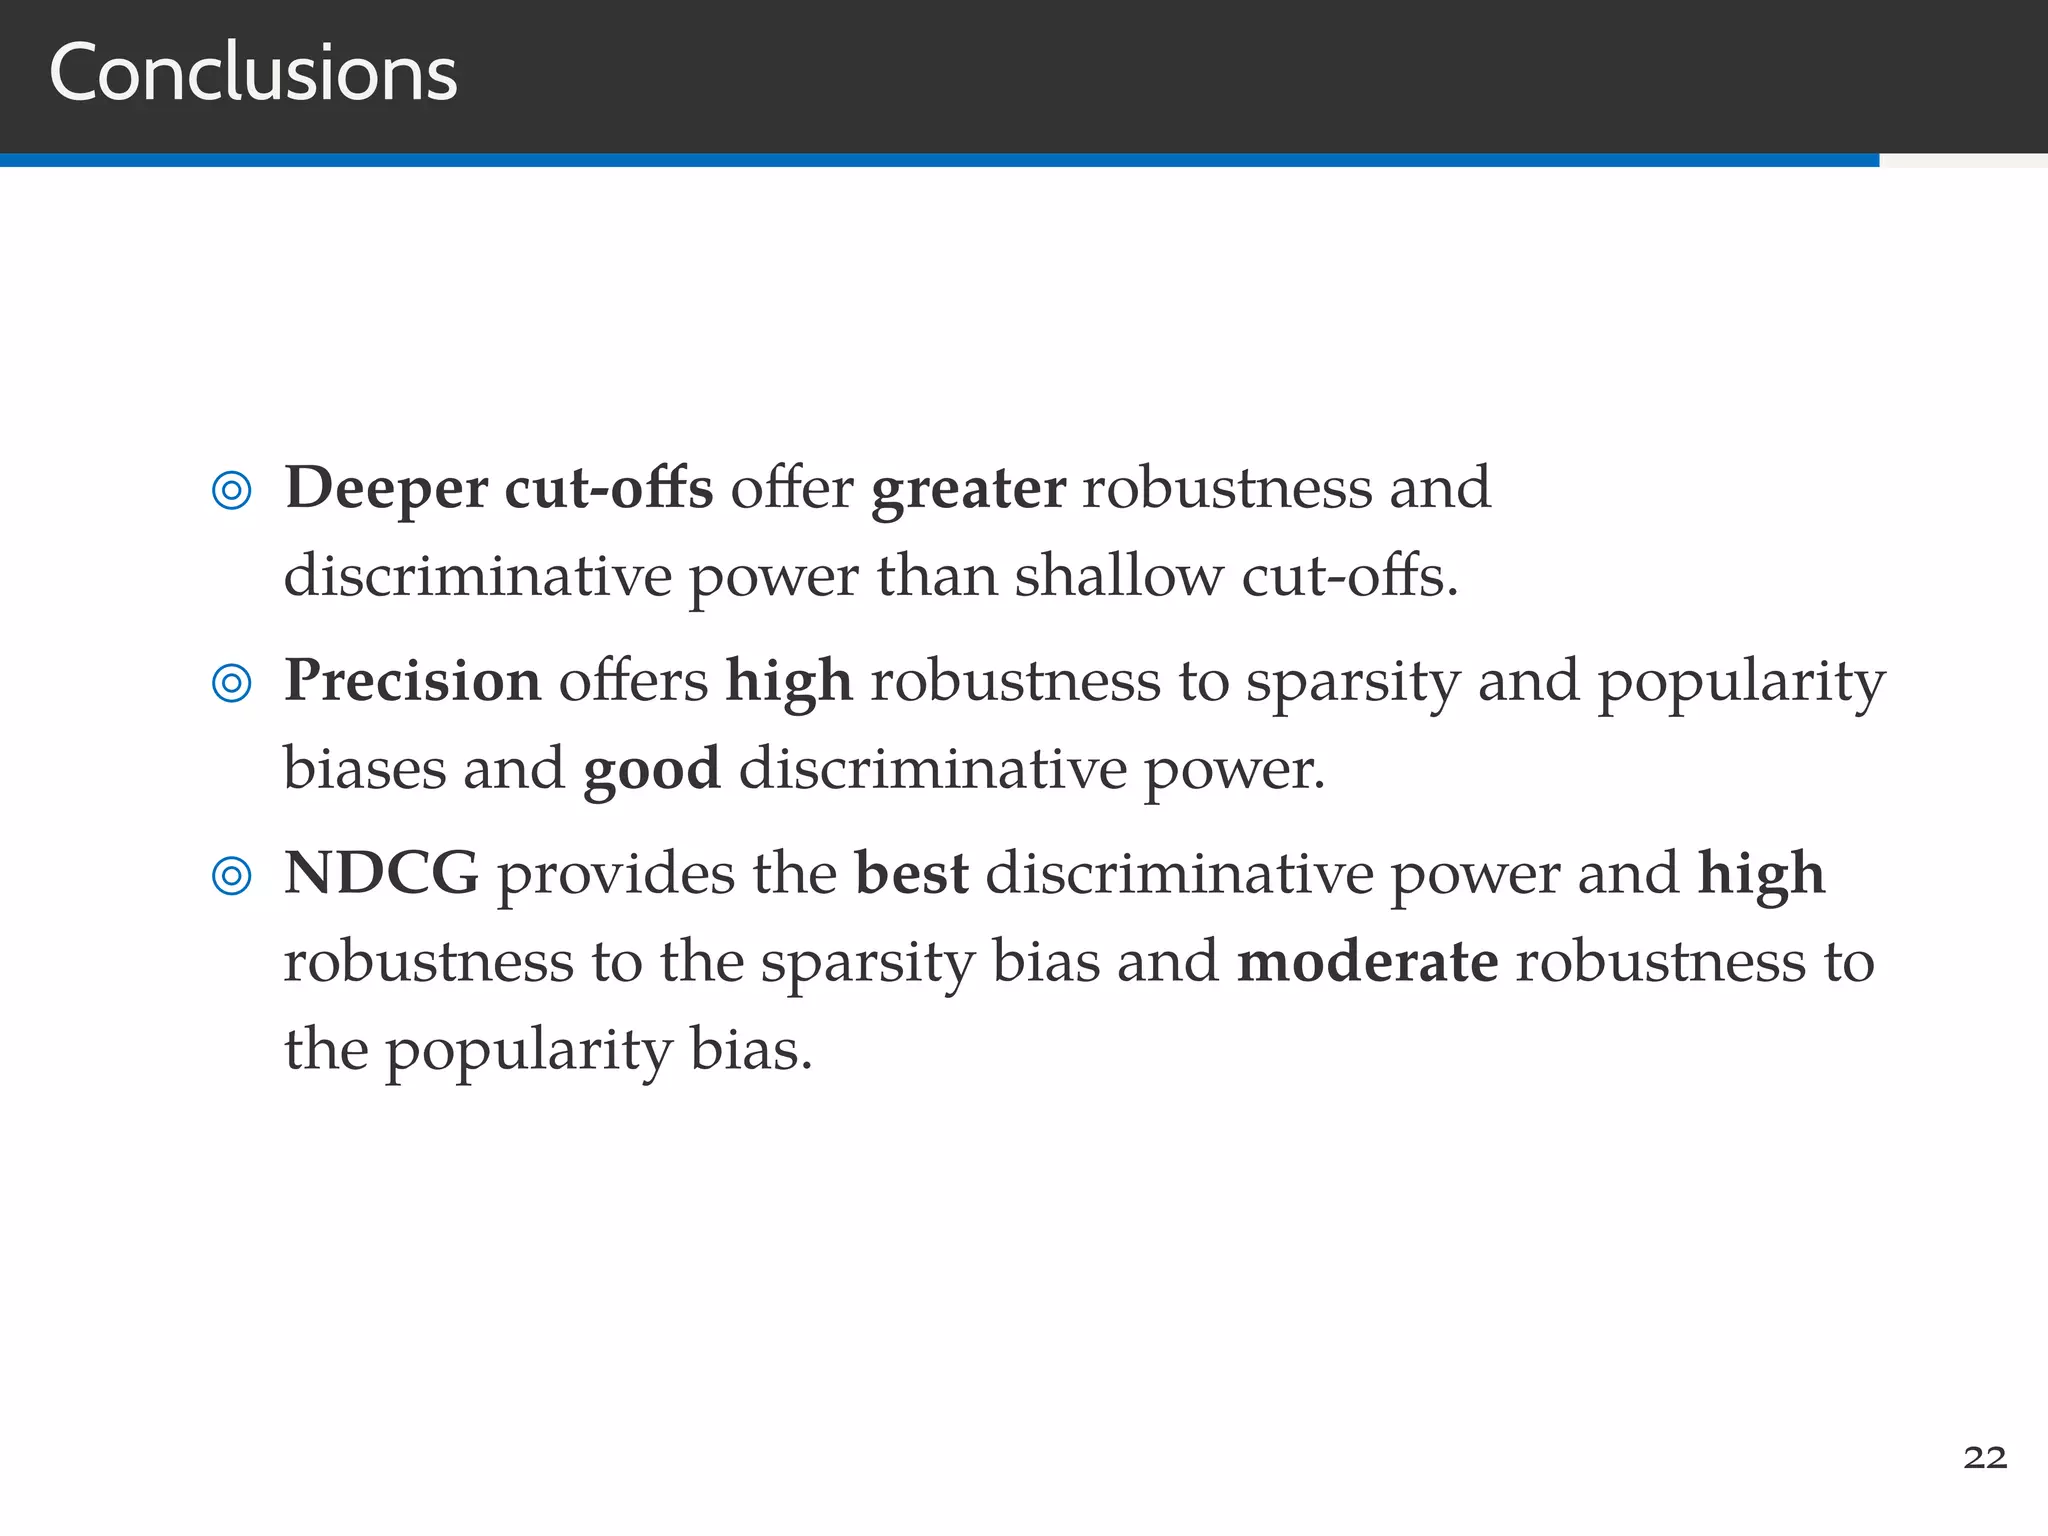
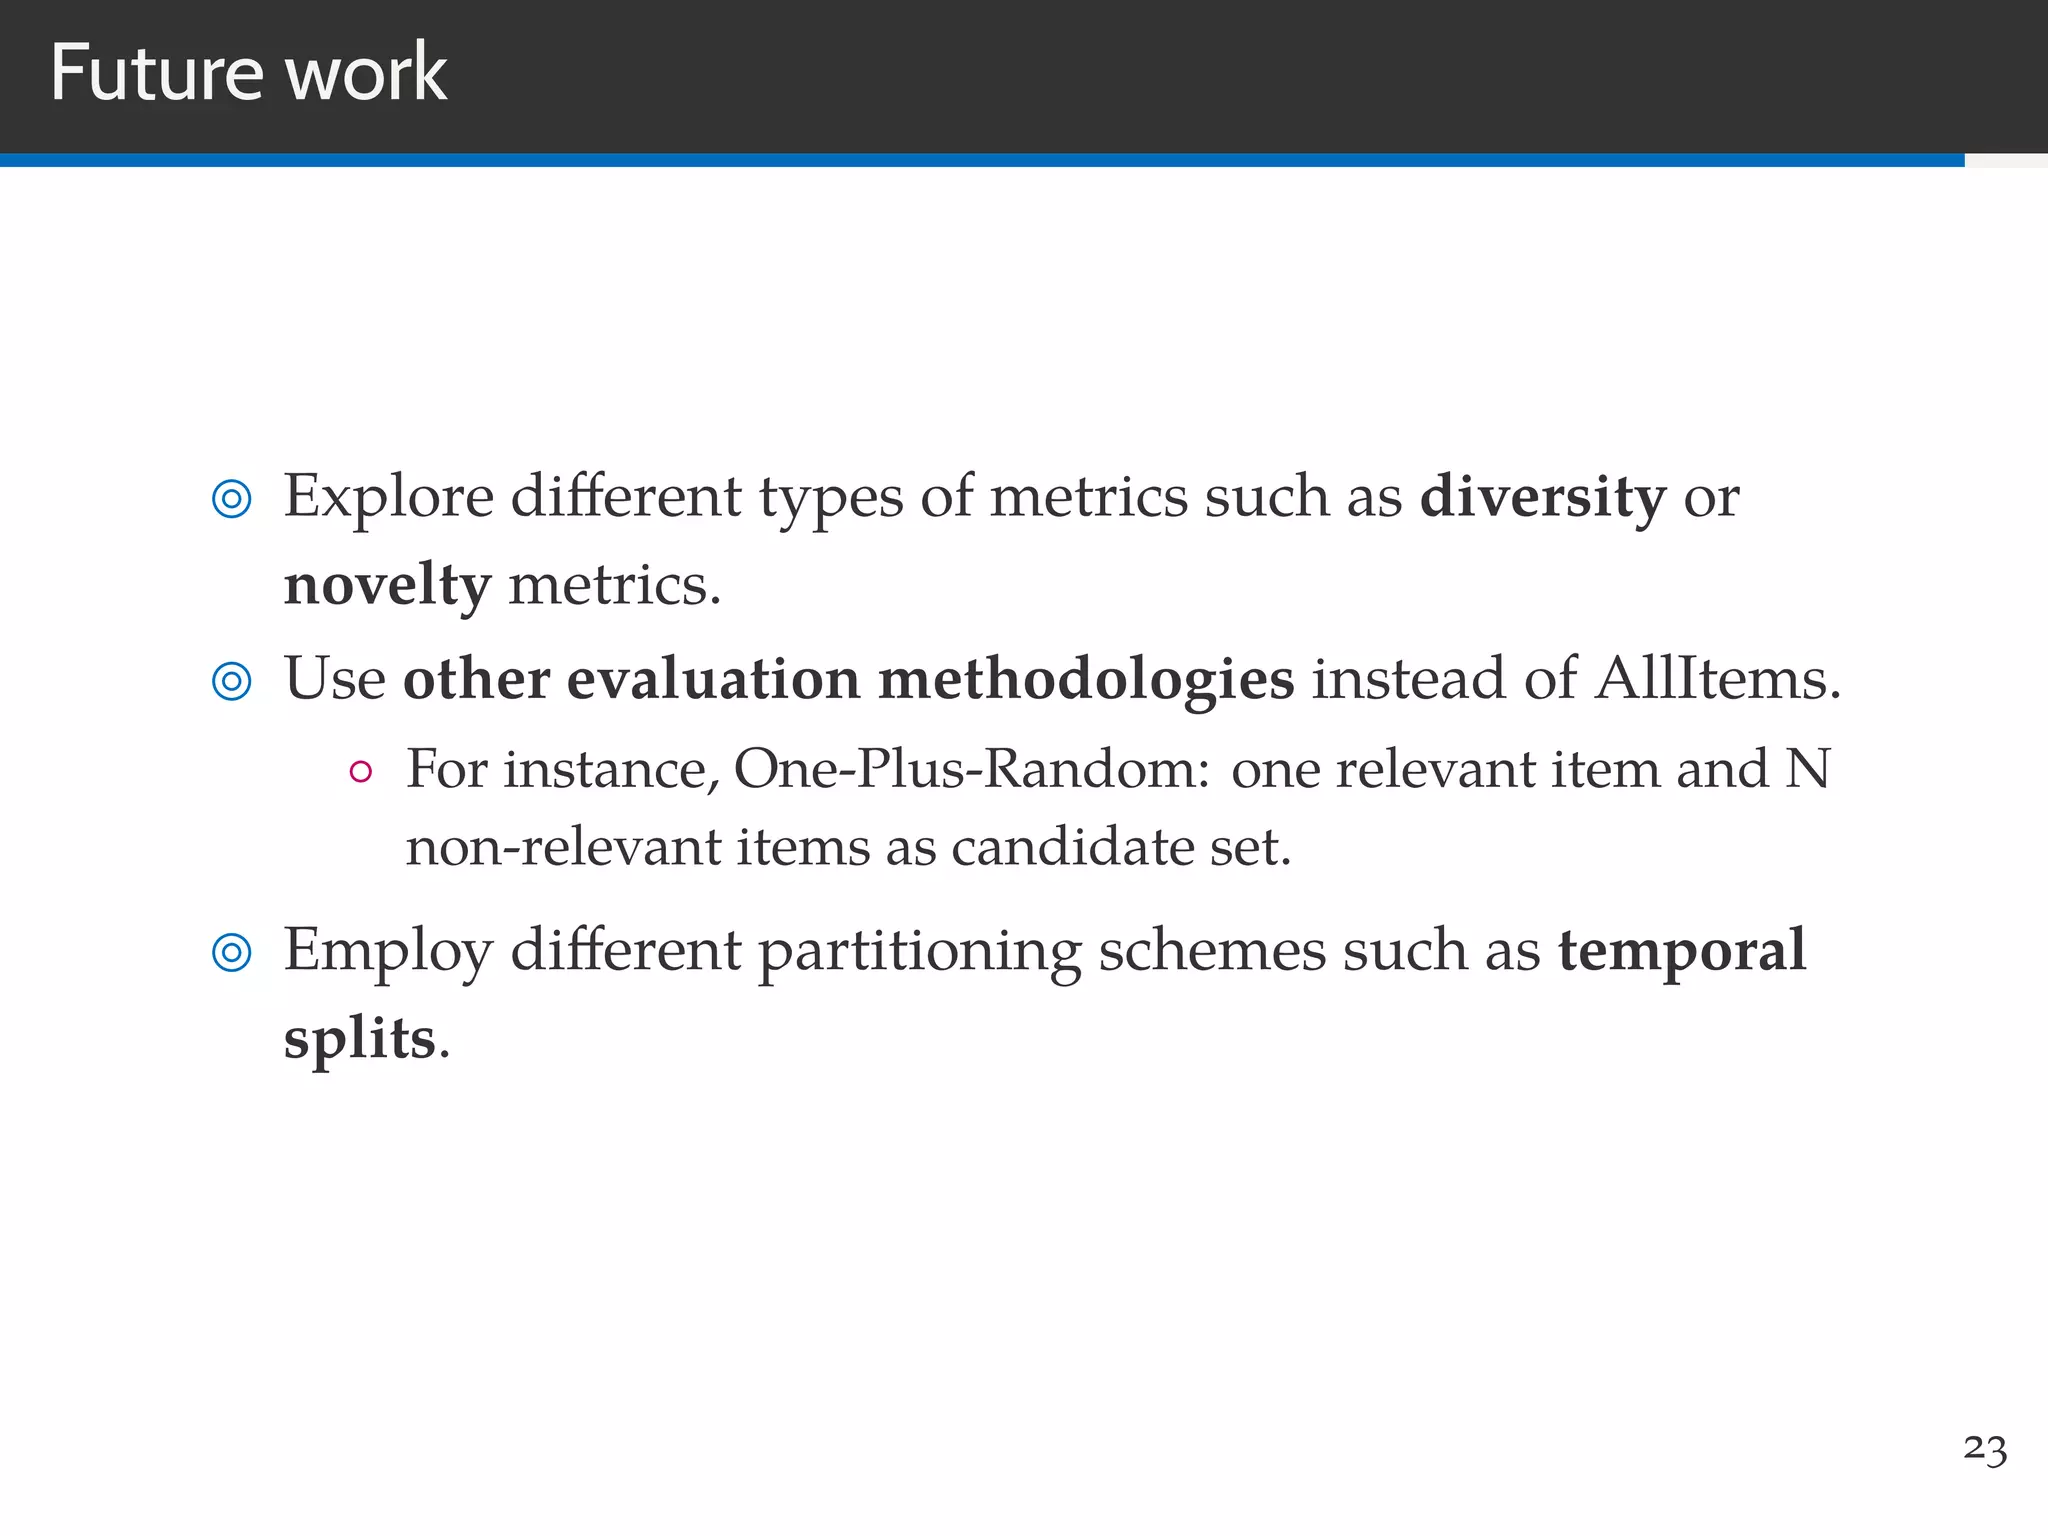
This document summarizes research on evaluating the robustness and discriminative power of information retrieval (IR) metrics for top-N recommendation. The researchers studied how various IR metrics like precision, recall, MAP, nDCG, MRR and bpref behave under different conditions like increased sparsity or popularity bias. They found that deeper cut-offs of metrics offer greater robustness and discriminative power than shallow cut-offs. Precision provided high robustness to biases and good discriminative power, while nDCG had the best discriminative power and robustness to sparsity bias. Future work could explore other metrics like diversity, use different evaluation methodologies, and employ temporal data splits.


![[DSC Europe 24] Dmitrii Matveev - RecSys.pptx](https://cdn.slidesharecdn.com/ss_thumbnails/dsceurope24dmitriimatveev-recsys-241209181706-598e49df-thumbnail.jpg?width=640&height=640&fit=bounds)


![Language Models for Collaborative Filtering Neighbourhoods [ECIR '16 Slides]](https://cdn.slidesharecdn.com/ss_thumbnails/slides-2016-lmforneigh-160411083912-thumbnail.jpg?width=640&height=640&fit=bounds)

![LiMe: Linear Methods for Pseudo-Relevance Feedback [SAC '18 Slides]](https://cdn.slidesharecdn.com/ss_thumbnails/limeslides-180411100357-thumbnail.jpg?width=640&height=640&fit=bounds)


![[DSC Europe 25] Boris Perkovic - Lost in performance.pptx](https://cdn.slidesharecdn.com/ss_thumbnails/uq5hrp7vsuahqkxzifux-1-251204082258-fd2ee09d-thumbnail.jpg?width=640&height=640&fit=bounds)


![[DSC Europe 25] Jim Sterne - Adopting Generative AI Capabilities Into the Ent...](https://cdn.slidesharecdn.com/ss_thumbnails/sxhpofuorcagxsaulkmt-3-251204082258-7e66bc48-thumbnail.jpg?width=640&height=640&fit=bounds)


![[DSC Europe 25] Dusan Jovicic - AI Story: From on-prem to cloud and back agai...](https://cdn.slidesharecdn.com/ss_thumbnails/8kp49m6uq22ifnbwhfnk-2-251205085715-964d11a6-thumbnail.jpg?width=640&height=640&fit=bounds)
![[DSC Europe 25] Dragana Ilic - AI for Big Data in Astronomy.pptx](https://cdn.slidesharecdn.com/ss_thumbnails/8palya86qaatvjhva1ms-2-dragana-ilic-ai-ilic-251208151906-652b819c-thumbnail.jpg?width=640&height=640&fit=bounds)


![[DSC Europe 25] Andy Cotgreave - Nothing is new in analytics.pptx](https://cdn.slidesharecdn.com/ss_thumbnails/mba4vzcurvoh5lfrd5zw-6-251205194645-341bbbbe-thumbnail.jpg?width=640&height=640&fit=bounds)

![[DSC Europe 25] Max Talanov - Non digital NNs.pptx](https://cdn.slidesharecdn.com/ss_thumbnails/wif8tr3gtua74qvtopke-non-digital-nns-251205090438-26b0eea6-thumbnail.jpg?width=640&height=640&fit=bounds)


![[DSC Europe 25] Bogdan Daniel Maruneac - AI - It starts with you.pptx](https://cdn.slidesharecdn.com/ss_thumbnails/odov3snhrcqs9hx5ny2n-4-251205085715-f1daacfe-thumbnail.jpg?width=640&height=640&fit=bounds)
![[DSC Europe 25] Dragan Vucic - Building the Learning Organization - How AI Tr...](https://cdn.slidesharecdn.com/ss_thumbnails/8brigo2sbu6qur6gxrra-7-251205085715-6ae07d24-thumbnail.jpg?width=640&height=640&fit=bounds)
