Course Administration
Grading
• In-classparticipation, 15%;
• Assignments, 36%, three assignments;
• Final project, 34%;
• Student presentations will be worth 15% of the project.
Attendance
• As by syllabus.
2/30
4.
Course Administration
Assignments
• Assignment1, after lecture 2
• Assignment 2, after lecture 4
• Assignment 3, after lecture 6
Final Project
• Final Report, to be delivered: the day prior to the final presentation, 23h59
• Slides Presentation, to be delivered: the day prior to the final presentation,
23h59
• Final Project Presentation: During the last lecture, 05:00 PM
3/30
What will youlearn?
• To use the R/RStudio environment in order to apply Text Mining and
Analysis;
• Autonomously gather text information from various sources;
• Discover latent aspects/dimensions in the text through various techniques;
• Label the discovered aspects/dimensions;
• Have a good insight on big volumes of text;
• Blend Text Mining and Marketing;
• Draw conclusions based on the results obtained.
• I hope many more…
4/30
7.
Language skills
Homo sapiensis a species that reads and writes.
Reading is the third of the 4 language skills:
• listening;
• speaking;
• reading;
• writing;
(strongly correlated)
5/30
8.
Why do weneed to analyze online text?
• The user generated content on Social Media platforms produces an
impressive quantity of information overload;
• This induces the need for summarization, discovery of latent dimensions in
the text, understand the sentiment of the text and induces the necessity to
draw conclusions;
• We read on paper and digital screen;
• Huge amounts of text.. it could be too much.
6/30
9.
Objective in thislecture and next one
We must manipulate text with the help of R (or other programming languages) to:
• Understand what data, vectors, text strings and characters are;
• Import a text dataset and display strings.
• Obtain information regarding the strings in a dataset.
• Understand what regular expressions are and how they can be useful.
• Use regexp quantifiers, boundaries, common operators, character classes
and sequences.
7/30
10.
Considerations
It is rarethat the (marketing) analyst deals with perfectly well-crafted texts, unless they go several
revisions or are written by professionals. Since the primary focus in this book is on analyzing
User-Generated Content (UGC) such as online products or service reviews, blog entries or social
media posts, we cannot expect any of these texts from being free of linguistic errors, typos and/or
misspellings.
Thus, we often encounter situations when we need to search for, select and partly modify or
transform words, numbers or whole phrases. This last operation can be called text manipulation and
requires specific skills. The main reason to alter text is that we need to create documents that are
free of errors, uniform and ready to be analysed.
Why?
Because we are mentally able to correct a misspelled term but computers do not make distinction
between a wrongly and a correctly written word: those are just plainly two different words for them.
This is important because we need to link the words to numbers in order to draw conclusions and if
the text was not polished then the statistics would be flawed.
8/30
11.
Some basics
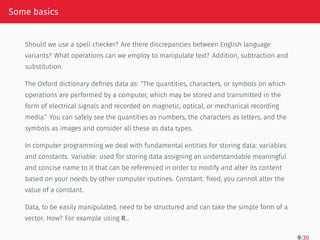
Should weuse a spell checker? Are there discrepancies between English language
variants? What operations can we employ to manipulate text? Addition, subtraction and
substitution.
The Oxford dictionary defines data as: “The quantities, characters, or symbols on which
operations are performed by a computer, which may be stored and transmitted in the
form of electrical signals and recorded on magnetic, optical, or mechanical recording
media.” You can safely see the quantities as numbers, the characters as letters, and the
symbols as images and consider all these as data types.
In computer programming we deal with fundamental entities for storing data: variables
and constants. Variable: used for storing data assigning an understandable meaningful
and concise name to it that can be referenced in order to modify and alter its content
based on your needs by other computer routines. Constant: fixed, you cannot alter the
value of a constant.
Data, to be easily manipulated, need to be structured and can take the simple form of a
vector. How? For example using R…
9/30
What is R?
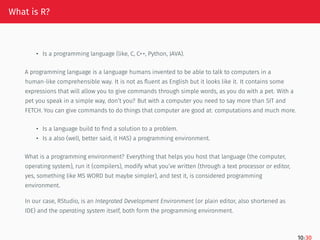
•Is a programming language (like, C, C++, Python, JAVA).
A programming language is a language humans invented to be able to talk to computers in a
human-like comprehensible way. It is not as fluent as English but it looks like it. It contains some
expressions that will allow you to give commands through simple words, as you do with a pet. With a
pet you speak in a simple way, don’t you? But with a computer you need to say more than SIT and
FETCH. You can give commands to do things that computer are good at: computations and much more.
• Is a language build to find a solution to a problem.
• Is a also (well, better said, it HAS) a programming environment.
What is a programming environment? Everything that helps you host that language (the computer,
operating system), run it (compilers), modify what you’ve written (through a text processor or editor,
yes, something like MS WORD but maybe simpler), and test it, is considered programming
environment.
In our case, RStudio, is an Integrated Development Environment (or plain editor, also shortened as
IDE) and the operating system itself, both form the programming environment.
10/30
14.
More about R
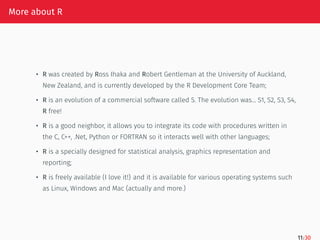
•R was created by Ross Ihaka and Robert Gentleman at the University of Auckland,
New Zealand, and is currently developed by the R Development Core Team;
• R is an evolution of a commercial software called S. The evolution was… S1, S2, S3, S4,
R free!
• R is a good neighbor, it allows you to integrate its code with procedures written in
the C, C++, .Net, Python or FORTRAN so it interacts well with other languages;
• R is a specially designed for statistical analysis, graphics representation and
reporting;
• R is freely available (I love it!) and it is available for various operating systems such
as Linux, Windows and Mac (actually and more.)
11/30
15.
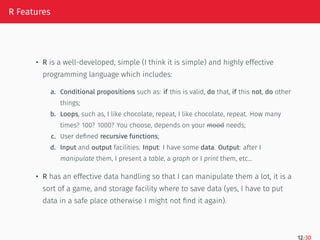
R Features
• Ris a well-developed, simple (I think it is simple) and highly effective
programming language which includes:
a. Conditional propositions such as: if this is valid, do that, if this not, do other
things;
b. Loops, such as, I like chocolate, repeat, I like chocolate, repeat. How many
times? 100? 1000? You choose, depends on your mood needs;
c. User defined recursive functions;
d. Input and output facilities. Input: I have some data. Output: after I
manipulate them, I present a table, a graph or I print them, etc…
• R has an effective data handling so that I can manipulate them a lot, it is a
sort of a game, and storage facility where to save data (yes, I have to put
data in a safe place otherwise I might not find it again).
12/30
16.
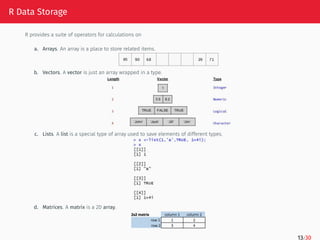
R Data Storage
Rprovides a suite of operators for calculations on
a. Arrays. An array is a place to store related items.
b. Vectors. A vector is just an array wrapped in a type.
c. Lists. A list is a special type of array used to save elements of different types.
d. Matrices. A matrix is a 2D array.
13/30
17.
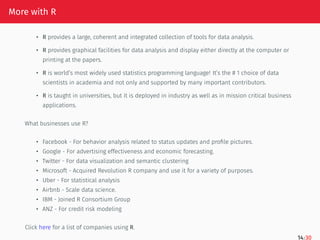
More with R
•R provides a large, coherent and integrated collection of tools for data analysis.
• R provides graphical facilities for data analysis and display either directly at the computer or
printing at the papers.
• R is world’s most widely used statistics programming language! It’s the # 1 choice of data
scientists in academia and not only and supported by many important contributors.
• R is taught in universities, but it is deployed in industry as well as in mission critical business
applications.
What businesses use R?
• Facebook - For behavior analysis related to status updates and profile pictures.
• Google - For advertising effectiveness and economic forecasting.
• Twitter - For data visualization and semantic clustering
• Microsoft - Acquired Revolution R company and use it for a variety of purposes.
• Uber - For statistical analysis
• Airbnb - Scale data science.
• IBM - Joined R Consortium Group
• ANZ - For credit risk modeling
Click here for a list of companies using R.
14/30
18.
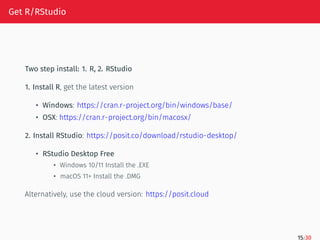
Get R/RStudio
Two stepinstall: 1. R, 2. RStudio
1. Install R, get the latest version
• Windows: https://cran.r-project.org/bin/windows/base/
• OSX: https://cran.r-project.org/bin/macosx/
2. Install RStudio: https://posit.co/download/rstudio-desktop/
• RStudio Desktop Free
• Windows 10/11 Install the .EXE
• macOS 11+ Install the .DMG
Alternatively, use the cloud version: https://posit.cloud
15/30
19.
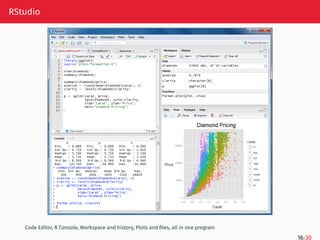
RStudio
Code Editor, RConsole, Workspace and history, Plots and files, all in one program
16/30
20.
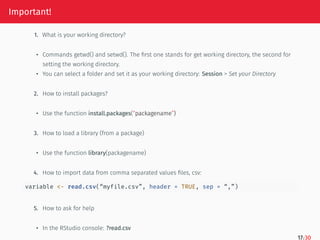
Important!
1. What isyour working directory?
• Commands getwd() and setwd(). The first one stands for get working directory, the second for
setting the working directory.
• You can select a folder and set it as your working directory: Session > Set your Directory
2. How to install packages?
• Use the function install.packages(“packagename”)
3. How to load a library (from a package)
• Use the function library(packagename)
4. How to import data from comma separated values files, csv:
variable <- read.csv(“myfile.csv”, header = TRUE, sep = “,”)
5. How to ask for help
• In the RStudio console: ?read.csv
17/30
21.
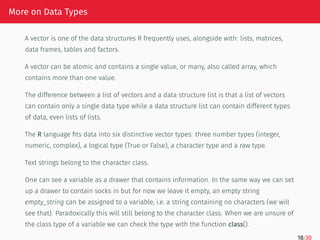
More on DataTypes
A vector is one of the data structures R frequently uses, alongside with: lists, matrices,
data frames, tables and factors.
A vector can be atomic and contains a single value, or many, also called array, which
contains more than one value.
The difference between a list of vectors and a data structure list is that a list of vectors
can contain only a single data type while a data structure list can contain different types
of data, even lists of lists.
The R language fits data into six distinctive vector types: three number types (integer,
numeric, complex), a logical type (True or False), a character type and a raw type.
Text strings belong to the character class.
One can see a variable as a drawer that contains information. In the same way we can set
up a drawer to contain socks in but for now we leave it empty, an empty string
empty_string can be assigned to a variable, i.e. a string containing no characters (we will
see that). Paradoxically this will still belong to the character class. When we are unsure of
the class type of a variable we can check the type with the function class().
18/30
22.
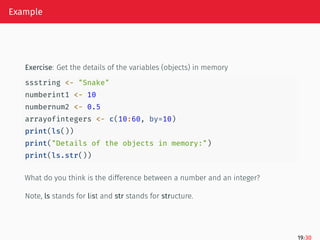
Example
Exercise: Get thedetails of the variables (objects) in memory
ssstring <- "Snake"
numberint1 <- 10
numbernum2 <- 0.5
arrayofintegers <- c(10:60, by=10)
print(ls())
print("Details of the objects in memory:")
print(ls.str())
What do you think is the difference between a number and an integer?
Note, ls stands for list and str stands for structure.
19/30
23.
Some Basics
(empty_string <-"")
## [1] ""
class(empty_string)
## [1] "character"
Similarly, we can create an empty character by using the function character() setting the length argument (the
parameters inside the parenthesis of a function) to zero.
empty_character <- character(length = 0)
empty_character
## character(0)
class(empty_character)
## [1] "character"
What if we wanted to have a vector of character type but containing no elements in it? We can see this as character
type vector initialization.
character_vector <- character(10)
character_vector
## [1] "" "" "" "" "" "" "" "" "" ""
20/30
24.
Some Basics
We canassign words or strings to this newly created empty vector by selecting the vector’s position we want to
occupy. In our case, we want to occupy the fifth position of the vector with the word ”five” and we access it by
indexing. Indexing is achieved by adding square brackets after the vector’s name and insert the position which is
given by a number.
character_vector[5] <- "fifth"
character_vector
## [1] "" "" "" "" "fifth" "" "" "" ""
## [10] ""
One must be fully aware that a vector is for homogeneous storage, meaning that, it can only hold data of the same
type. If we had a number type vector and we append a string to it, R will convert the numeric values it holds inside
the vector into strings.
If we need full control over the vectors we can convert the vector types ourselves. We can check if a vector is of
character type with the help of the function is.character().
Casting from one type to another, for example from numeric to character, can be accomplished through the function
as.character() because we might want to have numbers written as a text. Number types are used for computations
while numbers written as a text belong to the character type and can be interpreted as words.
21/30
25.
Some Basics
In thefollowing example we can see two variables, x and y holding two different objects: character and numeric,
respectively. We can check specifically if they are of character type or not. Use the class() type and cast one type
into another and check again to see if the last operation successfully occurred.
x <- "really, is this a character?"
y <- 9+8
is.character(x)
## [1] TRUE
is.character(y)
## [1] FALSE
class(x)
## [1] "character"
class(y)
## [1] "numeric"
y <- as.character(y)
class(y)
## [1] "character"
22/30
26.
Some Basics
There aresituations in which we need to put together different strings to create
longer ones by concatenating them. The paste() function will accomplish this. It
has two arguments: sep and collapse.
x <- paste("My favorite book", "has many chapters", sep = " ")
x
## [1] "My favorite book has many chapters"
chapters <- paste("Chapter", 1:5, sep=".", collapse = ", ")
chapters
## [1] "Chapter.1, Chapter.2, Chapter.3, Chapter.4, Chapter.5"
Perhaps you have noticed that we used the same variable, x, as in the previous
example. Whenever you reuse the name of a variable you overwrite it with the
new data, so it is a good idea to keep good track of the names you have already
given.
23/30
27.
Working with strings
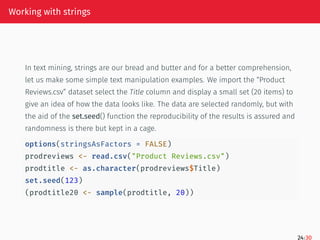
Intext mining, strings are our bread and butter and for a better comprehension,
let us make some simple text manipulation examples. We import the “Product
Reviews.csv” dataset select the Title column and display a small set (20 items) to
give an idea of how the data looks like. The data are selected randomly, but with
the aid of the set.seed() function the reproducibility of the results is assured and
randomness is there but kept in a cage.
options(stringsAsFactors = FALSE)
prodreviews <- read.csv("Product Reviews.csv")
prodtitle <- as.character(prodreviews$Title)
set.seed(123)
(prodtitle20 <- sample(prodtitle, 20))
24/30
28.
Working with strings
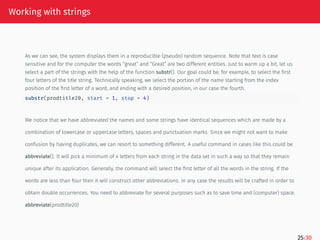
Aswe can see, the system displays them in a reproducible (pseudo) random sequence. Note that text is case
sensitive and for the computer the words “great” and “Great” are two different entities. Just to warm up a bit, let us
select a part of the strings with the help of the function substr(). Our goal could be, for example, to select the first
four letters of the title string. Technically speaking, we select the portion of the name starting from the index
position of the first letter of a word, and ending with a desired position, in our case the fourth.
substr(prodtitle20, start = 1, stop = 4)
We notice that we have abbreviated the names and some strings have identical sequences which are made by a
combination of lowercase or uppercase letters, spaces and punctuation marks. Since we might not want to make
confusion by having duplicates, we can resort to something different. A useful command in cases like this could be
abbreviate(). It will pick a minimum of 4 letters from each string in the data set in such a way so that they remain
unique after its application. Generally, the command will select the first letter of all the words in the string. If the
words are less than four then it will construct other abbreviations. In any case the results will be crafted in order to
obtain double occurrences. You need to abbreviate for several purposes such as to save time and (computer) space.
abbreviate(prodtitle20)
25/30
29.
Working with strings
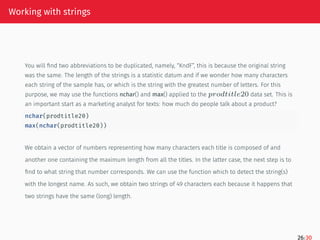
Youwill find two abbreviations to be duplicated, namely, “KndF”, this is because the original string
was the same. The length of the strings is a statistic datum and if we wonder how many characters
each string of the sample has, or which is the string with the greatest number of letters. For this
purpose, we may use the functions nchar() and max() applied to the 𝑝𝑟𝑜𝑑𝑡𝑖𝑡𝑙𝑒20 data set. This is
an important start as a marketing analyst for texts: how much do people talk about a product?
nchar(prodtitle20)
max(nchar(prodtitle20))
We obtain a vector of numbers representing how many characters each title is composed of and
another one containing the maximum length from all the titles. In the latter case, the next step is to
find to what string that number corresponds. We can use the function which to detect the string(s)
with the longest name. As such, we obtain two strings of 49 characters each because it happens that
two strings have the same (long) length.
26/30
30.
Working with strings
prodtitle20[which(nchar(prodtitle20)==max(nchar(prodtitle20)))]
Inplain English, this can be translated from R: which is the string that has the maximum number of characters
inside the sample data set prodtitle20? How can we find how many titles are in the data set and how many of these
titles are unique? We can use the functions length() and unique() to give an answer to both previous questions.
length(prodtitle)
length(unique(prodtitle))
Because we have mentioned the word statistics applied to this data set, a quick overview can be obtained with the
help of the function summary() regarding the number of characters of each string and as such we shift our attention
to the whole prodtitle data set.
summary(nchar(prodtitle))
27/30
31.
Working with strings
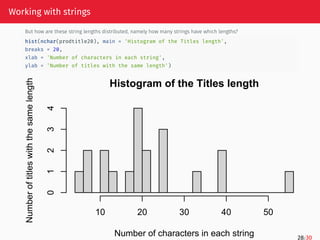
Buthow are these string lengths distributed, namely how many strings have which lengths?
hist(nchar(prodtitle20), main = 'Histogram of the Titles length',
breaks = 20,
xlab = 'Number of characters in each string',
ylab = 'Number of titles with the same length')
Histogram of the Titles length
Number of characters in each string
Number
of
titles
with
the
same
length
10 20 30 40 50
0
1
2
3
4
28/30


![Some Basics
(empty_string <- "")
## [1] ""
class(empty_string)
## [1] "character"
Similarly, we can create an empty character by using the function character() setting the length argument (the
parameters inside the parenthesis of a function) to zero.
empty_character <- character(length = 0)
empty_character
## character(0)
class(empty_character)
## [1] "character"
What if we wanted to have a vector of character type but containing no elements in it? We can see this as character
type vector initialization.
character_vector <- character(10)
character_vector
## [1] "" "" "" "" "" "" "" "" "" ""
20/30](https://image.slidesharecdn.com/lecture1-250930202101-11b0fb95/85/ON-Line-COntent-Analysis-TExt-mining-using-R-23-320.jpg)
![Some Basics
We can assign words or strings to this newly created empty vector by selecting the vector’s position we want to
occupy. In our case, we want to occupy the fifth position of the vector with the word ”five” and we access it by
indexing. Indexing is achieved by adding square brackets after the vector’s name and insert the position which is
given by a number.
character_vector[5] <- "fifth"
character_vector
## [1] "" "" "" "" "fifth" "" "" "" ""
## [10] ""
One must be fully aware that a vector is for homogeneous storage, meaning that, it can only hold data of the same
type. If we had a number type vector and we append a string to it, R will convert the numeric values it holds inside
the vector into strings.
If we need full control over the vectors we can convert the vector types ourselves. We can check if a vector is of
character type with the help of the function is.character().
Casting from one type to another, for example from numeric to character, can be accomplished through the function
as.character() because we might want to have numbers written as a text. Number types are used for computations
while numbers written as a text belong to the character type and can be interpreted as words.
21/30](https://image.slidesharecdn.com/lecture1-250930202101-11b0fb95/85/ON-Line-COntent-Analysis-TExt-mining-using-R-24-320.jpg)
![Some Basics
In the following example we can see two variables, x and y holding two different objects: character and numeric,
respectively. We can check specifically if they are of character type or not. Use the class() type and cast one type
into another and check again to see if the last operation successfully occurred.
x <- "really, is this a character?"
y <- 9+8
is.character(x)
## [1] TRUE
is.character(y)
## [1] FALSE
class(x)
## [1] "character"
class(y)
## [1] "numeric"
y <- as.character(y)
class(y)
## [1] "character"
22/30](https://image.slidesharecdn.com/lecture1-250930202101-11b0fb95/85/ON-Line-COntent-Analysis-TExt-mining-using-R-25-320.jpg)
![Some Basics
There are situations in which we need to put together different strings to create
longer ones by concatenating them. The paste() function will accomplish this. It
has two arguments: sep and collapse.
x <- paste("My favorite book", "has many chapters", sep = " ")
x
## [1] "My favorite book has many chapters"
chapters <- paste("Chapter", 1:5, sep=".", collapse = ", ")
chapters
## [1] "Chapter.1, Chapter.2, Chapter.3, Chapter.4, Chapter.5"
Perhaps you have noticed that we used the same variable, x, as in the previous
example. Whenever you reuse the name of a variable you overwrite it with the
new data, so it is a good idea to keep good track of the names you have already
given.
23/30](https://image.slidesharecdn.com/lecture1-250930202101-11b0fb95/85/ON-Line-COntent-Analysis-TExt-mining-using-R-26-320.jpg)
![Working with strings
prodtitle20[which(nchar(prodtitle20)==max(nchar(prodtitle20)))]
In plain English, this can be translated from R: which is the string that has the maximum number of characters
inside the sample data set prodtitle20? How can we find how many titles are in the data set and how many of these
titles are unique? We can use the functions length() and unique() to give an answer to both previous questions.
length(prodtitle)
length(unique(prodtitle))
Because we have mentioned the word statistics applied to this data set, a quick overview can be obtained with the
help of the function summary() regarding the number of characters of each string and as such we shift our attention
to the whole prodtitle data set.
summary(nchar(prodtitle))
27/30](https://image.slidesharecdn.com/lecture1-250930202101-11b0fb95/85/ON-Line-COntent-Analysis-TExt-mining-using-R-30-320.jpg)


![R basics for MBA Students[1].pptx](https://cdn.slidesharecdn.com/ss_thumbnails/rbasicsformbastudents1-240213044033-aee3b8d3-thumbnail.jpg?width=640&height=640&fit=bounds)


![제 23회 보아즈(BOAZ) 빅데이터 컨퍼런스 - [MBOAX] : ABSA를 활용한 소비자 반응 분석 기반 운영 효율화 대시보드 설계](https://cdn.slidesharecdn.com/ss_thumbnails/3-1boaz23rdconferencemboax-260203102709-9d519923-thumbnail.jpg?width=640&height=640&fit=bounds)
![7.__Developing_a_Research_Proposal[1].pptx](https://cdn.slidesharecdn.com/ss_thumbnails/7-260131073037-df92dd7d-thumbnail.jpg?width=640&height=640&fit=bounds)


