OSVC_Meta-Data based Simulation Automation to overcome Verification Challenge...
oil-and-gas-water-coning-in vertical-well.pdf
1. CHAPTER 3
MECHANISTIC COMPARISON OF WATER CONING IN OIL AND GAS
WELLS
Water coning in gas wells has been understood as a phenomenon similar to that in
oil well. In contrast to oil wells, relatively few studies have been reported on aspects of
water coning in gas wells.
Muskat (1982) believed that the physical mechanism of water coning in gas wells
is identical to that for oil wells; moreover, he said that water coning would cause less
serious difficulties for wells producing from gas zones than for wells producing oil.
Trimble and DeRose (1976) supported Muskat’s theory with water coning data
and simulation for Todhunters Lake Gas field. They calculated water-free production
rates using the Muskat-Wyckof (1935) model for oil wells in conjunction with the graph
presented by Arthurs (1944) for coning in homogeneous oil sand. The results were
compared with a field study with a commercial numerical simulator showing that the
rates calculated with the Muskat-Wyckof theory were 0.7 to 0.8 those of the coning
numerical model for a 1-year period.
The objective of this study is to compare water coning in gas-water and oil-water
systems. Analytical and numerical models are used to identify possible differences and
similarities between both systems.
3.1 Vertical Equilibrium
A hydrocarbon-water system is in vertical equilibrium when the pressure
drawdown around the wellbore is smaller than the pressure gradient generated by the
density contrast between the hydrocarbon and water at the hydrocarbon-water interface.
Equation 3.1 shows the pressure gradient for gas-water system.
30
2. w
g
g
w h
p −
−
=
∆ )
(
433
.
0 γ
γ ………………………………………………(3.1)
Where ∆p is pressure gradient (psia), γw is water specific gravity, γg is gas specific
gravity, and hg-w is the vertical distance from the reference level to the gas-water
interface, normally from the bottom of the well’s completion to the gas/water contact (ft).
Vertical equilibrium concept is the base for critical rates calculations. Critical
rate, in gas-water systems, is defined as the maximum rate at which gas wells are
produced without production of water.
3.2 Analytical Comparison of Water Coning in Oil and Gas Wells before Water
Breakthrough
Two hydrocarbon systems, oil and gas, in vertical equilibrium with bottom water
are considered to compare water coning in oil and gas wells before breakthrough. The
two systems have the same reservoir properties and thickness, and are perforated at the
top of the producing zone.
well
re= 1000 ft
µw=0.56 cp
ρw= 1.02 gr/cc
rw= 0.5 ft
50 ft
20 ft
Oil Gas
µ= 1.0 cp 0.017 cp
ρ= 0.8 gr/cc 0.1 gr/cc
water
K= 100 md
φ=0.2
P=2000 psi
T= 112 o
F
Figure 3.1 Theoretical model used to compare analytically water coning in oil and
gas wells before breakthrough.
31
3. Figure 3.1 shows a sketch of the reservoir system including the properties and
dimensions. The mathematical calculations are included in Appendix A.
A pressure drawdown needed to generate the same static water cone below the
penetrations, and the fluid rate for each system was calculated. For the system of oil and
water and a cone height of 20 ft, a pressure drawdown equal to 2 psi is needed, and the
oil production rate is 6.7 stb/d. In the case of a gas-water system, for the same 20 ft
height of water cone 8 psi pressure drop is needed, and the gas production rate of 1.25
MMscfd.
From this first simple analysis it is evident that it is possible to have a stable water cone
of any given height in the two systems (oil-water and gas-water). For the same cone
height in vertical equilibrium, pressure drop in the gas-water system is four times greater
than the pressure drop in the oil-water system. There is a big difference in the fluids
production rate for gas-water and oil-water system. On the basis of British Thermal Units
(BTU), the energy content of one Mscf of natural gas is about 1/6 of the energy content
of one barrel of oil (Economides, 2001). For this example, the 1.25 MMscf are equivalent
to the BTU content of 208 barrels of oil. Therefore, for the same water cone height, it
would be economically possible to produce gas-water systems at the gas rate below
critical. However, in most cases it would not be not economically possible to produce oil-
water systems without water breakthrough.
3.3 Analytical Comparison of Water Coning in Oil and Gas Wells after Water
Breakthrough
The objective is to compare the shape of oil-water and gas-water interfaces at the
wellbore after water breakthrough. After the water breakthrough, there is a stratified
inflow of oil or gas with the water covering the bottom section of the well completion.
Again, two systems having the same reservoir properties and thickness are compared (oil-
32
4. water and gas-water). Both systems are totally penetrated. An equation describing
interface shape was derived using the assumptions of Muskat (1982). Figure 2 shows a
sketch of the theoretical model, and Appendix A gives the derivation and mathematical
computations.
In reality the resulting equations will not describe perfectly the inflow at the well.
However, they are useful to compare the coning phenomenon in oil-water and gas-water
systems.
well
r
Pw
r
y=?
ye
h
oil / gas
water
Pe
Figure 3.2 Theoretical model used to compare analytically water coning in oil and
gas wells after breakthrough.
The resulting equations for the water coning analysis are:
For the oil-water system the interface height is described as,
+
=
1
b
a
h
y …………………………………………………………………(3.1)
here a, and b are constants described as,
kh
Q
a o
o
πφ
µ
2
=
kh
Q
b w
w
πφ
µ
2
= .
e
e
y
y
h
b
a −
= …….………………………………………………………………(3.2)
33
5. For the gas-water system the interface height is represented as,
[ ]
p
b
a
hp
y
+
=
)
/
(
………………………………………………………………(3.3)
here a, b, and p are calculated using:
kh
Q
a
g
g
πφ
µ
2
= ,
kh
Q
b w
w
πφ
µ
2
= , and
e
e
e
p
h
y
h
y
b
a
*
)
/
(
)]
/
(
1
[ −
= ………………………………………………………………(3.4)
+
+
−
−
=
b
a
p
b
a
p
b
a
p
p
b
r
r e
e
e
/
/
ln
1
ln ………………………………………….(3.5)
From Equation 3.1 it becomes obvious that when the well’s inflow of oil and water
is stratified so the upper and bottom sections of completion produce oil and water
respectively, under steady state flow conditions the interface between the two fluids is
constant and perpendicular to the wellbore because the parameter describing the interface
height are all constant and depends on the system geometry.
For the gas-water system, nevertheless, the interface height depends on the
geometry of the system, and the pressure distribution in the reservoir (Equation 3.3).
In order to demonstrate the model for gas-water systems describing the interface
between gas-water, one example was solved.
The system data are as follow: pe = 2000 psi re = 2000 ft rw = 0.4 ft
h = 50 ft ye = 40 ft µw = 0.498 cp Bw = 1.0
k = 100 md φ = 0.25 µg = 0.017 cp
The procedure is as follows:
1. Assuming a value for the pressure drawdown (300 psi).
2. Calculating the flowing bottom hole pressure ( )
1700
300
2000 =
−
=
∆
−
= p
p
p e
w ,
assuming that pw is constant along the wellbore.
34
6. 3. Computing the water flow rate (Qw) using Darcy’s law equation (Kraft and
Hawkins, 1991):
2000
)
4
.
0
/
2000
ln(
*
0
.
1
*
498
.
0
)
1700
2000
(
*
40
*
100
*
00708
.
0
)
/
ln(
)
(
00708
.
0
=
−
=
−
=
w
e
w
w
w
e
w
w
r
r
B
p
p
kh
Q
µ
4. Calculating a/b, using EquationA-16 in Appendix A:
[ ] 500
)
50
/
40
(
2000
*
)
50
/
40
(
1
)
/
(
)
/
(
1
=
−
=
−
= e
e
e
p
h
y
h
y
b
a
, which is constant for the system
and independent for the gas rate.
5. Finding Qg, from Equation A-15 in Appendix A:
w
w
g
g
Q
Q
b
a
µ
µ
= ⇒
498
.
0
*
2000
615
.
5
*
017
.
0
*
500
g
Q
= Qg = 5.22 MMscf/d
Note that WGR is constant for the system and depends only on the system geometry
(ye, h) and pressure drive (pe).
6. Computing 1/b, using Equation A-17 in Appendix A:
+
+
−
−
=
)
/
(
)
/
(
ln
)
(
ln
1
b
a
p
b
a
p
b
a
p
p
r
r
b
w
e
w
e
w
e
( )
031
.
0
500
1700
500
2000
ln
500
)
1700
2000
(
4
6000
ln
1
=
+
+
−
−
=
b
7. Assuming pressure values between pe and pw, radii r and the gas-water profile y are
calculated, using Equations A-14 and A-18 respectively in Appendix A. This is the
gas-water interface profile. The equation used to calculate pressure distribution in
the reservoir is:
35
7.
+
+
−
−
=
b
a
p
b
a
p
b
a
p
p
b
r
r e
e
e
/
/
ln
1
ln
+
+
−
−
=
500
500
2000
ln
500
2000
031
.
0
6000
ln
p
p
r
The equation used to calculate the gas-water interface profile (height) is:
[ ]
p
b
a
hp
y
+
=
)
/
(
⇒
[ ]
p
p
y
+
=
500
*
50
(Note that this pressure distribution does not depend on values of flow rate but only on
their ratio.)
Repeating the same procedure for the oil-water system:
From Equation A-22 in Appendix A: 25
.
0
40
)
40
50
(
)
(
=
−
=
−
=
e
e
y
y
h
b
a
Using Equation A-26 in Appendix A: 40
)
1
25
.
0
(
50
1
=
+
=
+
=
b
a
h
y
For the oil-water system y remains constant ( y = 40) and independent from radius.
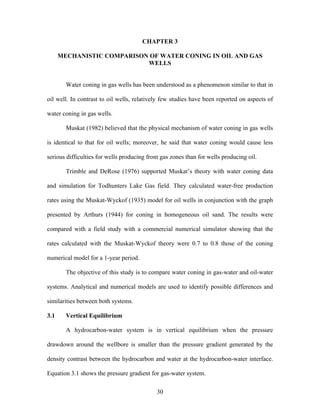
Fluids Interface Height (y) vs radii (r)
38.4
38.6
38.8
39.0
39.2
39.4
39.6
39.8
40.0
40.2
0 500 1000 1500 2000 2500
Radii (ft)
Fluids
Interface
Height
(ft)
gas-water system oil-water system
Figure 3.3 Shape of the gas-water and oil-water contact for total perforation.
36
8. Figure 3.3 shows the resulting profiles of the fluid interface in gas-water and oil-
water systems. After breakthrough, the oil-water interface at the well’s completion is
horizontal, while the gas-water interface tends to cone into the water. For this example
the total length of the gas cone is 1.4 ft.
3.4 Numerical Simulation Comparison of Water Coning in Oil and Gas Wells
after Water Breakthrough
One numerical simulator model was built to confirm the previous finding about
the cone shape around the wellbore. Figure 3.4 shows the numerical model with its
properties. Table 3.1 shows fluids properties used, and Appendix B contains Eclipse data
deck for the models.
600 ft
k= 10 md SGgas= 0.6
φ=0.25 APIoil=
Pinitial=2300 psi T= 110 o
F
Water (W)
Gas
or
Oil
9 layers 5 ft
thick, and one
layer 550 ft
thick.
100 layers
of 0.5 ft thick
Top: 5000 ft
5000 ft
50 ft
Well, rw= 3.3 in
Figure 3.4 Numerical model used for comparison of water coning in oil-water and
gas-water systems.
37
10. Following similar procedures used for the analytical comparison, again, two
systems having the same reservoir properties and thickness are compared (oil-water and
gas-water). Both systems are totally penetrated and produced at the same water rate. The
cone shape around the wellbore is investigated. Figures 3.5 and 3.6 show the results.
Swept Zone
Swept Zone
Irreducible water
Saturation
Irreducible water
Saturation
Gas-Water Oil-Water
Figure 3.5 Numerical comparison of water coning in oil-water and gas-water systems
after 395 days of production.
Figure 3.5 depicts water saturation in the reservoir after 392 days of production
for gas-water and oil-water systems. The initial water-hydrocarbon contact was at 5050
ft. In both systems the cone is developed almost in the same shape and height.
Figure 3.6 shows a zoom view at the top of the cone for both systems. For the oil-
water system, the cone interface at the top is flat. For the gas-water system, however, the
39
11. cone interface is cone-down at the top. For this model the total length of the gas cone is
1.5 ft. One can see that the numerical model represents exactly the same behavior
predicted for the analytical model used previously.
Gas-Water System Oil-Water System
Figure 3.6 Zoom view around the wellbore to watch cone shape for the numerical
model after 395 days of production.
From comparison of water coning after breakthrough in gas-water and oil-water
systems, it is possible to conclude that in gas wells, water cone is generated in the same
way as in the oil-water system. The shape at the top of the cone, however, is different in
oil-water than in gas-water systems. For the oil-water system the top of the cone is flat.
For the gas-water system a small inverse gas cone is generated locally around the
40
12. completion. This inverse cone restricts water inflow to the completions. Also, the inverse
gas cone inhibits upward progress of the water cone.
3.5 Discussion About Water Coning in Oil-Water and Gas-water Systems
The physical analysis of water coning in oil-water and gas-water systems is the
same. In both systems, water coning is generated when the drawdown in the vicinity of
the well is higher then the gravitational gradient due to the density contrast between the
hydrocarbon and the water.
The density difference between gas and water is grater than the density difference
between oil and water by a factor of at least four (Muskat, 1982). Because of that, the
drawdown needed to generate coning in the gas-water system is at least four-time grater
than the one in oil-water system. Pressure distribution, however, is more concentrated
around the wellbore for gas wells that for oil wells (gas flow equations have pressure
square in them, but oil flow equations have liner pressure; inertial effect is important in
gas well, and negligible in oil wells). This property makes water coning greater in gas
wells than in oil wells.
Gas mobility is higher that water mobility. Oil mobility, however, is lower than
water mobility. This situation makes water coning more critical in oil-water system than
in gas-water systems.
Gas compressibility is higher than oil compressibility. Then, gas could expand
larger in the well vicinity than oil. Because of this expansion, gas takes over some extra
portion of the well-completion (the local reverse cone explained in the previous section)
restricting water inflow.
In short, there are factor increasing and decreasing water coning tendency in both
system. The fact that oil-water systems appear more propitious for water coning
41
13. 42
development should not create the appearance that the phenomena is not important is gas-
water system.