Obama Tax Plan: Impact on DC
•
1 like•95 views

Impact of President Obama's tax plan on District of Columbia and how the planned tax hike or tax increase will impact District of Columbia's economy

Recommended
More Related Content
What's hot
What's hot (20)
Similar to Obama Tax Plan: Impact on DC
Similar to Obama Tax Plan: Impact on DC (11)
More from The Heritage Foundation
More from The Heritage Foundation (20)
Obama Tax Plan: Impact on DC
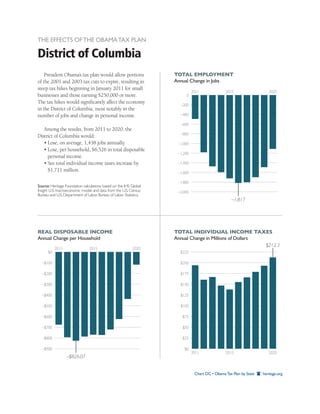
- 1. THE EFFECTS OF THE OBAMA TAX PLAN District of Columbia President Obama’s tax plan would allow portions TOTAL EMPLOYMENT of the 2001 and 2003 tax cuts to expire, resulting in Annual Change in Jobs steep tax hikes beginning in January 2011 for small 2011 2015 2020 businesses and those earning $250,000 or more. 0 The tax hikes would significantly affect the economy –200 in the District of Columbia, most notably in the number of jobs and change in personal income. –400 –600 Among the results, from 2011 to 2020, the –800 District of Columbia would: • Lose, on average, 1,438 jobs annually. –1,000 • Lose, per household, $6,526 in total disposable –1,200 personal income. • See total individual income taxes increase by –1,400 $1,711 million. –1,600 –1,800 Source: Heritage Foundation calculations based on the IHS Global Insight U.S. macroeconomic model, and data from the U.S. Census –2,000 Bureau and U.S. Department of Labor, Bureau of Labor Statistics. –1,817 REAL DISPOSABLE INCOME TOTAL INDIVIDUAL INCOME TAXES Annual Change per Household Annual Change in Millions of Dollars $212.3 2011 2015 2020 $0 $225 –$100 $200 –$200 $175 –$300 $150 –$400 $125 –$500 $100 –$600 $75 –$700 $50 –$800 $25 –$900 $0 2011 2015 2020 –$826.07 Chart DC • Obama Tax Plan by State heritage.org
- 2. THE EFFECTS OF THE OBAMA TAX PLAN Change in Employment in District of Columbia Average Annual Change in Total Employment, 2011 to 2020, by Congressional District Jobs Lost: 800–1,399 Jobs Lost: 1,400–1,599 Jobs Lost: 1,600–1,799 Jobs Lost: 1,800–2,320 State: 1,438 jobs lost annually on average Source: Heritage Foundation calculations based on the IHS Global Insight U.S. macroeconomic model, and data from the U.S. Census Bureau and U.S. Department of Labor, Bureau of Labor Statistics. Map DC • Obama Tax Plan by State heritage.org