Download as PDF, PPTX


![National Venture Capital Association
Virtually all LP agreements require GPs to use US prior to the measurement date to allow for market-
GAAP for financial reporting. US GAAP requires Fair ing activities that are usual and customary…” -
Value reporting for virtually all VC firms because they SFAS 157, Paragraph 7].
are “investment companies.” US GAAP continues to
define Fair Value as: “the price that would be received • The valuations set by the most recent financing
to sell an asset…in an orderly transaction between round – perhaps even one in the third quarter of
market participants at the measurement date.” 2008 – may be stale and inappropriate for determin-
ing Fair Value, especially given current market con-
Fund managers need to establish Fair Values even ditions.
though they may not currently need to sell, or cannot
sell, their private investments in this market. GPs • The Fair Value at December 31 in many cases will
must use their judgment in estimating the current likely be different from the value at September 30,
Fair Values of their investments, even though “exit given the deterioration of the macro economic envi-
markets” may have few buyers, IPO markets appear ronment.
closed, and there are few, if any, relevant comparable
transactions. Such judgment should take into account • Each valuation should reflect a company’s degree
all relevant information, including a financing of progress from the prior reporting date to the cur-
round’s specific terms and conditions. rent one.
There are no easy outs, rules of thumb or safe harbors • To determine a portfolio company’s Fair Value,
for establishing Fair Value. GPs should apply their judgment in a consistent
manner and evaluate the same data they use for
As always, best considerations for Fair Value deter- monitoring a company’s performance and
mination include the following: progress. There is no magic formula or weighting
of factors.
• The Fair Value of an investment portfolio is the sum
of the Fair Value determined for each portfolio In summary, determining Fair Value continues to
company using a “bottoms up” approach. Applying require the exercise of judgment based on objective
a “top-down” overall percentage adjustment to the evidence, such as calibrating the original investment
aggregate portfolio’s value is not compliant with decision with the current performance of the compa-
US GAAP. ny and the current economic environment. The fact
• Valuations should reflect specific factors in a that the macro market is distressed probably adverse-
buy/sell context. For example, a GP could ask: ly impacts the value of most companies. This nega-
“Given my portfolio company’s current cash posi- tive impact may be compounded by disappointing
tion, cash burn rate, performance compared to plan, company performance or mitigated by tangible and
probability of meeting forecasts, the projected envi- sustainable company progress.
ronment for its product or technology, etc., as a
board member, what is the lowest price that I would If you need more details about Fair Value, you might
sell the company’s stock today in an orderly sale consider the 18-page PEIGG Valuation Guidelines at
with a willing buyer?” [Footnote: A fund manager www.peigg.org, or you can download the 158-page
should not assume a “fire sale” of the stock, but SFAS 157 at www.fasb.org.”
should assume “exposure to the market for a period
108 Thomson Reuters](https://image.slidesharecdn.com/nvcayearbook2011final-110329133557-phpapp01/85/NVCA-yearbook-2011-109-320.jpg)


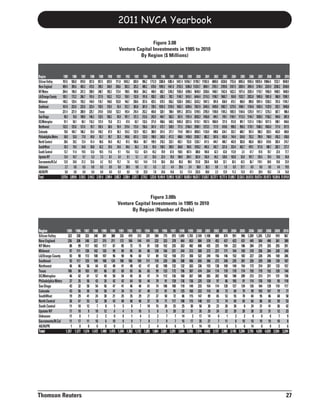
The National Venture Capital Association Yearbook 2011 provides statistics on venture capital investment in the United States. It summarizes that venture capital is a key driver of economic growth and job creation. The Yearbook presents the latest statistics on venture capital activity in the US collected by Thomson Reuters, showing yet another record high level of participation. It is important to effectively communicate the story of venture capital and its importance to America's future.


