Download to read offline

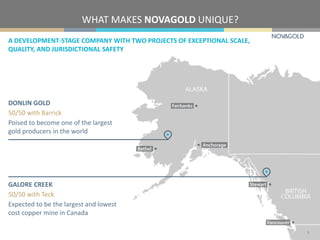
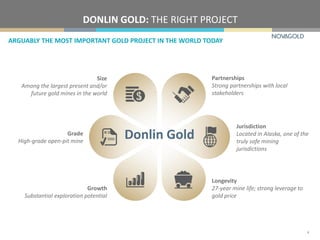
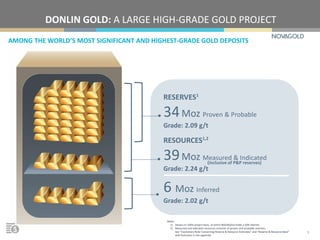
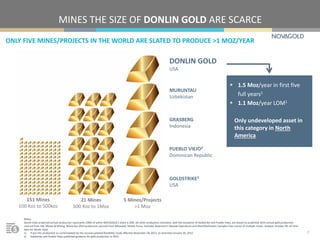
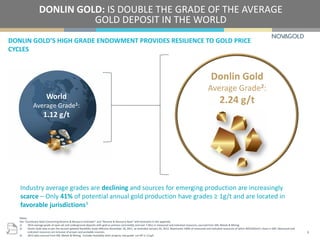
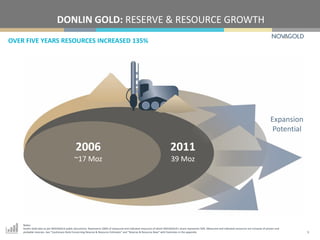
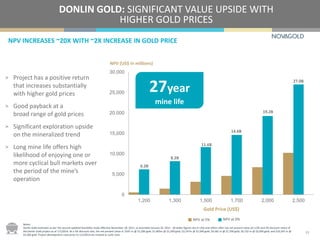
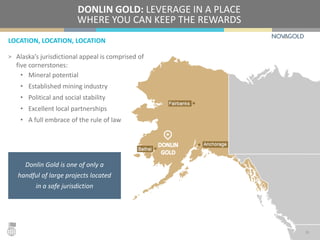
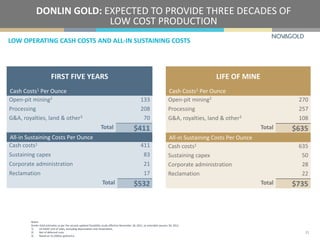

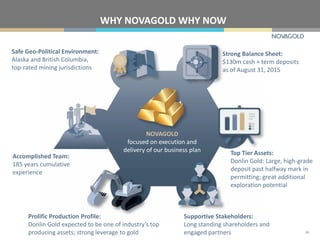


This document provides an overview of Novagold Resources Inc., which is a gold development company focused on advancing the high-grade Donlin Gold project in Alaska. Some key points: - Donlin Gold is considered one of the largest gold development projects in the world with over 39 million ounces of gold in measured and indicated mineral resources. - It has a projected 27-year mine life with average annual production of over 1 million ounces of gold at a very high average grade of over 2 grams per tonne. - The project is located in Alaska, considered one of the safest mining jurisdictions, and has strong community support. - With declining reserves at existing mines and few new discoveries, Donlin


