Download to read offline

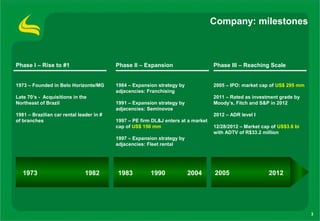
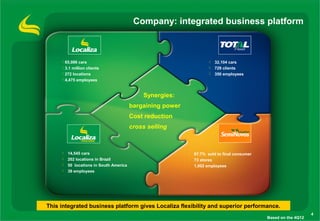
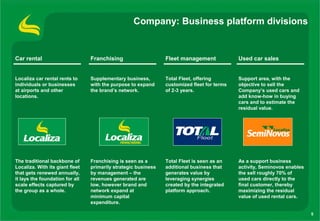
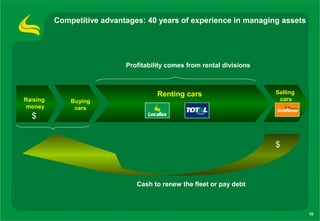
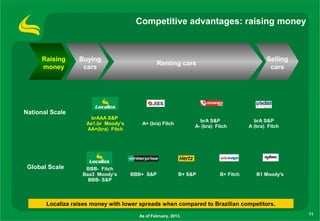
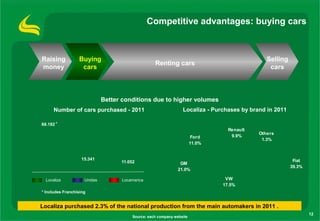
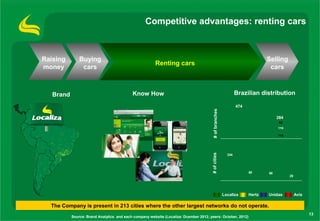
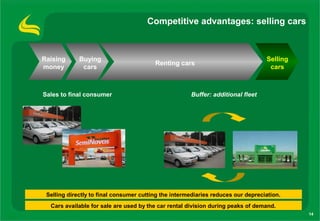

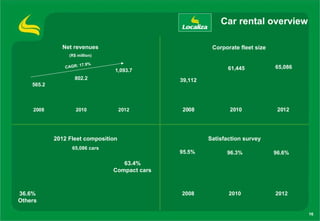
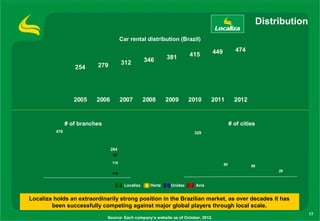
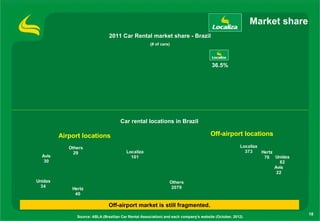
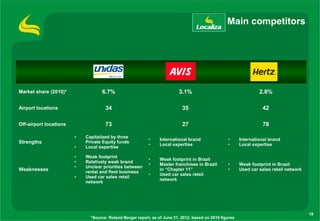
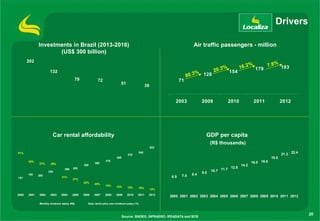

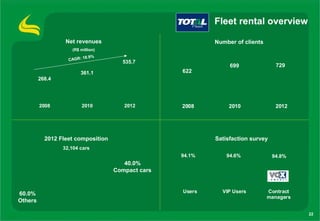
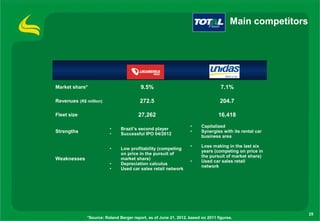

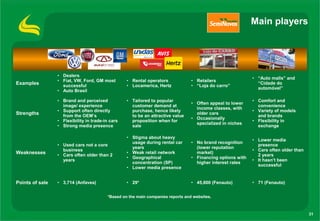

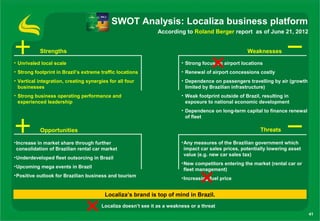


The document provides an overview of Localiza's car rental business. Localiza is the largest car rental company in Brazil, with a fleet of 65,086 cars and a presence in 474 locations across the country. It has built scale and brand recognition over 40 years of operations. Localiza has competitive advantages in its ability to purchase large volumes of cars at better prices, leverage its brand and distribution network, and sell used rental cars directly to consumers. While international competitors like Hertz and Avis have a larger airport presence, Localiza dominates the off-airport market in Brazil.


