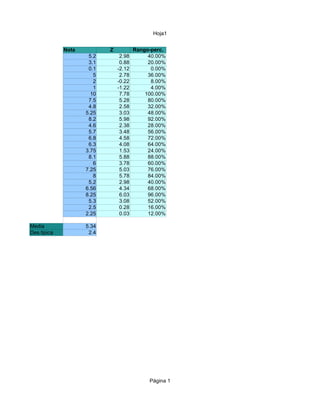
The document contains a table with three columns: Note, Z, and Range-perc. It includes data for 28 rows with values for each column. The mean of the values in the Note column is 5.34 and the standard deviation is 2.4.
The document discusses statistics related to employment rates in different age groups and years. The highest employment rate of 48.0% was among people aged 25-34, while the lowest rate of 2.0% was among people aged 65 and over. The employment rate was 33.5% in 1886 and increased over time to 60% in 1908 and 80.5% in 1970.
The document shows quarterly and annual advertising revenue figures from 2009 to 2003 for national retail classified and total print and online advertising in the United States. In 2009, national advertising revenue decreased 25.87% in the first quarter compared to the previous year. Total print advertising revenue declined 17.7% from 2008 levels. Overall, total print and online advertising revenue fell 16.6% from the previous year.
The document presents statistical data on the distribution of different occupations across various industry sectors. It shows that the education sector has the highest percentage of people working as teachers at 23.5%, while the health sector employs the most health professionals at 15%. The public administration sector employs the most managers at 15% and the highest number of clerical support workers at 12%.
This document tracks an individual's weight and body mass index over 50 days from March 17 to May 6, 2011. It records their starting weight of 71kg and height of 1.72m. Over this period it shows fluctuations in their weight from a low of 67kg to a high of 82kg, with an overall weight loss of 4kg. It also includes their daily weight changes in kg and weekly weight changes in grams.
El documento presenta datos antropométricos como la talla, peso, pliegues cutáneos y perímetro braquial de niños y niñas de 4 a 14 años. Los datos están divididos por edad y sexo, y también se presentan los resultados totales por edad y el total general.
El documento presenta los parámetros antropométricos, incluyendo la talla, peso, pliegue cutáneo y perímetro braquial, de estudiantes entre 4 y 14 años en Ubrique, Cádiz. Se muestran los valores promedio de cada parámetro por edad y sexo, así como el número total de estudiantes evaluados. Los resultados indican que la talla y peso promedio aumentan con la edad de forma consistente entre niños y niñas.
El documento proporciona un resumen de los gastos familiares previstos y reales para mayo de 2011 en las categorías de vivienda, transporte, alimentación, limpieza y ocio. Los gastos reales superaron los previstos en vivienda, alimentación y ocio, mientras que estuvieron por debajo de lo previsto en transporte y limpieza. El saldo final real fue ligeramente superior al previsto.
This document is a labor budget and utilization report for a company with multiple employees from 1998-2003 and projections for 2004. It includes each employee's name, position, hourly pay rate, utilization rates by year, standard hours, paid time off allocation, monthly costs, and other payroll details.
This document contains a conversion worksheet that shows the relationship between Z-value, DPMO (defects per million opportunities), percentage of defects, and yield. As the Z-value increases from 0 to 2, the DPMO decreases from 500,000 to 22,750, the percentage of defects decreases from 50% to 2.3%, and the yield increases from 50% to 97.7%.
The document contains data with names, numbers and percentages likely related to student evaluation scores. It includes headings like "Seguimiento", "Evaluaciones Parciales", "Porcentaje 60%", "Porcentaje 20%", "Bimestral", "Porcentaje 20%", "Nota Final" and "Nivel". It lists 20 students with associated numbers under these headings that appear to be calculating final student grades and levels.
The document contains data with names, numbers and percentages likely related to student evaluation scores. It includes headings like "Seguimiento", "Evaluaciones Parciales", "Porcentaje 60%", "Porcentaje 20%", "Bimestral", "Porcentaje 20%", "Nota Final" and "Nivel". It shows calculations being done with the numbers to determine final scores and performance levels for each student.
1) The document appears to contain statistical data on economic indicators over time, listing values for variables from 2000-2008.
2) The data is organized by year, quarter, and several variables including observed values (xt) and fitted values (xt*).
3) Additional calculations are shown including percentage changes from the previous period, growth rates, and statistical indices.
The document contains a table with student grades, ranging from 2.5 to 9.5. It includes the grade, z-score, and percentile rank for each student. Additional statistics given are the mean grade of 6.52 and standard deviation of 1.98.
The document discusses factors that impact dishwasher performance such as how items are loaded, water temperature, detergent type, and use of additives. It explains that enzymes work best at certain temperatures to break down proteins and starches, while bleach works best at higher temperatures to oxidize soils. The document also notes common issues reported by technicians like residue, food particles, wet items, hard water staining, and odors. Finally, it provides details on how rinse agents lower surface tension to improve drying and protect against water spots, and how dishwasher cleaners can help with hard water buildup.
The document contains a table with two columns - Notes and Range perception. It lists different note values from 1 to 9.5 and their corresponding range perception percentages. It also includes the mean and standard deviation of the note values.
The document contains CCR's 2Q07 earnings presentation. It summarizes that CCR saw an 8.4% increase in net revenue and 56.1% increase in net income in 2Q07. Traffic increased 6.3% in 2Q07 and operating costs decreased 7.2%, contributing to improved margins. CCR also provided details on its results by concession and an outlook for continued growth through investments in its existing concessions and pursuing new opportunities.
130321 0131 rapport baromètre politique 3 c etudes vague 15 - mars 2013 hb hgmosaiquefm
The document is a political barometer survey from 3C Etudes in Tunisia from March 2013. It contains the following key points:
- A total of 1609 telephone interviews were conducted for the survey.
- Support for Ennahdha has decreased to 43% compared to 52.1% in 2013, while Nida Tounes has increased to 47.9%.
- Evaluations of the economic situation have declined, with a majority now saying the country is heading in the wrong direction.
- Prime Minister Ali Larayedh receives low marks for his handling of the country's affairs.
The document provides two examples of equity derivative trades. The first is a long-term macro strategy that utilized options to capture implied volatility. It generated a 35% gain but was unwound due to concerns over higher future volatility. The second example discusses a short-term trade, selling put options on McDonald's following a pullback in the stock. The trade generated a profit when McDonald's sales beat expectations. Potential future trade ideas discussed include M&A plays, inflation hedges, and long volatility strategies.
A Situación Laboral dos Enxeñeiros de Telecomunicación de GaliciaCarlos López Ardao
This document contains a summary of survey results from engineers in the telecommunications field in Spain. It includes various statistical data presented in tables and graphs, including percentages of engineers who are self-employed or work in different types of companies, average ages and experience levels of engineers in different regions and industries, and responses to questions about professional responsibilities and opinions. The document is divided into multiple chapters analyzing the survey results from different angles.
The document appears to be an annual report that provides financial and operational data for a gold mining company over multiple years. It includes statistics on production volumes, revenue, costs, assets, investments, and performance across different mining sites. Key figures presented include total revenue, assets, production volumes, costs, profits, and performance metrics for different periods.
Banco ABC - 3rd Quarter 2008 Results PresentationBanco ABC Brasil
This 3 sentence summary provides the key highlights from the 3Q08 Earnings Presentation:
The presentation discusses Banco ABC Brasil's 3Q08 financial results, noting that net income grew 11.5% over 2Q08 to R$48.4 million, the efficiency ratio was 35.8%, and the credit portfolio reached R$6,879.1 million, growing 5.9% over 2Q08. Return on equity was a strong 16.9% for the quarter.
Localiza reported strong financial results for the first quarter of 2007, with net income increasing 53.4% compared to the first quarter of 2006. EBITDA from car rentals increased 14.9 million or 30% due to growth in revenue and margins. Overall market share increased to 20.5% as Localiza grew revenues at a rate 2.9 times faster than the overall car rental market between 2004-2006. Cash generation was robust at R$228.5 million after adjusting for a reduction in debt from automakers. Fleet size continued to grow significantly with a net investment of R$242 million and over 10,000 additional cars.
The document shows charts tracking the growth of e-commerce sales in China from 1997 to 2009, with sales increasing from 1.2 billion RMB in 1997 to over 9,000 billion RMB in 2009. A second chart shows the transaction value of China's B2C e-commerce growing from 1.52 billion RMB in 2006 to 2.46 billion RMB in 2010. A third chart breaks down China's e-commerce market by business model in 2010, with B2B accounting for 32% and B2C making up 47.5%.
The document summarizes substance use reported by students in Kent County, Maryland and compares it to statewide averages. It shows that in many cases, a higher percentage of Kent County students reported using substances like cigarettes, alcohol, and illicit drugs in the past 30 days compared to the state average, with some differences being quite large. Trend data for 6th graders shows that reported use of cigarettes, marijuana, alcohol and binge drinking has generally decreased in both Kent County and statewide over time.
Intel reported financial results for 2008 with revenue of $37.6 billion, down 2% from 2007. Net income was $5.3 billion, down 24% from the prior year. Intel generated $10.9 billion in cash from operations and paid $3.1 billion in dividends. Paul Otellini, Intel's President and CEO, stated that Intel's product portfolio and technology roadmap are strong and will help the company thrive when the economy recovers. Craig Barrett, Intel's Chairman, discussed Intel's role in global initiatives that apply technology to address challenges in areas such as healthcare, education, and sustainability.
This document provides a table estimating the taxable equivalent yields of tax-free bonds for different federal tax brackets in 2012. It shows the yield a fully taxable bond would need to provide to equal the after-tax income of a tax-free bond. Tax brackets range from 15% to 35% for single and joint filers. Yields of tax-free bonds from 1% to 6% are shown along with their equivalent taxable yields for each bracket. It notes that local taxes and AMT are not factored into the estimates.
El documento proporciona un resumen de las cuentas de ahorro de una persona para el mes de mayo de 2010. Comenzó el mes con un saldo total de 7753 euros distribuidos entre una libreta de ahorros, cuenta bancaria y efectivo. Durante el mes realizó varios gastos como compras en el supermercado, pagos de la universidad, alquiler y suministros. Al final del mes le quedaban 1560 euros por gastar, que representaba el 46.3% del total. También incluye los sueldos de Ana y Celia y otros ing
El documento resume el consumo eléctrico semanal de diferentes aparatos agrupados en tres categorías: alumbrado, servicios y electrónica. El alumbrado consume 2250 w.h a la semana, los servicios 14400 w.h y la electrónica 211700 w.h, para un consumo total semanal de 228350 w.h.
El resumen compara los datos de dos grupos, el grupo de control y el grupo experimental. El grupo experimental tiene un promedio mayor (5.56 vs 4.89) y una desviación típica menor (1.77 vs 1.66), lo que indica que los resultados del grupo experimental fueron más consistentes y superiores en promedio.
Este documento presenta un estudio estadístico sobre las carreteras en España en 2004, dividiéndolas por comunidades autónomas y categorías. Muestra gráficas sobre la distribución de autopistas de peaje, autopistas y autovías libres frente a doble calzada, calzada única, y finalmente una comparación total. Cataluña, Comunidad Valenciana y Galicia tienen el mayor número de autopistas de peaje, mientras que Castilla-La Mancha tiene muchas más autopistas y autovías libres que de doble calz
Este documento presenta datos sobre la infraestructura vial de España en 2004, incluyendo kilómetros de autopistas, autovías, calzadas únicas y doble calzada por comunidad autónoma. Muestra que Cataluña tenía la mayor cantidad de autopistas y autovías, mientras que Andalucía tenía la mayor extensión de calzada única. Finalmente, presenta gráficos comparativos de la infraestructura entre las diferentes comunidades.
Este documento presenta estadísticas sobre las bibliotecas en España en 2004, dividiéndolas por comunidad autónoma. Muestra que la mayoría de comunidades tienen una biblioteca central, mientras que algunas como Canarias y Baleares no. Andalucía tiene la mayor cantidad de bibliotecas públicas con 645, mientras que Melilla solo tiene 1. En general, hay más instituciones especializadas que de enseñanza superior, con Cataluña teniendo 340 de las primeras y solo 70 de las segundas. Globalmente, hay más bibliotecas públicas
Este documento presenta estadísticas sobre bibliotecas públicas y centros de enseñanza superior e instituciones especializadas en las diferentes Comunidades Autónomas de España en 2004. Muestra el número de bibliotecas públicas, centros de enseñanza superior e instituciones especializadas por cada Comunidad Autónoma, así como gráficos comparativos.
El documento presenta datos sobre las audiencias de diferentes canales de televisión en España en los meses de enero, febrero y marzo de 2011. En enero, el canal con mayor audiencia fue Telecinco con un 15.2%, seguido por Antena 3 con 12.2% y Cuatro con 8.3%. En febrero, el orden fue similar con Telecinco liderando con un 15.4%, Antena 3 con 11.3% y Cuatro con 6.5%. En marzo, los canales con mayores audiencias variaron entre un 14.9% y un 11.4
Este documento presenta una tabla con los números atómicos, las masas atómicas y las abundancias relativas de varios elementos químicos. La tabla incluye el elemento, el número atómico, la masa atómica y la abundancia relativa expresada como un número de 0 a 300. Un gráfico de barras muestra las abundancias relativas de los elementos en la tabla.
El documento explica cómo sumar números romanos. Muestra los símbolos romanos y sus valores correspondientes de 1000 a 1. Luego da un ejemplo de suma, M + M + C, cuyo número final es 2150.
El documento proporciona información sobre las propiedades de varios materiales como aceros, aleaciones y metales. Incluye datos como densidad, elasticidad, resistencia a la fluencia y rotura, ductilidad, coeficiente de Poisson, conductividad térmica y coeficiente de dilatación térmica para cada material. Los materiales están organizados en tablas por tipo (ferroso o no ferroso).
This document tracks an individual's weight and body mass index over 50 days from March 17 to May 6, 2011. It records their starting weight of 71kg and height of 1.72m. Over this period it shows fluctuations in their weight from a low of 67kg to a high of 82kg, with an overall weight loss of 4kg. It also includes their daily weight changes in kg and weekly weight changes in grams.
El documento presenta los parámetros antropométricos, incluyendo la talla, peso, pliegue cutáneo y perímetro braquial, de estudiantes entre 4 y 14 años en Ubrique, Cádiz. Se muestran los valores promedio de cada parámetro por edad y sexo, así como el número total de estudiantes evaluados. Los resultados indican que la talla y peso promedio aumentan con la edad de forma consistente entre niños y niñas.
El documento presenta datos antropométricos como la talla, peso, pliegues cutáneos y perímetro braquial de niños y niñas de 4 a 14 años. Los datos están divididos por edad y sexo, y también se presentan los resultados totales por edad y el total general.
La entalpía estándar de formación (ΔHof) es la variación de entalpía asociada con la formación de una molécula a partir de sus elementos en sus estados estándar, a los cuales se les asigna una entalpía de cero. La ΔHof se mide en kJ/mol y se utiliza para calcular la variación neta de entalpía (ΔH) de una reacción química usando la ecuación ΔH=H(productos)-H(reactivos). El documento proporciona un ejemplo de cómo calcular
La entalpía estándar de formación de una sustancia es la variación de entalpía asociada con la formación de una molécula de la sustancia a partir de sus elementos en sus estados estándar, a los cuales se les asigna una entalpía de cero. Se mide en kJ/mol. Para calcular la entalpía estándar de una reacción, se restan las entalpías estándares de los reactivos de las entalpías estándares de los productos.
La entalpía estándar de formación es la variación de entalpía que se produce durante la formación de 1 mol de una sustancia a partir de sus elementos en su estado estándar de referencia a una temperatura y presión determinadas, generalmente 25°C y 1 atm.
Informe sobre lugares de asistencia sanitaria en españamaripepa1993
Este informe analiza los lugares de asistencia sanitaria públicos y privados en las diferentes comunidades autónomas de España. Se observa que Andalucía tiene la mayor cantidad de centros de salud públicos con 10, mientras que Navarra, el País Vasco y La Rioja tienen menos debido a su pequeño tamaño. En cuanto a hospitales públicos, Andalucía y Cataluña tienen el mayor número con 10 y 11 respectivamente, aunque Extremadura no tiene ninguno. Finalmente, los hospitales privados son menos comunes, con solo 5 en Andalucía,