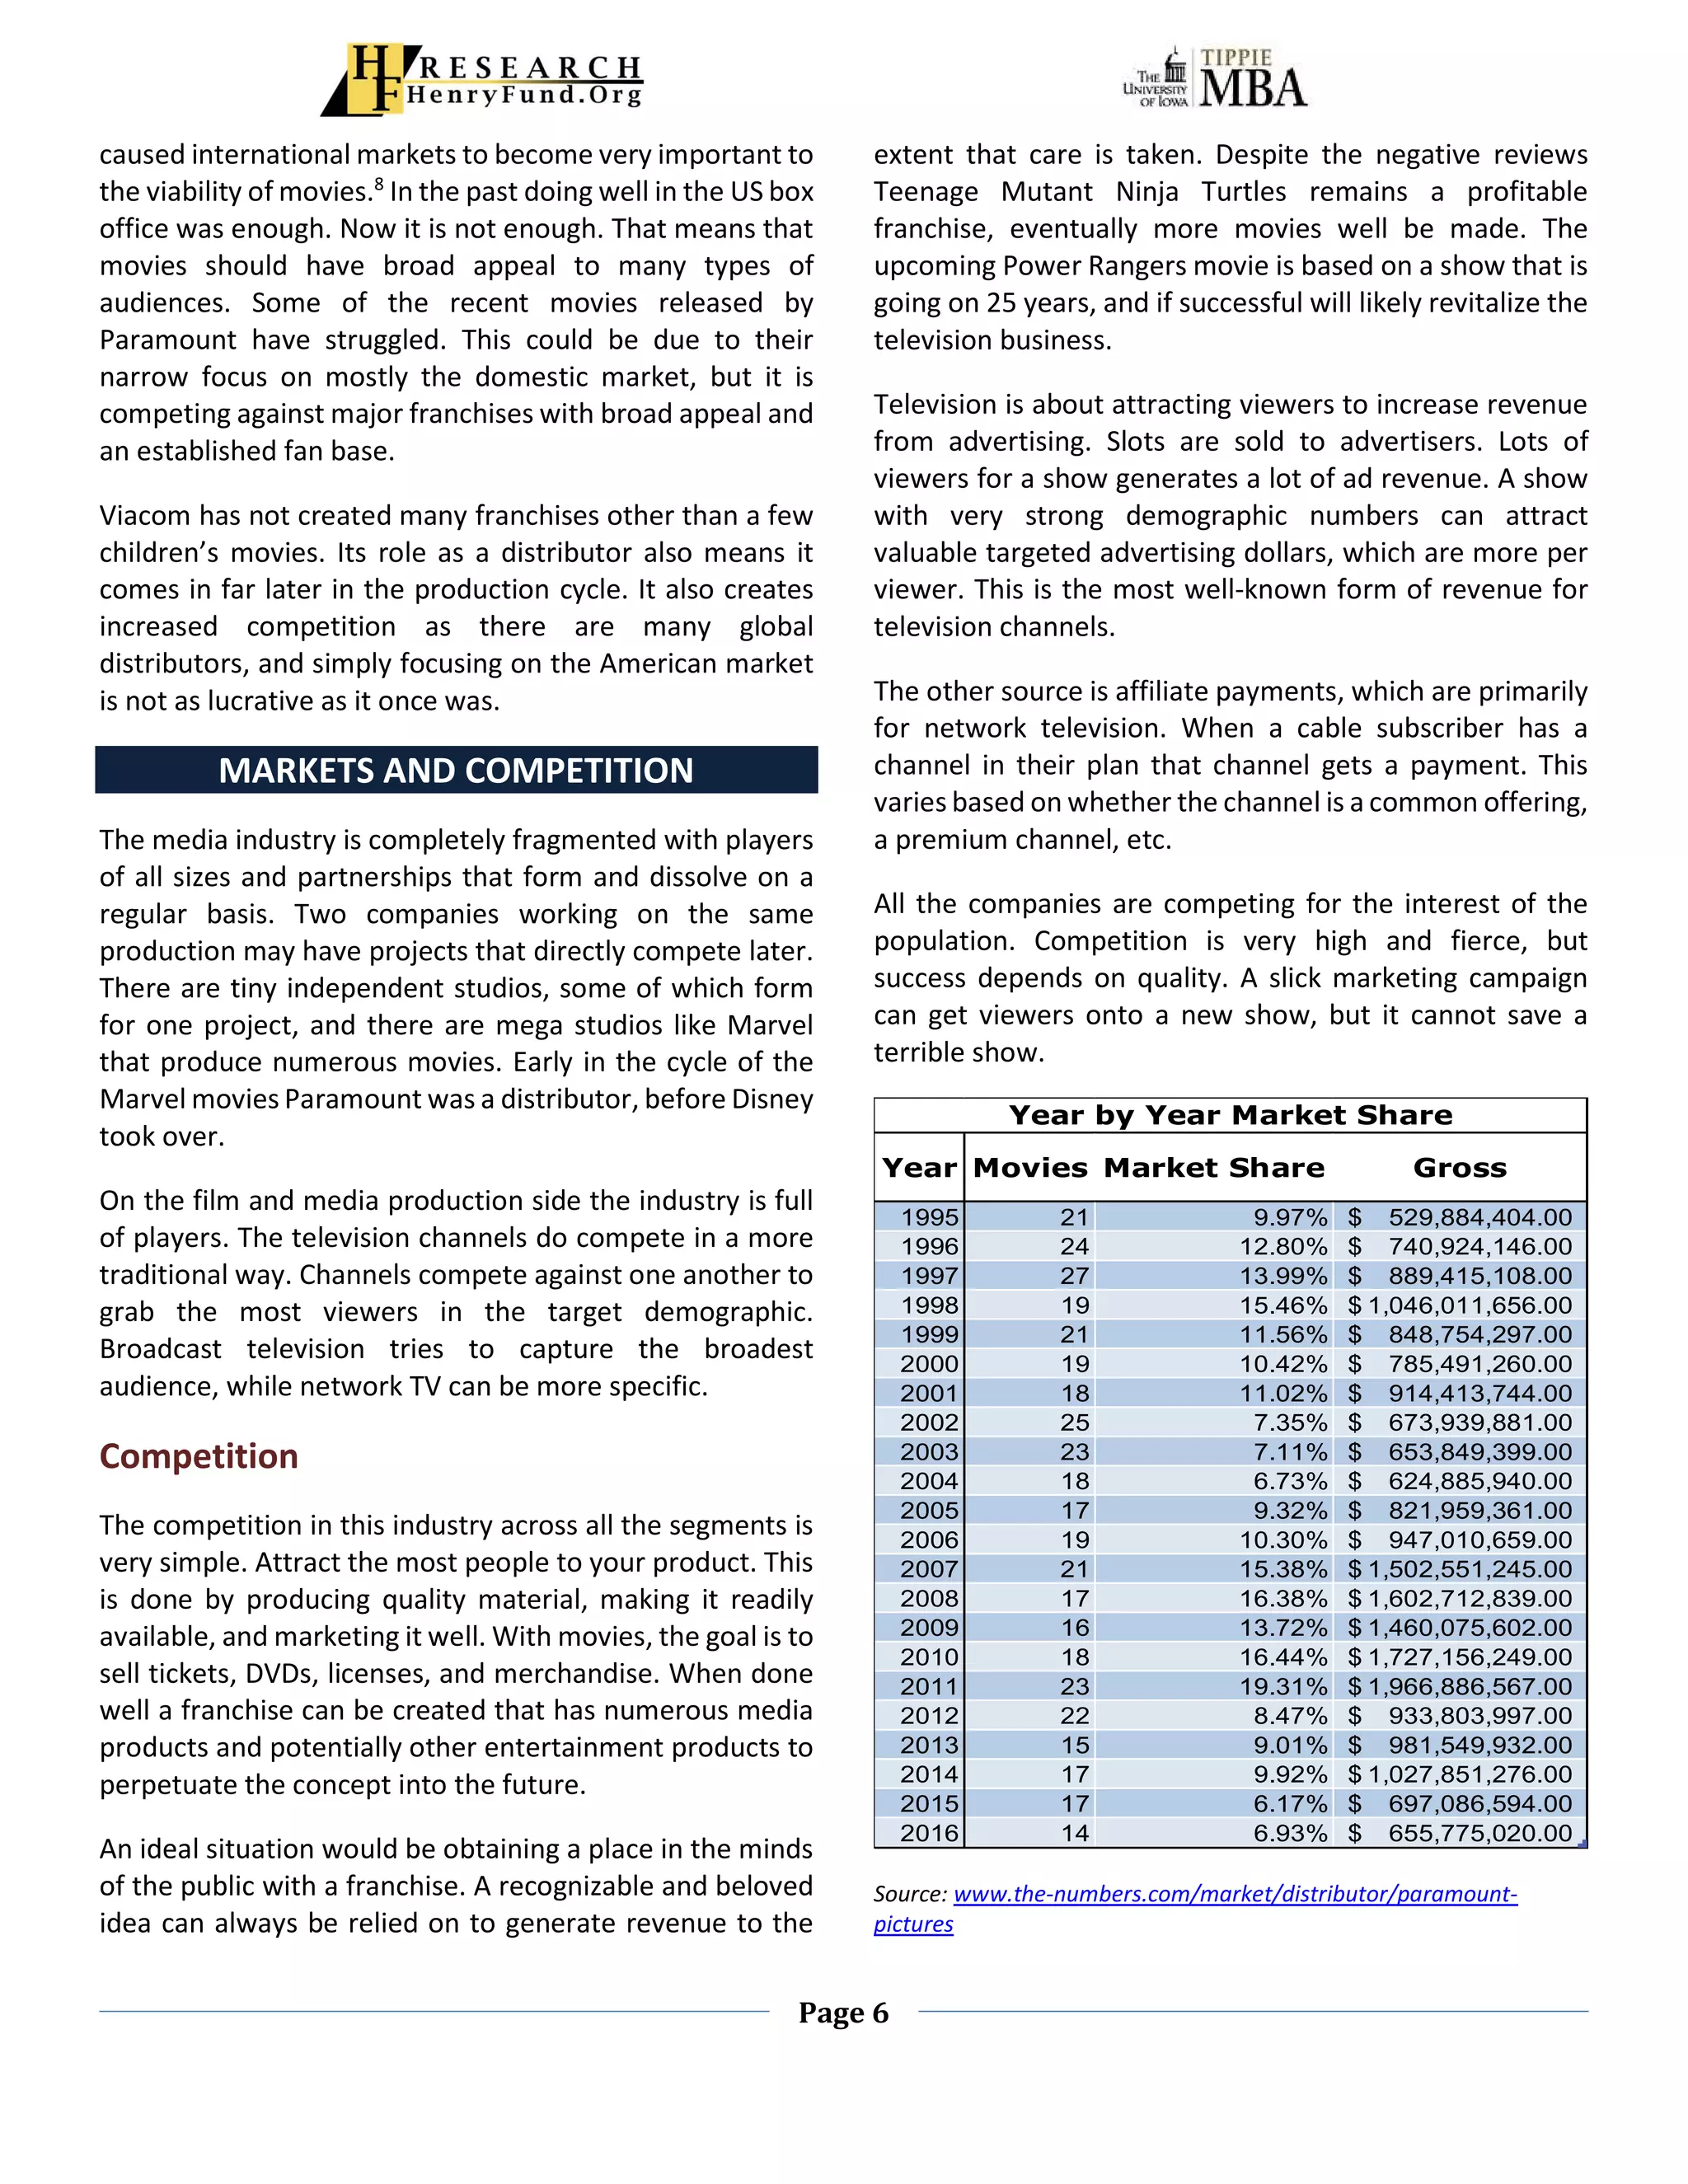
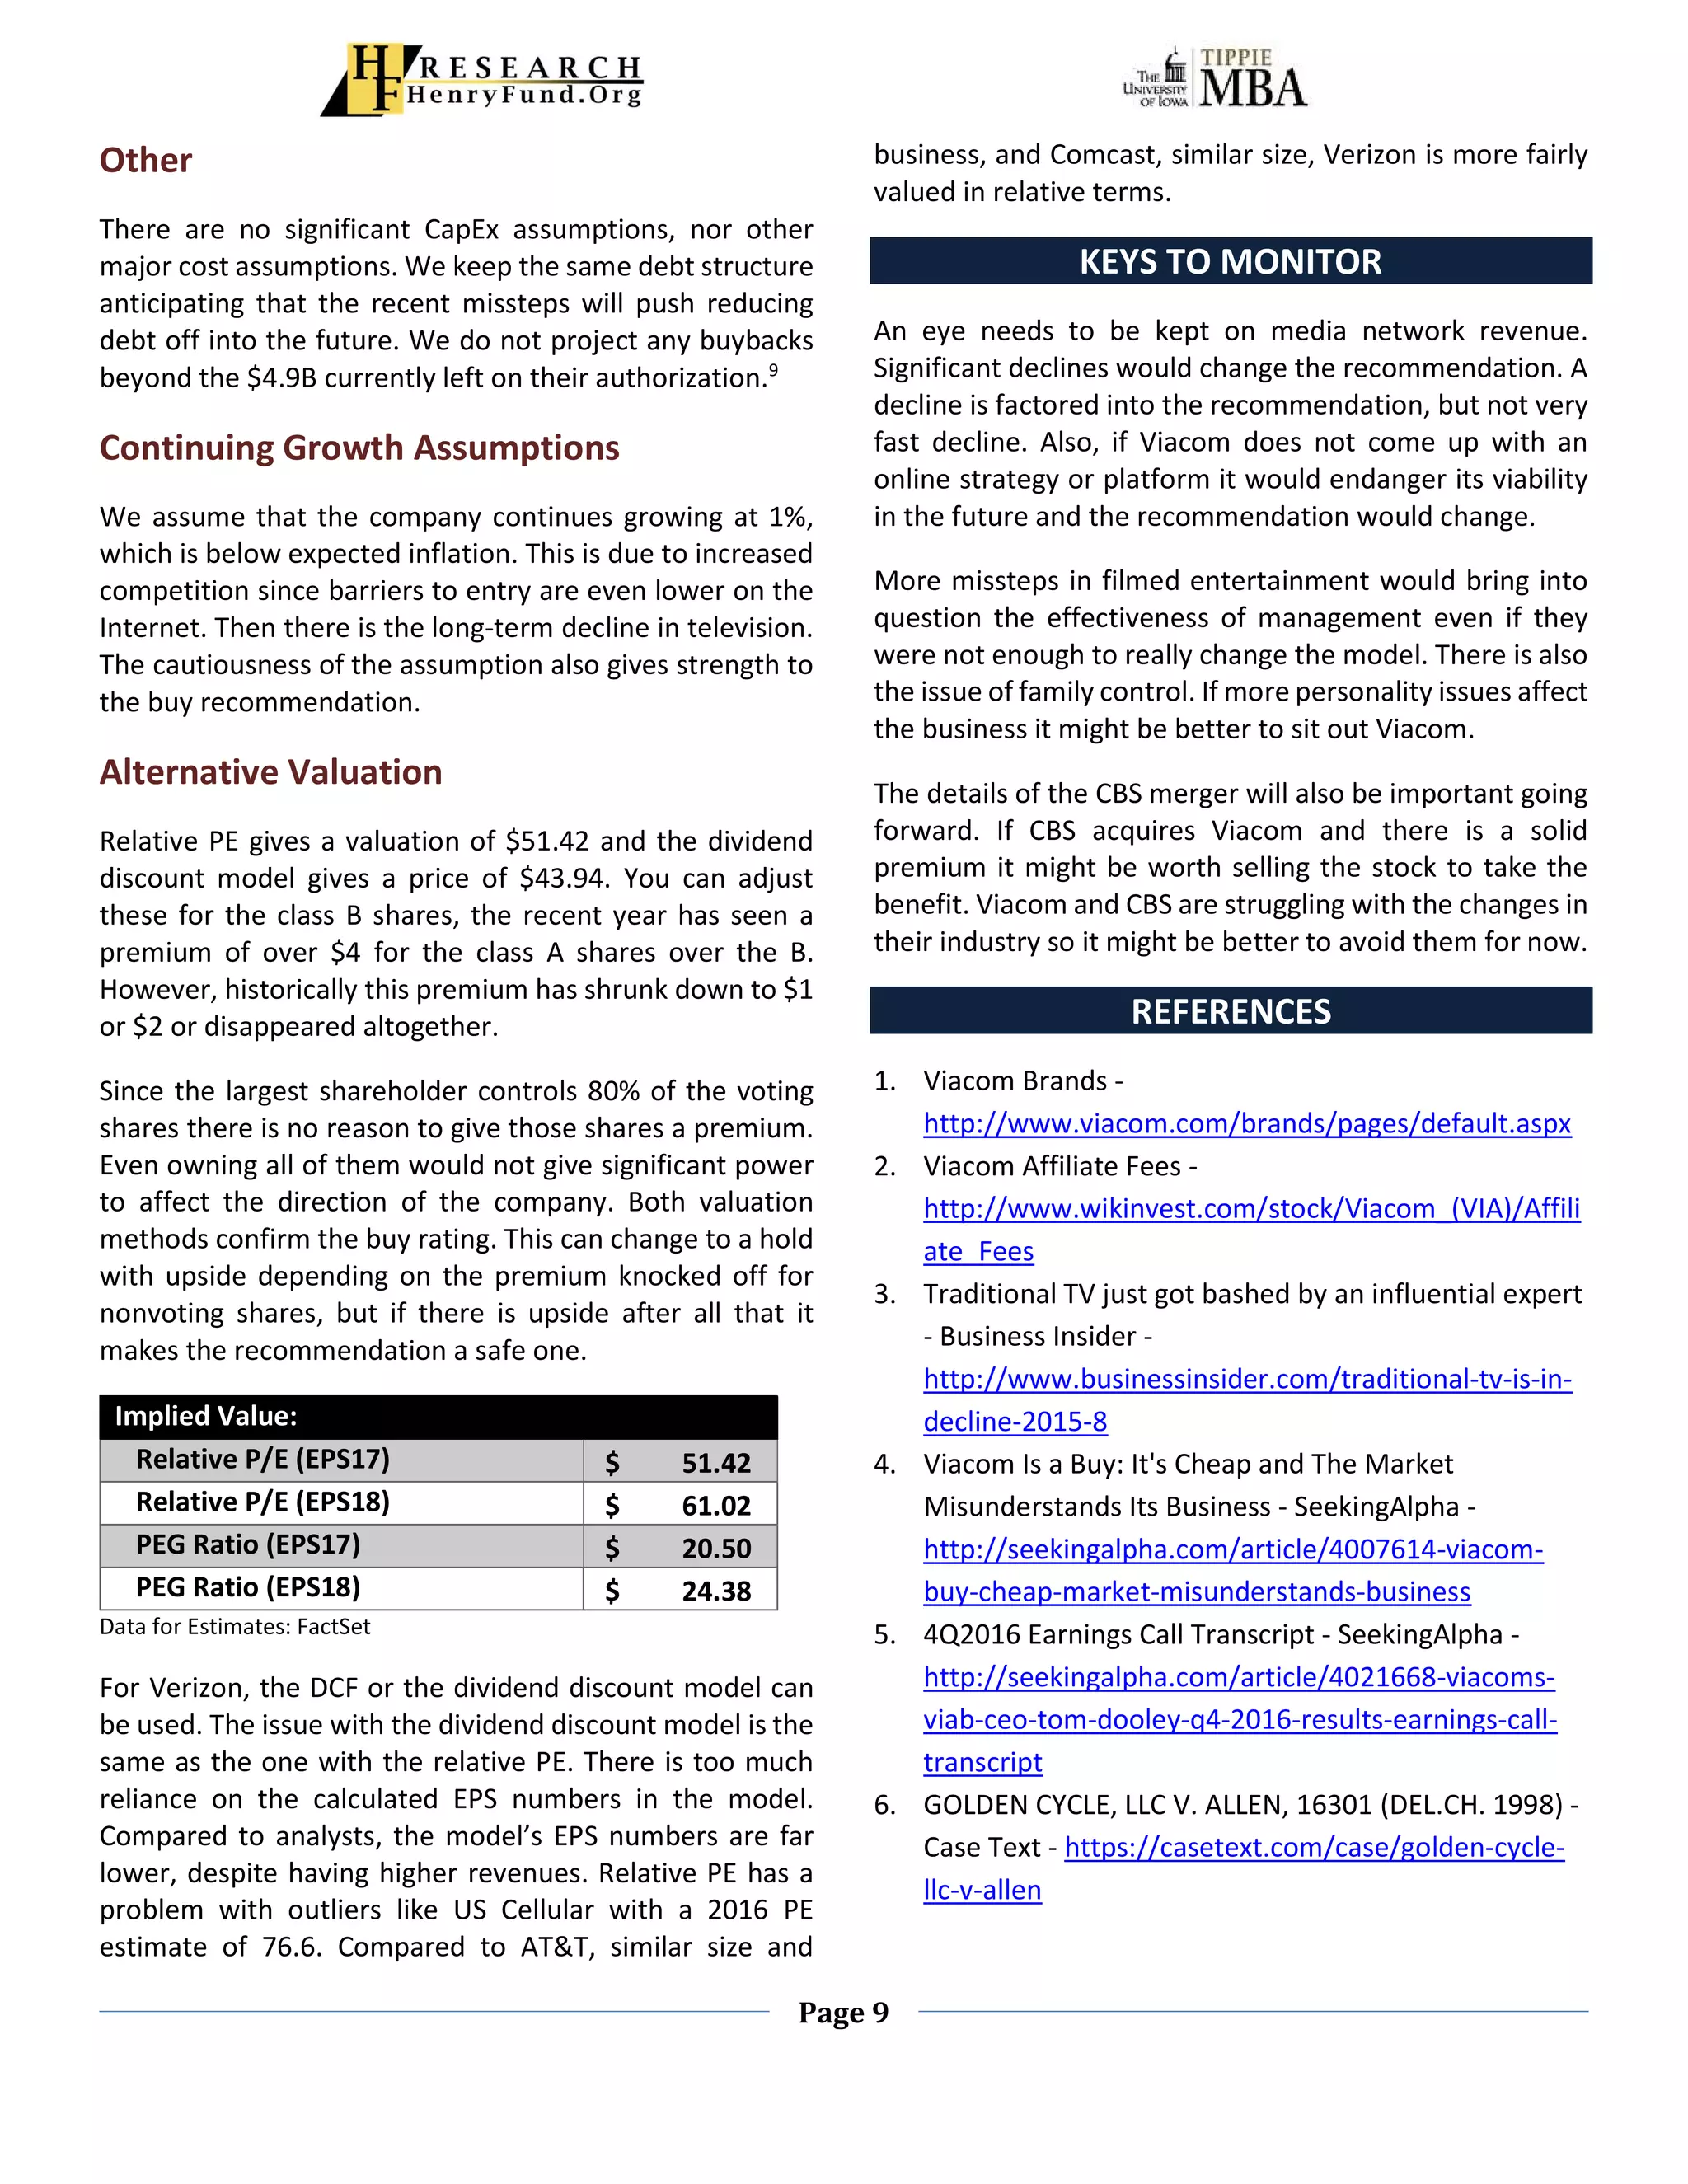
Viacom is a media and entertainment company facing challenges from the shift to online platforms and decline in traditional television. The company operates media networks like MTV and Nickelodeon and produces films through Paramount. Recent issues include a messy CEO change, weak film performances, and control of the company by one family through dual share classes. However, the stock price decline seems overdone given the company's large content library and plans to better integrate its film and television businesses. A potential merger with CBS could also create a stronger combined company. The analysis values Viacom at $52 per share based on conservative assumptions, indicating it is undervalued at its current price of $37.77.
Viacom reported financial results for the second quarter of 2005, with revenues increasing 10% to $5.9 billion led by growth across business segments. Operating income rose 4% to $1.4 billion, paced by increases at Cable Networks and Outdoor. Net earnings from continuing operations increased 6% to $762 million. The company is on track to deliver mid-single digit growth in revenues and operating income, and high-single digit growth in earnings per share for 2005.
CSULB SMIF CFA Research Challenge Report 2016Henry Tep
Lions Gate Entertainment Corp. is recommended as a buy based on a target price of $32.26. The company operates in the motion picture and television production industries, with its business focused on content creation. While its film segment has struggled, its television segment has grown strongly. Risks include unpredictable consumer tastes. The company aims to diversify its content library, make disciplined production decisions, and form partnerships. Its largest shareholders are senior management and investment firms.
The Fashion Channel (TFC) was a successful cable TV network dedicated solely to fashion. However, competitors were now adding fashion programming, prompting TFC's VP of Marketing Dana Wheeler to develop a new segmentation and positioning strategy. Wheeler commissioned research identifying four audience clusters: Fashionistas, Planners & Shoppers, Situationalists, and Basics. Wheeler was considering three options - maintaining broad appeal, focusing on Fashionistas, or targeting Fashionistas and Shoppers/Planners. Each option had different projected ratings, advertising costs per thousand (CPM), and additional programming costs. Wheeler needed to show how her recommendation would increase revenue and quantify risks.
Winterberry Group Dmcny Outlook 2010 Final (2)Ann Honomichl
This document summarizes Bruce Biegel's presentation on marketing trends in 2010. It discusses how (1) marketing budgets fell significantly in 2009 but are expected to rise modestly in 2010 as the economy recovers, (2) digital marketing will continue growing while traditional channels decline, and (3) direct mail volumes may stabilize but suppliers will need to focus on integration and analytics.
AOL Time Warner Merger Case Study Strategic Analysis, performing a SWOT, discussing the Culture of both firm's using Henry Mintzberg's Model, and evaluating the strategy.
news corp 1st Qtr - FY09 - September 30, 2008 - US Dollarsfinance9
News Corporation reported operating income of $953 million for the quarter ended September 30, 2008, a 9% decline from the previous year, due to decreases in several segments including filmed entertainment, television, and book publishing. However, cable network programming and Sky Italia saw double-digit percentage profit increases. Chairman Rupert Murdoch stated he was pleased with the performance of cable networks and Sky Italia and was confident the company could manage through difficult economic times due to its diversified assets and strong balance sheet.
This document discusses using ITV (a British commercial television network) for corporate advertising and promoting social responsibility. It provides examples of companies like Accenture and BASF that have used ITV advertising successfully. ITV is highlighted as reaching a large audience of influential viewers weekly and having longer viewing sessions than other channels. Campaign coverage examples for ABC1 adults show potential millions reached and costs in the hundreds of thousands of pounds. Benefits of ITV mentioned include large commercial TV audiences, research support, and multimedia extensions of ads.
Time Warner Cable Strategy written reportDavid Green
Time Warner Cable aims to become the premier provider of internet, phone, and television services through innovation and enhancing the customer experience. Its strategic plan over the next 5 years includes increasing market share by 10-15% and customer satisfaction through new programming content and service packages. Financially, it aims to increase revenue 20-25% and profit margins 1-3% over the next 3-5 years. Time Warner will pursue this vision through an offensive generic strategy of adopting competitors' services like mobile pay-per-view and sports streaming apps to gain new customers and market share.
Viacom reported record third quarter 2002 results with revenues increasing 10% to $6.3 billion and operating income increasing to $1.3 billion compared to $194 million in the third quarter of 2001. Every business segment saw higher revenues and operating income led by strong advertising growth of 14% overall. Net earnings were $640 million or $.36 per share compared to a net loss of $.11 per share in the third quarter of 2001. Excluding certain one-time items from 2001, operating income grew 18% and earnings per share grew 17% reflecting strong performance across all of Viacom's business segments.
This document provides an overview of the principles of valuation for mergers and acquisitions. It discusses key terms like mergers, acquisitions, and types of M&A deals. It also outlines common motives for M&A like strategic gains, financial benefits, and managerial motives. The mechanics of an M&A deal including antitrust laws and accounting treatment are summarized. The document uses the AOL-Time Warner merger as a case study, outlining the motives and valuation of the two companies at the time of the announced deal.
Time Warner Cable Industry/Competitive AnalysisDavid Green
The document provides a PEST analysis, ETOP analysis, and market share analysis for the broadcasting and cable television industry. The PEST analysis examines political, economic, social and technological factors impacting the industry. The ETOP analysis evaluates factors related to the industry environment including market size/growth, number of rivals, differentiation, supply/demand conditions, and pace of technological change. The market share analysis shows Comcast and Time Warner Cable have the largest shares in the US market at 28% and 15% respectively, while DirecTV and Dish Network also have sizable shares. Programming costs are a major expense for industry players, accounting for over 50% of costs for some companies. The industry outlook predicts continued growth in the US,
The document discusses GoFish, a youth entertainment network that combines advertising, media, and video content. It summarizes GoFish's business model, growth opportunities in the youth market, progress to date including revenue growth, and compares it to other companies. Key details include GoFish reaching 18.2 million unique users, 580 million page views, and $1.5 million in quarterly revenue after starting with no sales team.
The document provides an overview of recent developments in television and broadcasting:
1) Television is evolving from delivery-focused to content-focused, with different platforms and on-demand access blurring traditional lines. This has created a more level playing field for various providers.
2) Television network brands that provide popular shows and programming are seen as maintaining more control and consumer loyalty compared to cable and satellite providers.
3) Over-the-top (OTT) linear television delivery of scheduled programming via streaming is growing, with various models emerging such as direct-to-consumer, white label, and partnerships with multi-channel video providers.
4) New OTT providers like Sling TV are targeting "
1) America Online (AOL) launched its first online service in 1985 and grew to become one of the largest internet service providers before merging with Time Warner in 2000 in a $165 billion deal.
2) The AOL-Time Warner merger struggled to meet growth targets and underwent leadership and strategy changes before Time Warner dropped the AOL name in 2003.
3) In 2009, AOL was spun off as an independent company again and acquired properties like The Huffington Post and TechCrunch to diversify before being acquired by Verizon for $4.4 billion in 2015 to expand their mobile and online content offerings.
How did brand-led newspaper and online newspaper ads coupled with TV positively drive web traffic and active consideration for the credit card provider?
Verizon FIOS is launching a marketing campaign to persuade customers of other cable and internet providers to switch to FIOS. The campaign will have three phases focused on awareness, engagement, and consideration. The first phase uses the message "break up with your current provider" through OOH, TV, and digital ads depicting unsatisfying relationships. The second phase aims to engage prospects by showcasing FIOS benefits through print, OOH including an interactive mood board, social media, and event sponsorships. The third phase encourages consideration through in-store marketing. The goal is to increase awareness, engagement, and get prospects to actively consider FIOS.
Net income and EPS for Disney increased in the first quarter of 2001 compared to the previous year. Net income rose 27% to $594 million and EPS grew 22% to $0.28, excluding accounting changes and the Internet Group. Overall revenues for Disney grew 7% to $7.3 billion for the quarter, with strong results from Parks & Resorts and improvements in home video and theatrical distribution offsetting declines in consumer products. The Walt Disney Company will convert shares of Internet Group stock to Disney stock in March 2001, consolidating financial reporting under one class of common stock.
Time Warner are a global leader in media and entertainment with businesses in television networks and films and TV entertainment, uses its industry-leading operating scale and brands to create, package and deliver high quality content worldwide on a multi-platform basis.
MVMNT Media, LLC is comprised of three Over-The-Top (OTT), Advertising Video-On-Demand (AVOD) streaming TV channels; MVMNT TV (at launch stage), Monfasports TV and Cinemeo (both in developmental stage), with each brand also comprising of a LINEAR channel. The focus of this prospectus is the AVOD and the LINEAR channel of MVMNT TV. Currently the streaming OTT market growth is driven by Subscription Video-On-Demand (SVOD) and hybrids like Hulu and CBS All Access.
Subscription video on-demand (SVOD) market challengers like Disney+, AT&T’s HBO Max and NBC/Universal have prepared their own streaming app launches over the next weeks and months. Free channels are preparing their own challenge for market share with launches of free channels with content like Tubi TV and PopTV. These channels appeal to potential viewers who aren’t interested in paying a monthly or yearly streaming subscription. These platforms offer free content and generate revenue by serving targeted advertisements (Programmatic Advertising) during commercial breaks. With 157,000 regular viewers, Pop TV generated $68M in ad revenue for 2018. Some of the revenue was from product placement and ad integration.
The MVMNT TV AVOD channel is available and free to download on 80 million TV’s, tablets and devices: Android, iOS and Apple TV, Amazon Fire TV, Chromecast and Roku.
MVMNT TV’s linear channel Is delivered via Virtual Multichannel Video Programming Distributor (vMVPD); also referred to as streaming TV services, vMVPDs aggregate live and on-demand TV and deliver the content over the internet linearly. vMVPD services resemble the similar layout of cable packages allowing users to browse a guide or flip through channels that stream programming 24 hours a day. These services are often used by recent cord-cutters who want to keep select channels from their cable packages but at a lower price.
vMVPD services include Sling TV, Hulu Live TV, YouTube TV, DirecTV Now, fuboTV, PlayStation Vue, Viacom’s Pluto TV and Xumo. According to Rich Greenfield of BTIG, paid vMVPD subscribers hit a high of 7.7 million last year. This is expected to grow: vMVPDs gained a combined 2.1 million subscribers over the first nine months of 2018, according to a recent Conviva study, which correlated the loss of 2.8 million subscribers for cable and satellite during the same time period.
Viacom reported first quarter 2002 results, with revenues of $5.67 billion and EBITDA of $1.09 billion, led by growth in its Cable Networks and Video segments. Free cash flow increased 9% to $380 million. The company expects higher advertising revenues and double-digit growth in EBITDA and EPS for full year 2002 compared to 2001. Cable Networks EBITDA rose 12% on higher affiliate fees and DBS revenues, while Video EBITDA increased 9% due to higher margin DVD rentals.
The document summarizes key points about the broadcasting industry. It finds that retransmission consent fees paid by cable companies to broadcasters, currently around $1 per subscriber per month, are expected to steadily increase to around $2 per subscriber in the next 4-5 years. This will provide the broadcasting industry with an additional $4 billion in revenue over this period. Consolidation in the industry is being driven by the desire for scale to gain negotiating leverage with cable companies over fees. Local broadcasters may also be able to monetize their spectrum if the FCC commences an incentive auction in 2015 as anticipated.
The document discusses improving targeting and measurement for television advertising. It argues that current television targeting is inefficient by reaching many people who are not likely customers. It advocates using detailed customer data and set-top box data to precisely target television ads. This targeted approach is said to increase campaign performance by at least 25% while reducing wasted impressions. The document also notes that accurately measuring the impact of television advertising on other channels like web and retail is currently complex, but that the company uses television spending to reliably predict multi-channel sales within 5% accuracy weeks in advance.
Talk Talk is a UK telecommunications provider that offers broadband and telecom services. It has a 14% market share but faces significant competition from larger rivals like BT, Sky and Virgin Media who control over 75% of the market. Talk Talk relies on renting infrastructure from BT and does not own its own network, making it vulnerable to price wars. A recent cyber attack cost the company £35 million and damaged its reputation. For growth, Talk Talk may look to acquire other companies, expand its broadband infrastructure, and grow its corporate customer base, but faces risks from regulation, new entrants, and potential future cyber attacks.
The document summarizes the results of several studies that analyzed the impact of online advertising when used in conjunction with other traditional media channels like television, print, radio and outdoor advertising. Some key findings from the studies include:
1) Using online advertising together with television and print for a Dove campaign resulted in lifts of 9.1-46.7% for brand awareness, ad awareness and purchase intent.
2) Adding online to a Canadian Tire campaign with radio led to lifts of 5.8-16.7% for ad awareness, brand favorability and purchase intent.
3) A GM campaign combining online with magazine ads saw lifts of 8-30% for brand awareness and ad awareness, particularly
Quarterly Statistics on Media, Mobile, Social Media and AdvertisingEM3
The document provides a summary of marketing data and trends from various sources. Some key findings include:
- Online news audiences grew 17% in 2010 while other platforms declined, and online ad revenues are projected to surpass print newspapers for the first time.
- Television spending saw the best growth of major media at 10.3% in 2010. Radio spending was also up 7.6% led by national spot radio. Newspaper spending declined 3.5%.
- 23% of Americans said they would pay $5 per month for online access to their local newspaper. The top print media brands also lead in online traffic.
- A survey found B2B and B2C marketers now rely
Coady Diemar Partners provides M&A, strategic and financial advisory services and private capital market advisory services to clients. We are a valued partner to management teams, boards of directors and investor groups who seek high-quality, objective M&A and financial advice and institutional capital raising expertise in support of building successful enterprises.
This document provides guidance on proofreading written work by identifying common errors and how to check for them. It discusses checking for consistent verb forms, maintaining consistency in bullet point lists, ensuring personal pronouns and possessives agree with their nouns, being careful with irregular plural nouns, and allowing time between drafts to thoroughly check one's work. Key areas to check include verb forms, list consistency, pronoun and possessive agreement, irregular plurals, and utilizing spell check. Taking care with these areas can help improve the quality of one's writing.
This document discusses credit reforms and the evolution of credit systems. It defines credit as goods and services provided before payment based on trust of future repayment. Reforms are changes made to improve existing systems. Originally, barter systems were used for payment, but credit reforms introduced newer electronic payment methods like credit cards, online payments, and mobile payments. Credit availability has increased over time, especially in urban and metropolitan areas. Reforms aimed to increase purchasing power, provide advanced payments, offer convenient payment options, and protect buyers and sellers. However, overuse of credit can lead to overspending, poor financial habits, high costs, and weak credit scores. New credit reforms introduced various digital payment methods and increased India's GDP.
THE INFLUENCE OF MICROSTRUCTURE IN THE HOMOGENEITY OF HARDNESS STANDARD BLOCKSTito Livio M. Cardoso
1. The document examines the influence of microstructural homogeneity on the uniformity of hardness values in hardness standard blocks.
2. Analysis of a certified 109 HB hardness standard found heterogeneous grain sizes and distributions, with some areas having much larger crystals than others.
3. Hardness measurements within coarse-grained areas showed values of 101 HB, significantly lower than the 108 HB measured in fine-grained areas. Excluding the outlier, the average was 108.5 HB, within specification.
4. The results demonstrate that microstructural heterogeneity can influence both the uniformity and magnitude of hardness values, which is particularly critical for certified reference materials like hardness standard blocks.
Este documento describe un plan para contribuir a la construcción de la identidad cultural local de los estudiantes del tercer grado de la Institución Educativa Miguel Grau de Paramonga a través de tres objetivos: 1) reafirmar la identidad cultural con una educación en valores y respeto a los derechos humanos, 2) revalorizar la identidad del distrito y la provincia de Barranca, y 3) implementar estrategias y técnicas de producción de textos que motiven a los estudiantes. El plan incluye varias estrategias como el uso de software lib
Este fascículo proporciona orientaciones para que los directores de instituciones educativas ejerzan un liderazgo pedagógico que permita mejorar los aprendizajes de los estudiantes. Un líder pedagógico es aquel que conoce, comunica, convence y construye un sentido de propósito común para motivar a los docentes y mejorar las condiciones de trabajo en la escuela. El fascículo describe las características de un director con liderazgo pedagógico, los roles que debe asumir, y las estrategias y her
El documento describe las principales aplicaciones del correo electrónico como recurso didáctico en la educación. Explica que el correo electrónico permite el intercambio de información entre usuarios y la transmisión de archivos de todo tipo, ampliando el entorno de aprendizaje más allá del aula. También menciona que el correo electrónico puede utilizarse para enviar tareas, exámenes y facilitar el trabajo colaborativo entre estudiantes.
O Mercado Brasileiro de Fornecedores de Insertos de Corte IntercambiáveisTito Livio M. Cardoso
Este documento fornece um resumo do mercado brasileiro de fornecedores de insertos intercambiáveis para usinagem. Apresenta informações sobre as principais tecnologias de insertos, fabricantes mundiais, pesquisa e desenvolvimento no Brasil, propriedade intelectual, importação de tecnologia e situação atual do mercado nacional.
O documento fornece informações sobre os produtos e serviços da empresa Lab245. Em particular, descreve três produtos principais: Folder245ECM para armazenamento e recuperação de documentos; Folder245BPM para automação e otimização de processos; e Folder245BigData para análise de dados de clientes. O documento também lista alguns clientes atuais da empresa e convida o leitor a conversar sobre suas soluções.
Este documento describe la técnica de pirograbado, que data de la prehistoria y ha sido practicada por varias culturas a lo largo de la historia. Explica que el pirograbado implica quemar un diseño sobre una superficie como madera, papel o tela usando calor. También enumera diversos objetos en los que se puede aplicar esta técnica y resume los pasos para pirograbar un diseño sobre tela pana.
Setel LTD is an Italian company formed in 1997 that specializes in installing and maintaining wireless and wired telecommunications networks. It has over 150 employees and partners. Its core business includes installing and maintaining mobile networks, transport networks, and access networks for major telecom customers. Setel is expanding into new service areas like small cells and distributed antenna systems, drone services, structural diagnostics, smart cities/IoT, energy efficiency, integrated logistics, and transport services to remain innovative and meet evolving customer needs.
El documento proporciona información sobre la actividad TortugArte, un entorno de programación gráfico basado en el lenguaje Logo. Explica cómo ingresar a TortugArte y describe las diferentes áreas de trabajo, íconos y bloques de programación que permiten dar órdenes a una tortuga virtual para que dibuje figuras geométricas básicas como cuadrados, triángulos, círculos y hexágonos. También explica cómo guardar los proyectos y utilizar colores al dibujar. El objetivo es reforzar conoc
El documento describe cómo usar la mensajería instantánea Empathy en laptops para comunicarse y compartir archivos entre contactos conectados a la misma red inalámbrica. Explica los pasos para crear una cuenta en Empathy, ver la lista de contactos disponibles, iniciar una conversación, y enviar y recibir archivos entre dos usuarios.
Este documento lista numerosos recursos educativos disponibles en línea para profesores, incluyendo sitios web con miles de recursos clasificados por materia, comunidades para compartir innovaciones docentes, bancos de videos, sonidos e imágenes con licencia Creative Commons, y enlaces a recursos provistos por distintas comunidades autónomas españolas.
General information Viacom, Inc. is an American media .docxhanneloremccaffery
General information
Viacom, Inc. is an American media corporation that mainly deals with cinema and cable television. At the moment, market statistics place the company at sixth position in broadcasting and cable companies based on revenue (Stempel, 2012). The company history traces its operations in the 1950s when CBS Corporation (CBS) instituted a department that could handle the syndication of various television programs it offered. The current version of its business came into place in 2005 after breaking off from CBS Corp. It is now comprised of multiple networks such as Viacom Media Networks, Paramount Pictures, and BET Networks. By the help of this brands, the company can reach more than 700 million subscribers in more than 160 nations (Sweeney, 2008). The major stake control of the company is Sumner Redstone together with CBS via its National Amusements, Inc. Reporting of its operations and results is done by the help of two major operating divisions; Filmed Entertainment and Media Networks. The following unit comprises 73% of the company revenues in the fiscal year 2014, while the former fill the other part the balance by the various businesses such as theatrical, home theater, and television licensing (Fixmer, 2008).
Environmental analysis
Political
According to Rainey, (2016) together with the reviews from Glassdoor, (2010) it is evidence that Viacom is experiencing more of internal politics rather than politics from the state. Rainey, (2016) reports that management groups from various department rival due to downsizing activities by the top management. Also, there is the issue of firing the most experienced personnel to have other cheaper workforce options, that is, new staff, to ensure they pay less for compensation. The management fails to offers 'transferable skills' platform as it says due to political influence that tend to deny the workforce the needed support. Employees are therefore forced to learn from an unforgiving curve unless they are very skilled. The company needs to start giving some clear goals from the word go to its staff more so on-job training. The management should understand that the high turnover may be coming at the expense of a damaging work culture. Most importantly, they should communicate with its workforce whenever there is an abrupt staffing change that seeks to ensure they encourage stability in the company structure.
Technological
Being a media and entertainment company, Viacom has employed a vast number of technologies and modern ones to keep up with the completion. This technology has ensured that its media networks are reaching it's multi-million worldwide subscribers. Being the oldest film studio in America, it has tested various techniques for many centuries to create many of the most loved motion pictures and turn it into a major world producer and supplier of filmed entertainment.
By the help of television and digital media technologies, the company ...
This document provides an overview of Paramount Global's business segments and competitive landscape. It discusses Paramount's financial struggles, especially in its direct-to-consumer segment. The document indicates that Paramount Global's controlling shareholder is open to a potential merger or sale. Recent discussions have involved Skydance Media and Redbird Capital acquiring Paramount Global's parent company National Amusements.
1. Online video viewership has grown significantly over the past year, with unique video viewers up 11.5% and videos viewed up 63%. Males 18-34 watch the most online videos.
2. Online video advertising can provide stronger branding than traditional display ads, with lifts of 55% in awareness and 29% in message association.
3. As viewership grows, online video offers advertisers the ability to reach key demographics at scale and to measure campaigns more effectively than television.
State Of Online Video - TIMA presentationLouise_Gordon
Glen Caruso presented a very insightful and agnostic overview of what is happening with online video. This was our last Triangle Interactive Marketing Association topic for 2009.
Several major brands and CMOs are reducing or eliminating their television advertising spending. Best Buy cut its TV budget by 40% and redirected the funds to increase store staffing and improve its website. Red Robin also eliminated TV advertising from its 2009 media mix, citing the economy as a factor. Some marketers believe the downturn is prompting them to experiment with new marketing approaches beyond traditional television.
Viacom is a leading global media company with positions in television, radio, outdoor advertising and online. It has programming that appeals to all audiences. The document discusses Viacom's divisions and leadership. It also explains that Viacom plans to reengineer its finance department, which is the oldest department and in need of redesign, in order to better facilitate decision making across the business.
Creative Media BTEC- Unit 7 – The Media Sector (Television)Brandon Boyd
Lionsgate Entertainment is a public service media organization that generates income through its television revenue and diverse programming, including reality shows and entertainment shows. While Lionsgate's revenue decreased in 2007, by 2012 it had increased to over $1.59 billion. Lionsgate's organizational objectives include acquisitions to boost distribution and library content. It licenses its video distribution and owns a film library from acquired companies. Its main competitors are AMC Entertainment, Bona Film Group, DreamWorks Animation, and RLJ Entertainment.
mm2 Asia is a budding media entertainment company in Singapore that provides services to the Asian film industry. It generates revenue through film production and distribution. The company is looking to expand its footprint in Greater China and acquire other companies to become a more integrated media group. However, it faces a SGD17 million funding gap to support its ambitions. While the company has grown revenue significantly in recent years, it also faces risks from production delays, cost overruns from its shift to more asset-heavy businesses, and the ability to sustain its film production pipeline.
Pivotal Research: US TV Update April 2012Brian Crotty
Pivotal Research Group surveyed television advertising sellers and found consensus expectations of 0-5% volume growth for primetime advertising, equating to 8-10% price growth. While high prices are preferable for media owners, revenue impact is limited due to inventory management and mix-shifting. Digital bundles are common but online video remains small compared to traditional TV. Auto advertising is expected to rebound while technology and dot-com advertisers are growing, but retailers face challenges.
Korean Film & Broadcasting Content IndustryJeehyun Moon
The document discusses the increasing importance of "tentpole" projects in the film and broadcast content industries. Tentpoles are defined as hit titles that provide steady cash flow, such as blockbuster films or top-rated television programs. The success of tentpole projects can offset losses elsewhere and make earnings more predictable. Major companies in film distribution and broadcasting, such as Disney and CJ E&M, follow tentpole strategies. The report also predicts earnings growth for content companies in 2015 backed by the release of tentpole films and projects overseas.
Pivotal Research Group LLC: Madison and wall 3 30-12Brian Crotty
Madison & Wall
A Recurring Review of Topics Affecting Advertising-Supported Media
March 30, 2012
Welcome to Pivotal Research’s “Madison & Wall”. The title refers to our work which
sits at the intersection between the advertising industry and the financial world. We
hope you’ll find these brief notes useful for their contrast to the hyperbole that
pervades much of the chatter at that location.
The team performed valuation analyses on HBO to estimate its stand-alone enterprise value and equity value. Using discounted cash flow analysis, comparable companies analysis, and precedent transactions analysis, the team estimated HBO's enterprise value to be between $32,189.0 million and $38,630.5 million, and its equity value to be between $22,797.8 million and $29,239.3 million. The team based their final valuation conclusion solely on the discounted cash flow analysis results due to limitations in comparable the comparable companies and precedent transactions analyses for valuing the private company.
The document introduces TRIWAR Pictures, an independent film production company. It summarizes TRIWAR's business model of producing high-quality films and television shows on budgets between $1-10 million to maximize profits. The company aims to operate like a major studio but at a fraction of the cost through a non-union model. It expects to generate annual returns and revenue of $10-15 million within three years through various distribution channels.
Wall Street Mastermind Sector Spotlight - Media & Entertainment (September 2023)SamShiah1
Here are the contents of this month's Media & Entertainment Sector Spotlight:
1. Film/TV Sector Update
2. Disney Snapshot
3. Theatrical Update
4. Sports Sector Update
5. Gaming Sector UPdate
6. WWE & UFC Merger
This report discusses trends in the internet sector and provides recommendations on internet stocks. It finds that the largest internet platforms like Alphabet and Facebook are gaining share of the digital advertising market. It also notes that companies providing value-added services to small and medium businesses are seeing growth. Finally, it discusses trends in ecommerce, with Amazon and Alibaba expected to maintain dominant positions, and in online video, where original content is driving platform differentiation.
This document discusses options for YouTube marketing, including video marketing tips, tools, and sites. It provides tips for using video marketing such as including branding, URLs, catchy titles, excellent content, and links in descriptions and beyond YouTube. The document also discusses how digital disruption is impacting the television industry as viewership declines and moves online, and how this will change digital advertising and video creation/curation.
National CineMedia, the largest movie theater advertising company in the US, is thriving in 2009 while other media companies are struggling. Movie theater advertising appeals to advertisers because viewers are a captive audience and cannot skip or mute the ads. Movie theater advertising also reaches a younger demographic that is difficult for TV to access. With box office revenues and attendance up in 2009, movie theaters are delivering more impressions to advertisers than they paid for.
National CineMedia, the largest movie theater advertising company in the US, is thriving in 2009 while other media companies are struggling due to the recession. Movie theater advertising is an attractive option for companies because viewers cannot skip or mute the ads, and the large screens in theaters command attention. Theater advertising revenues are up this year due to higher than expected movie attendance and box office revenues. While television still draws large audiences, cinema advertising offers better recall of ads and engages viewers more effectively.
The document introduces Trio Entertainment, an independent film and television studio. It outlines the executive team, which includes experienced professionals from film, television, finance, and investment banking. It then describes Trio's business model of producing independent films and TV shows in order to build an owned library of intellectual property that will generate ongoing revenue from licensing, streaming, and sequels. The presentation highlights Trio's competitive advantages and revenue sources, and concludes by inviting accredited investors to participate in an offering of up to $3 million.
1. Important disclosures appear on the last page of this report.
The Henry Fund
Henry B. Tippie School of Management
Nihar Patel [nihar-patel@uiowa.edu]
Viacom Inc., Class B (VIAB) November 18, 2016
Consumer Discretionary – Media & Entertainment Stock Rating Buy
Investment Thesis Target Price $49-53
The media and entertainment industry is undergoing a change as more content
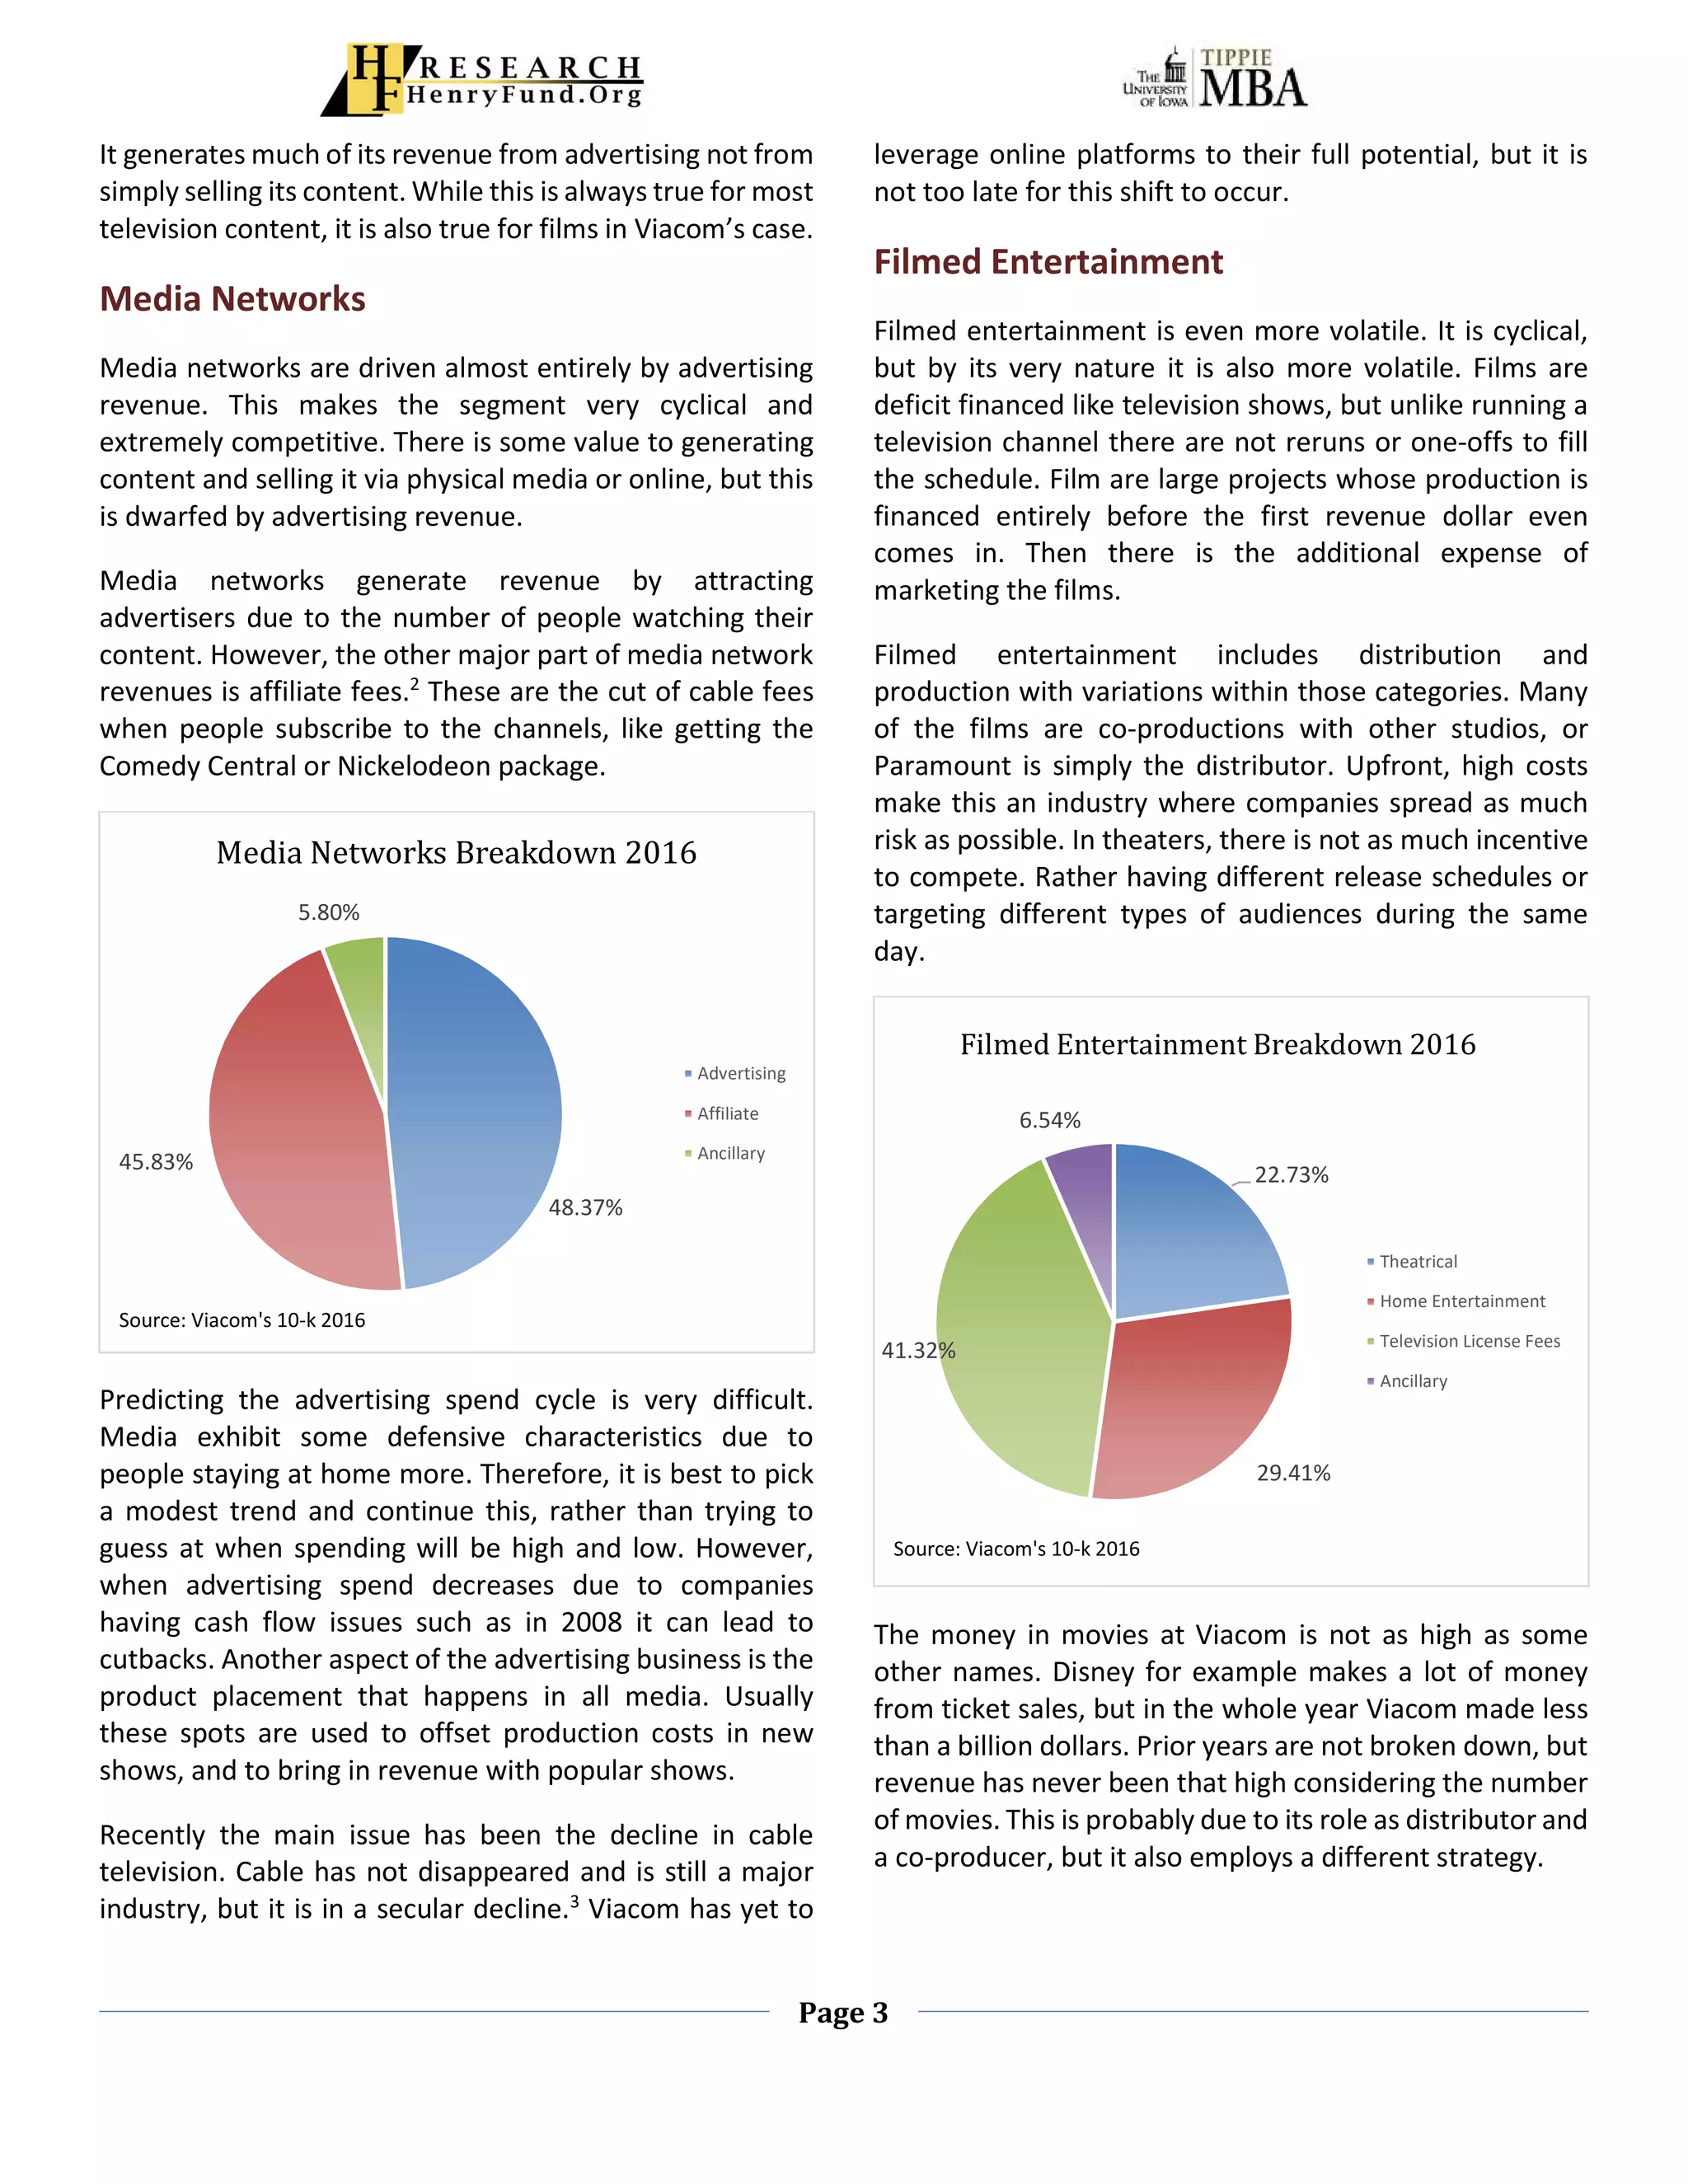
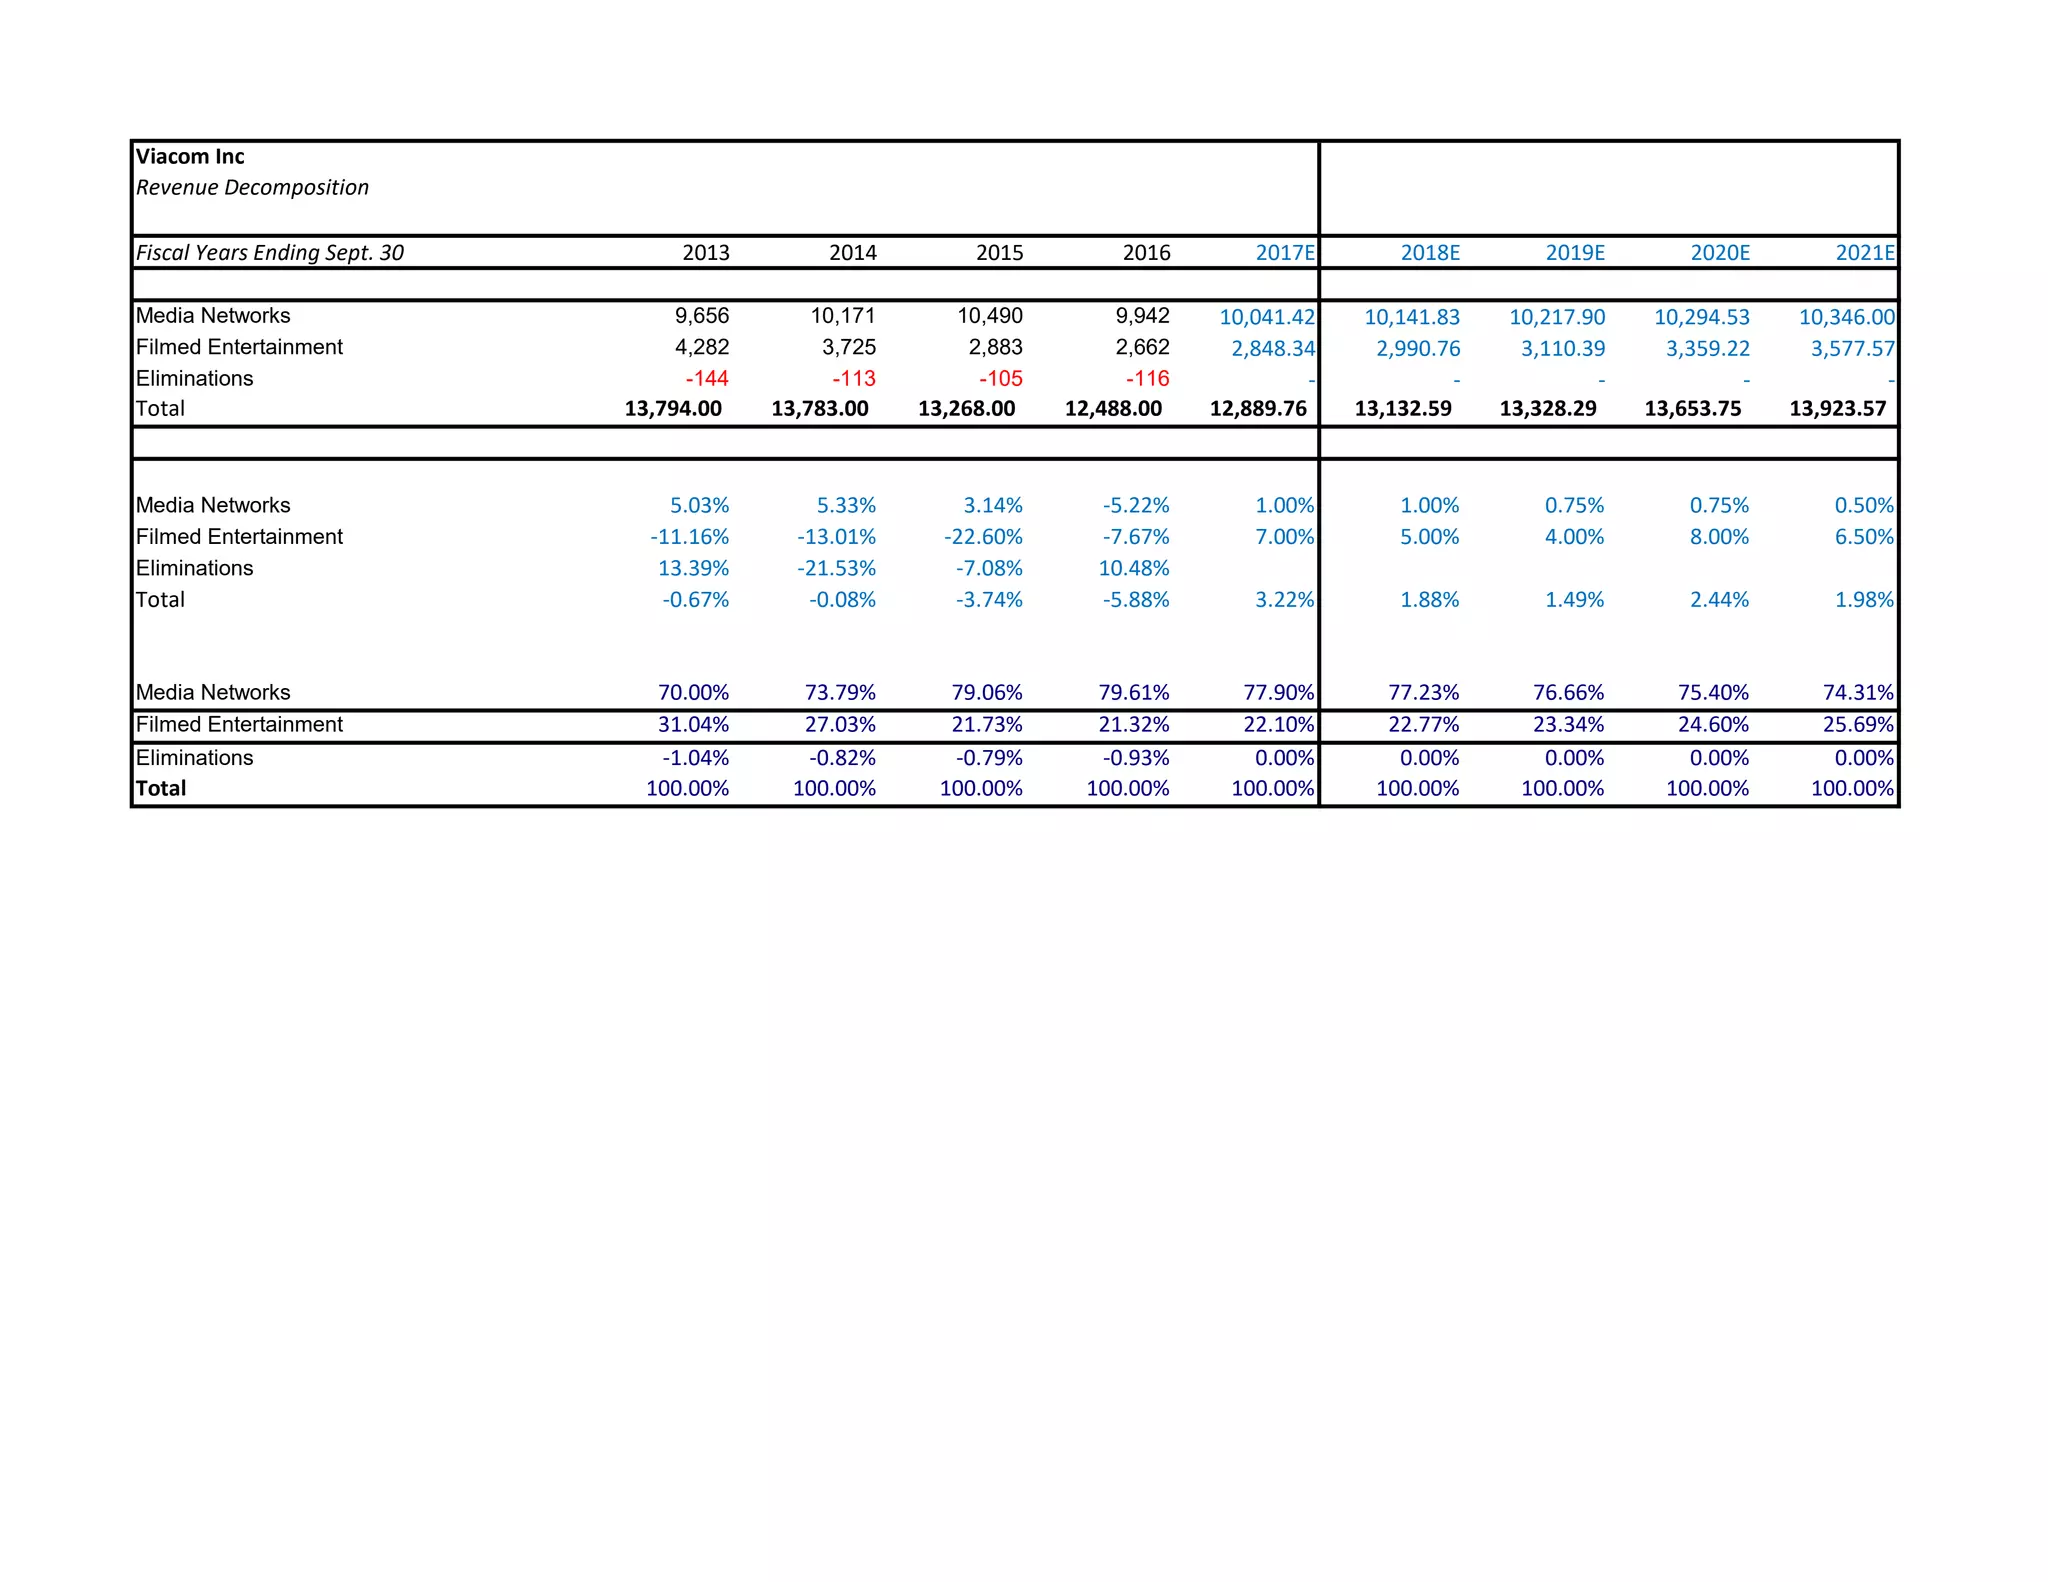
moves to online platforms. Viacom operates in two segments Media Networks,
which includes most traditional television, and Filmed Entertainment, which
includes movies. The company recently had a rough CEO change and a few
failed films that has hurt revenues. The company has two share classes, Class
A and Class B. Class A is voting and that is the only difference. 80% of the voting
Class A shares is controlled by one company that is owned by one family. CBS
is also contemplating a merger, and it has the same structure and majority
owner as Viacom.
Investment Positives
The recent trouble in the company has led to the stock being sold off than
its fundamentals would suggest. Between the messy CEO replacement,
weak performance at the box office, and one family’s control of the
company there have been many headwinds.
A merger with CBS could produce a leaner company with a larger content
library. That may create the capacity to launch its own online platform,
which is critical if the company intends to stay relevant into the future.
The company’s strategic plan is to go back to integrating its two lines of
business as it used to do. The goal is to create movies that drive television
views, and use television to bring people to the movies. This could bring
filmed entertainment back to normal, which would be a major boost for
the company’s returns.
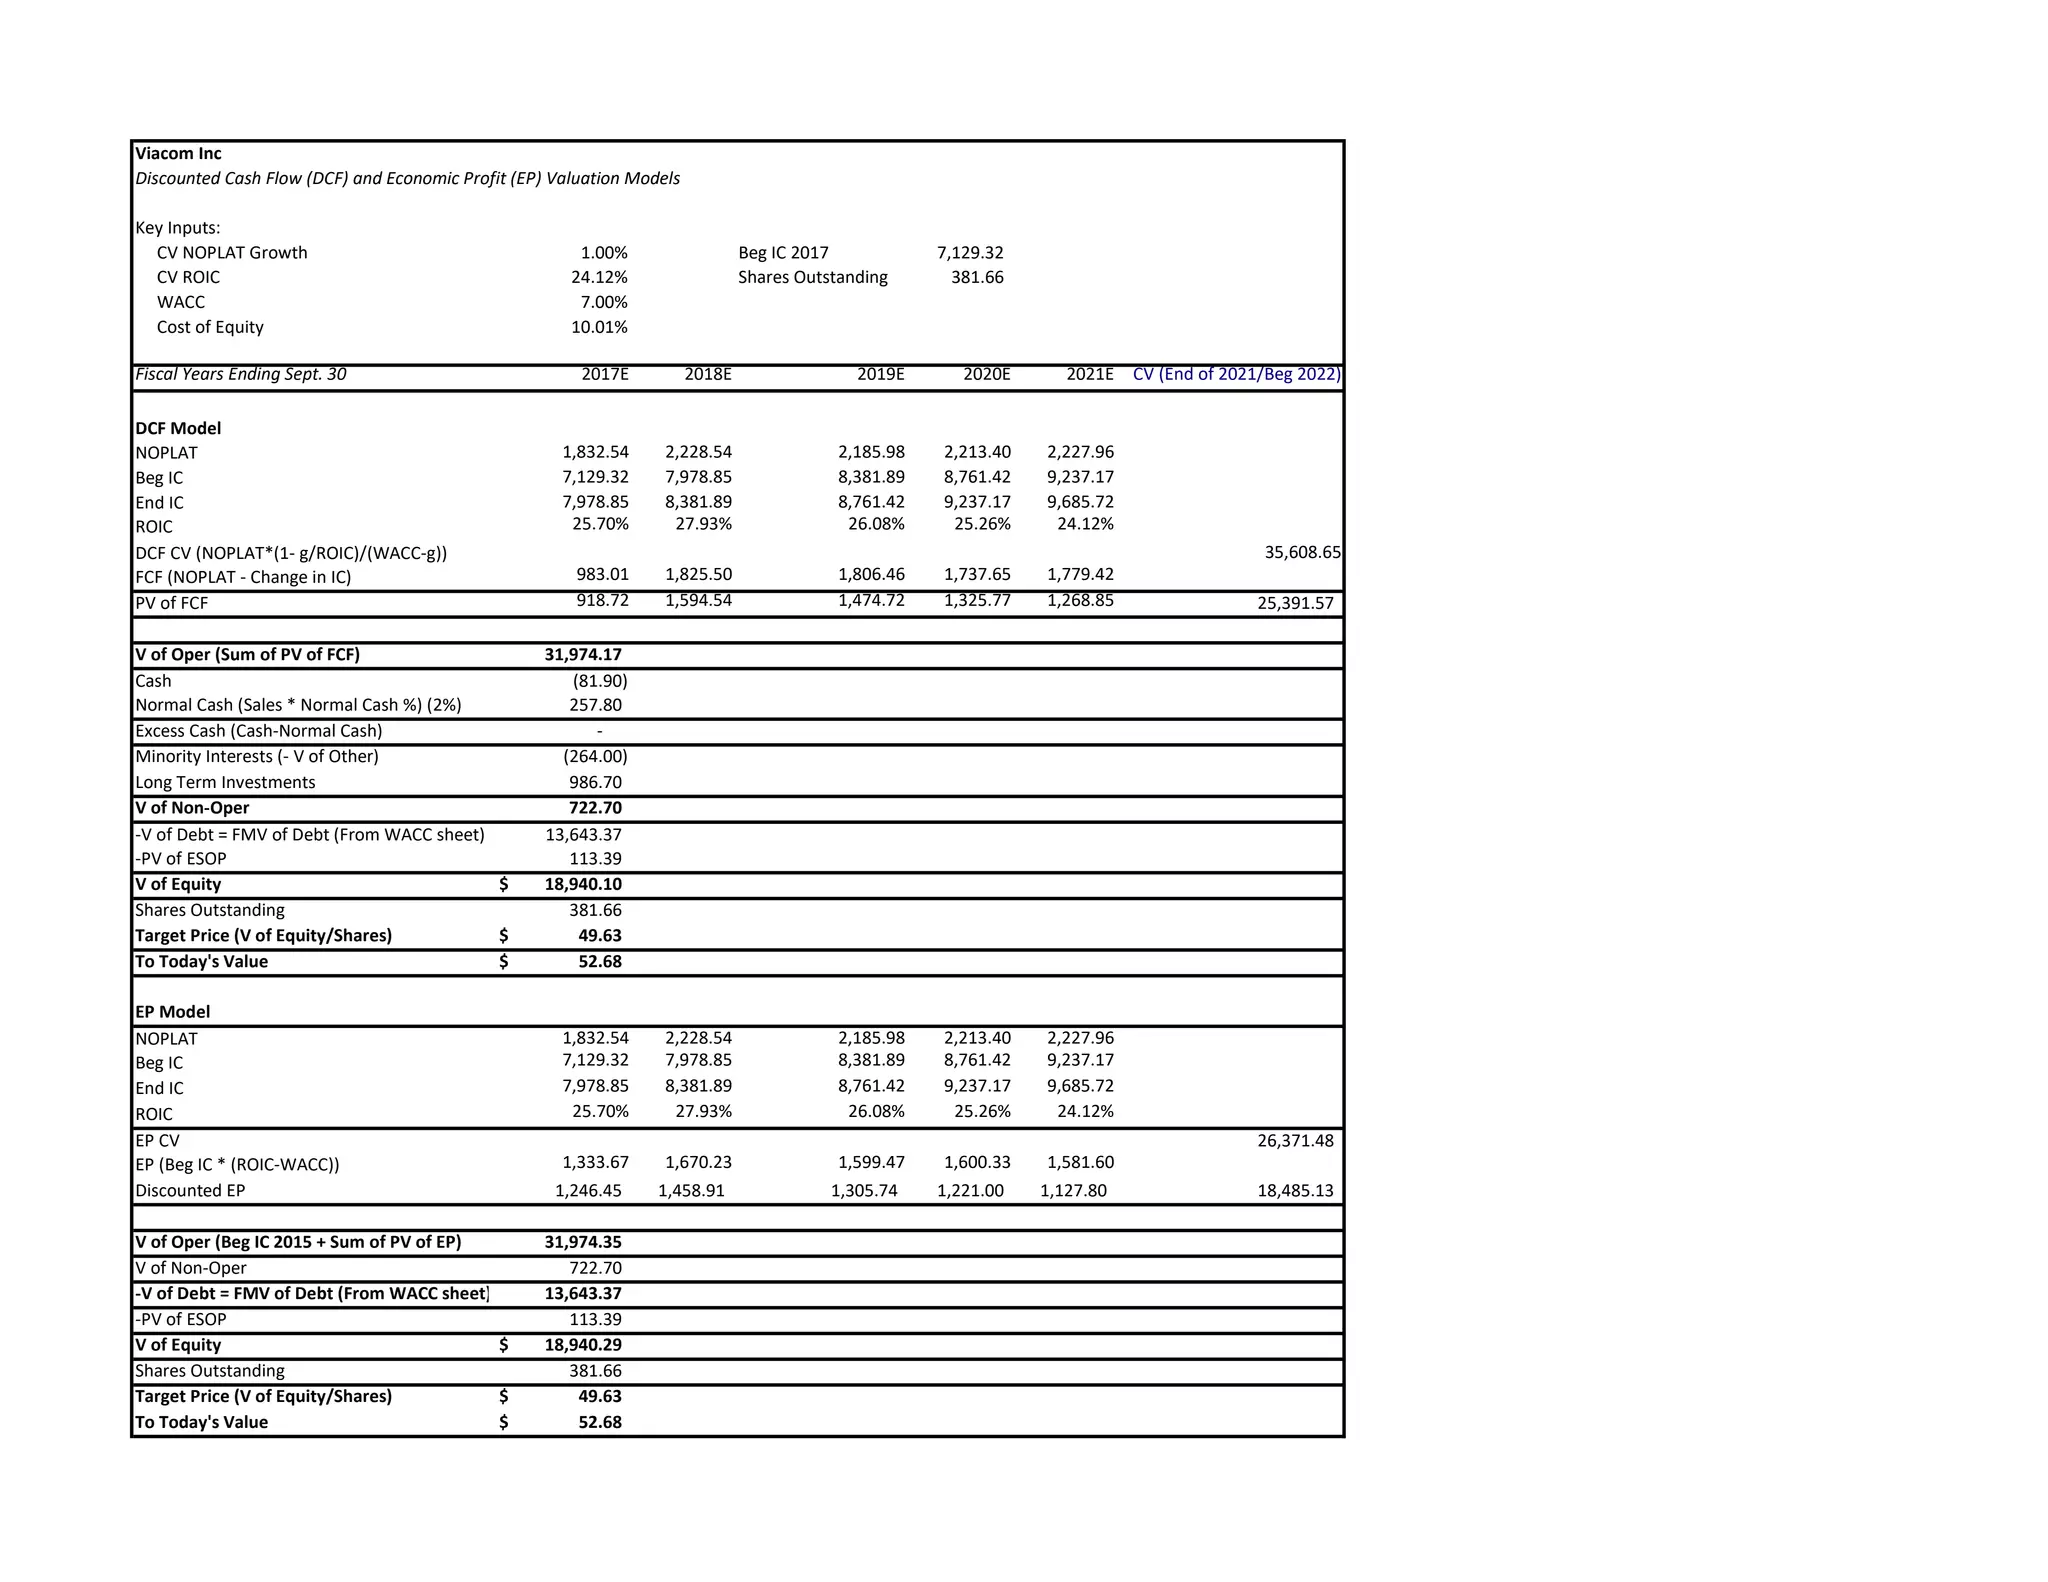
In the DCF model, we have used conservative assumptions as needed, and
there is still plenty of upside in the stock. However, the uncertainty
inherent in the business can change the story very fast.
Investment Negatives
The Redstone family continues to control the company. The CEO debacle is
not the first controversy that has been caused by the concentration of
voting shares.
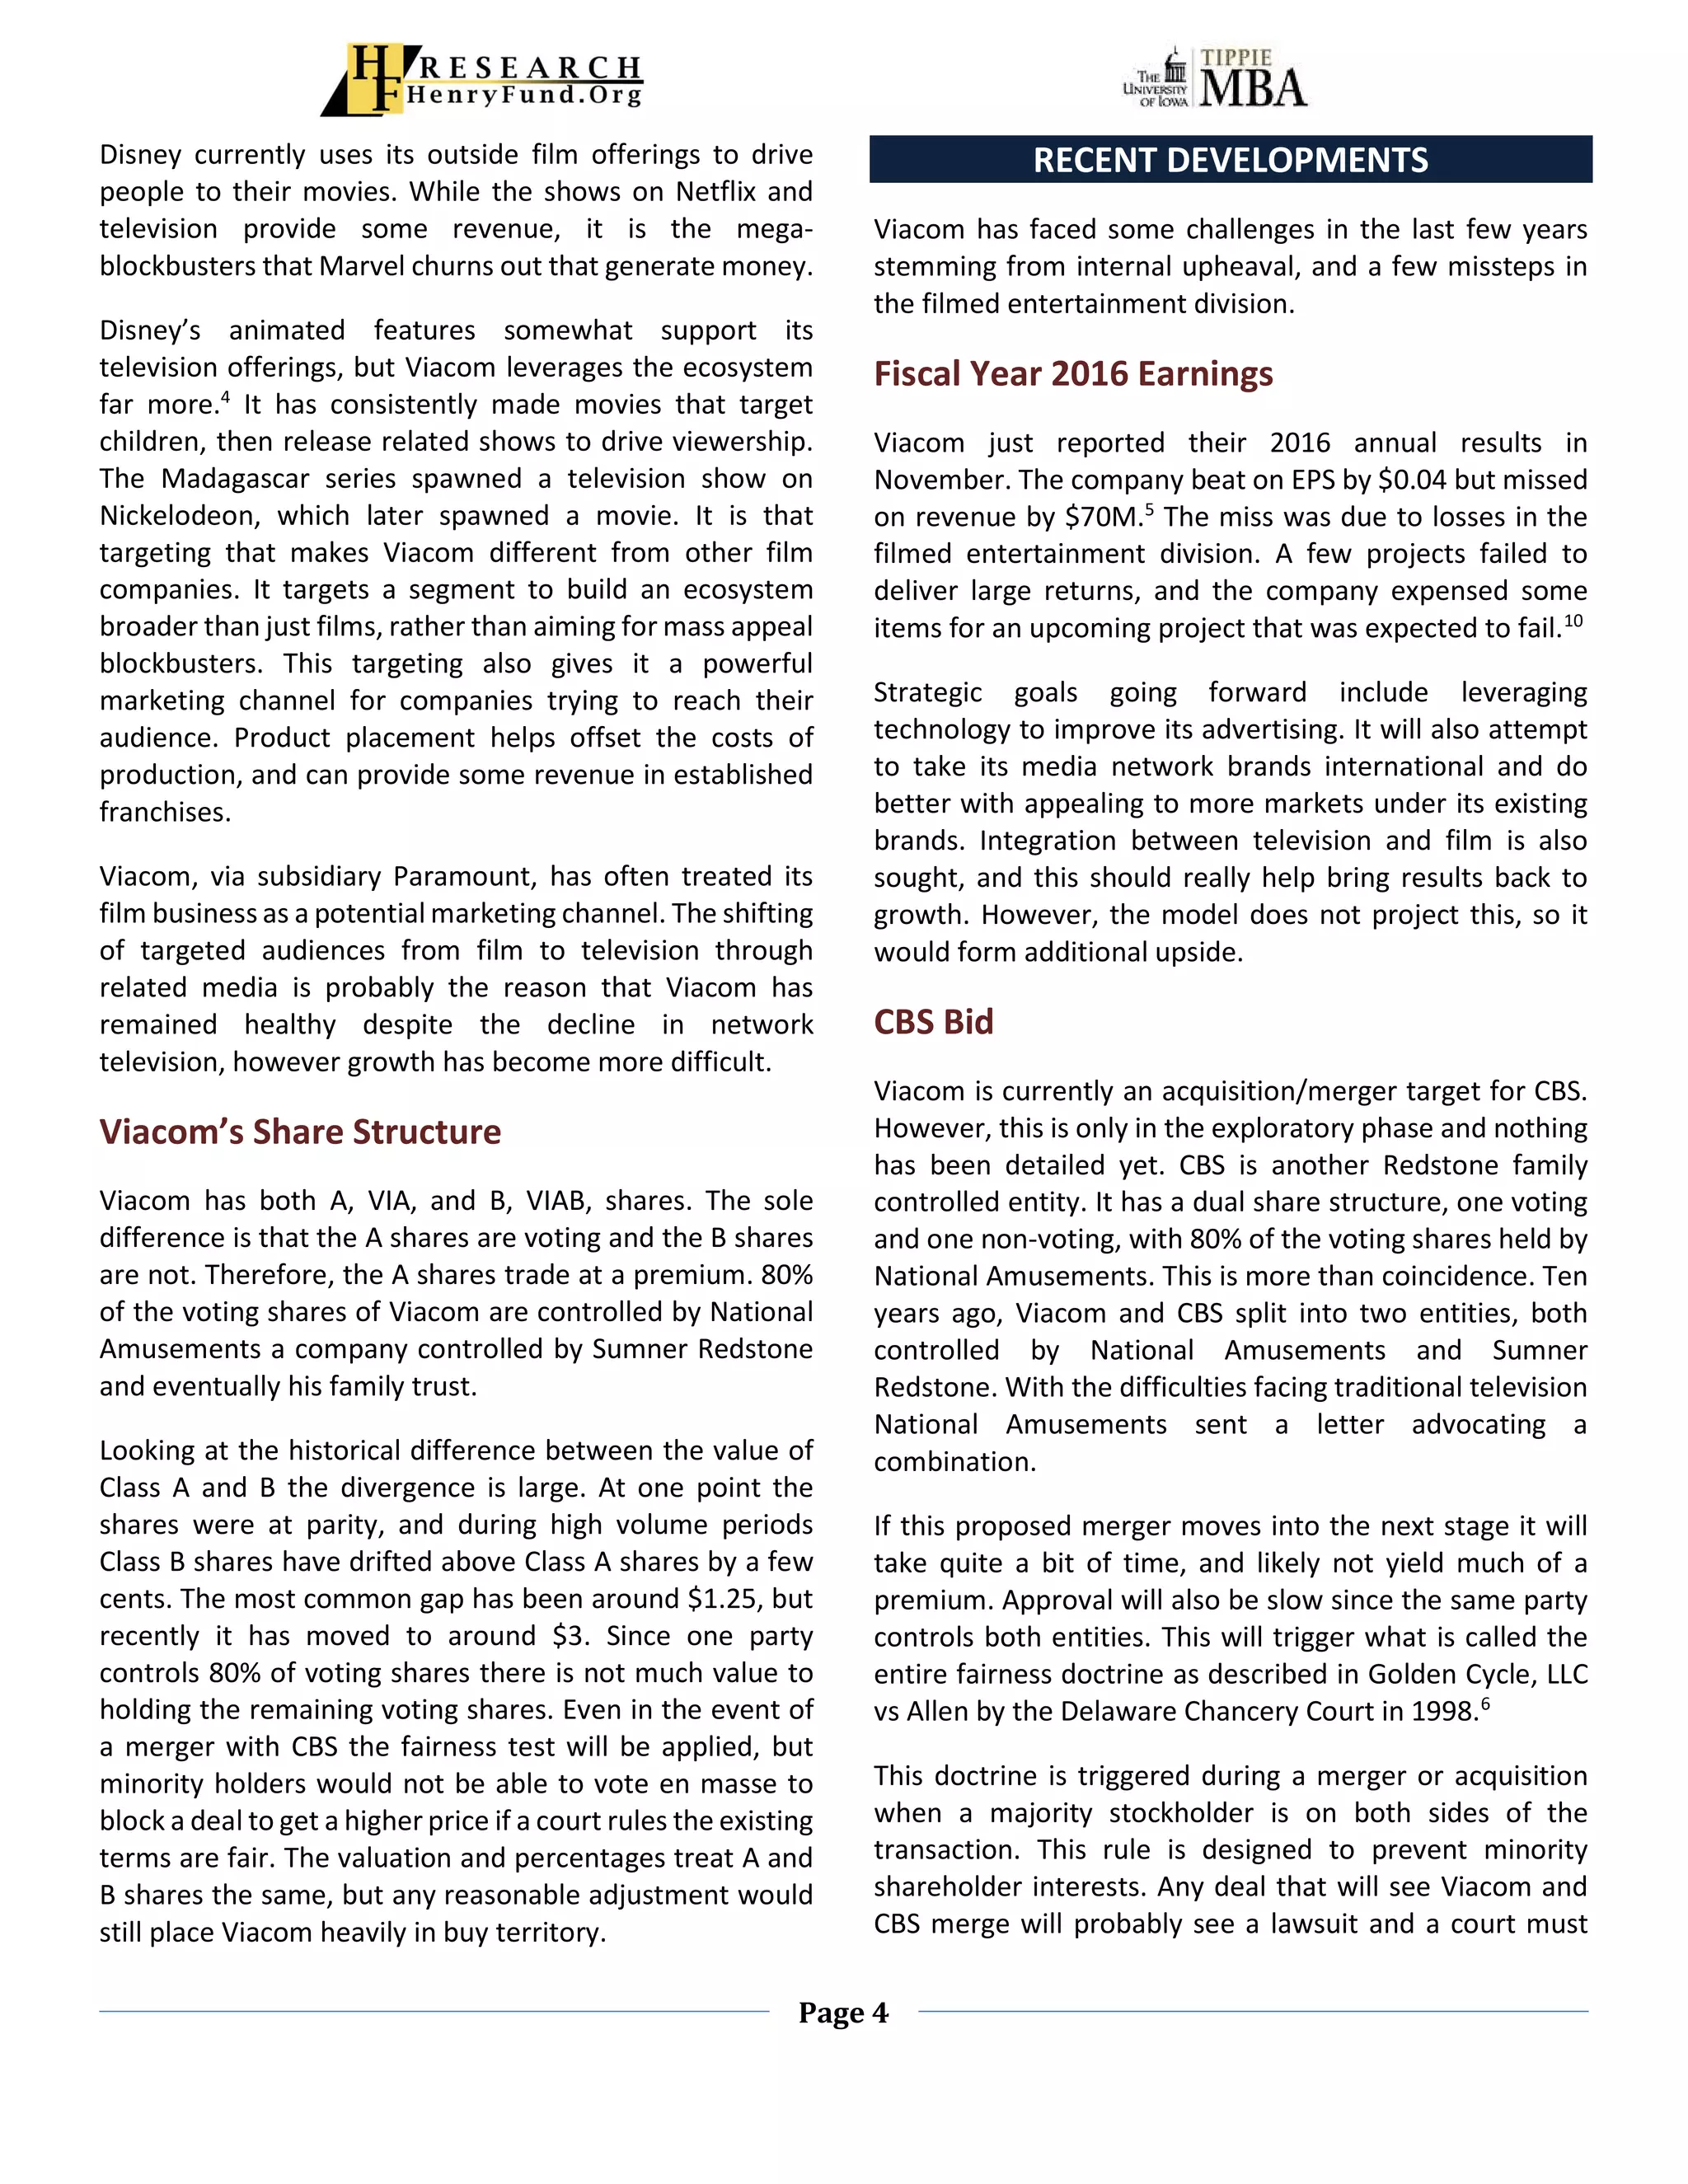
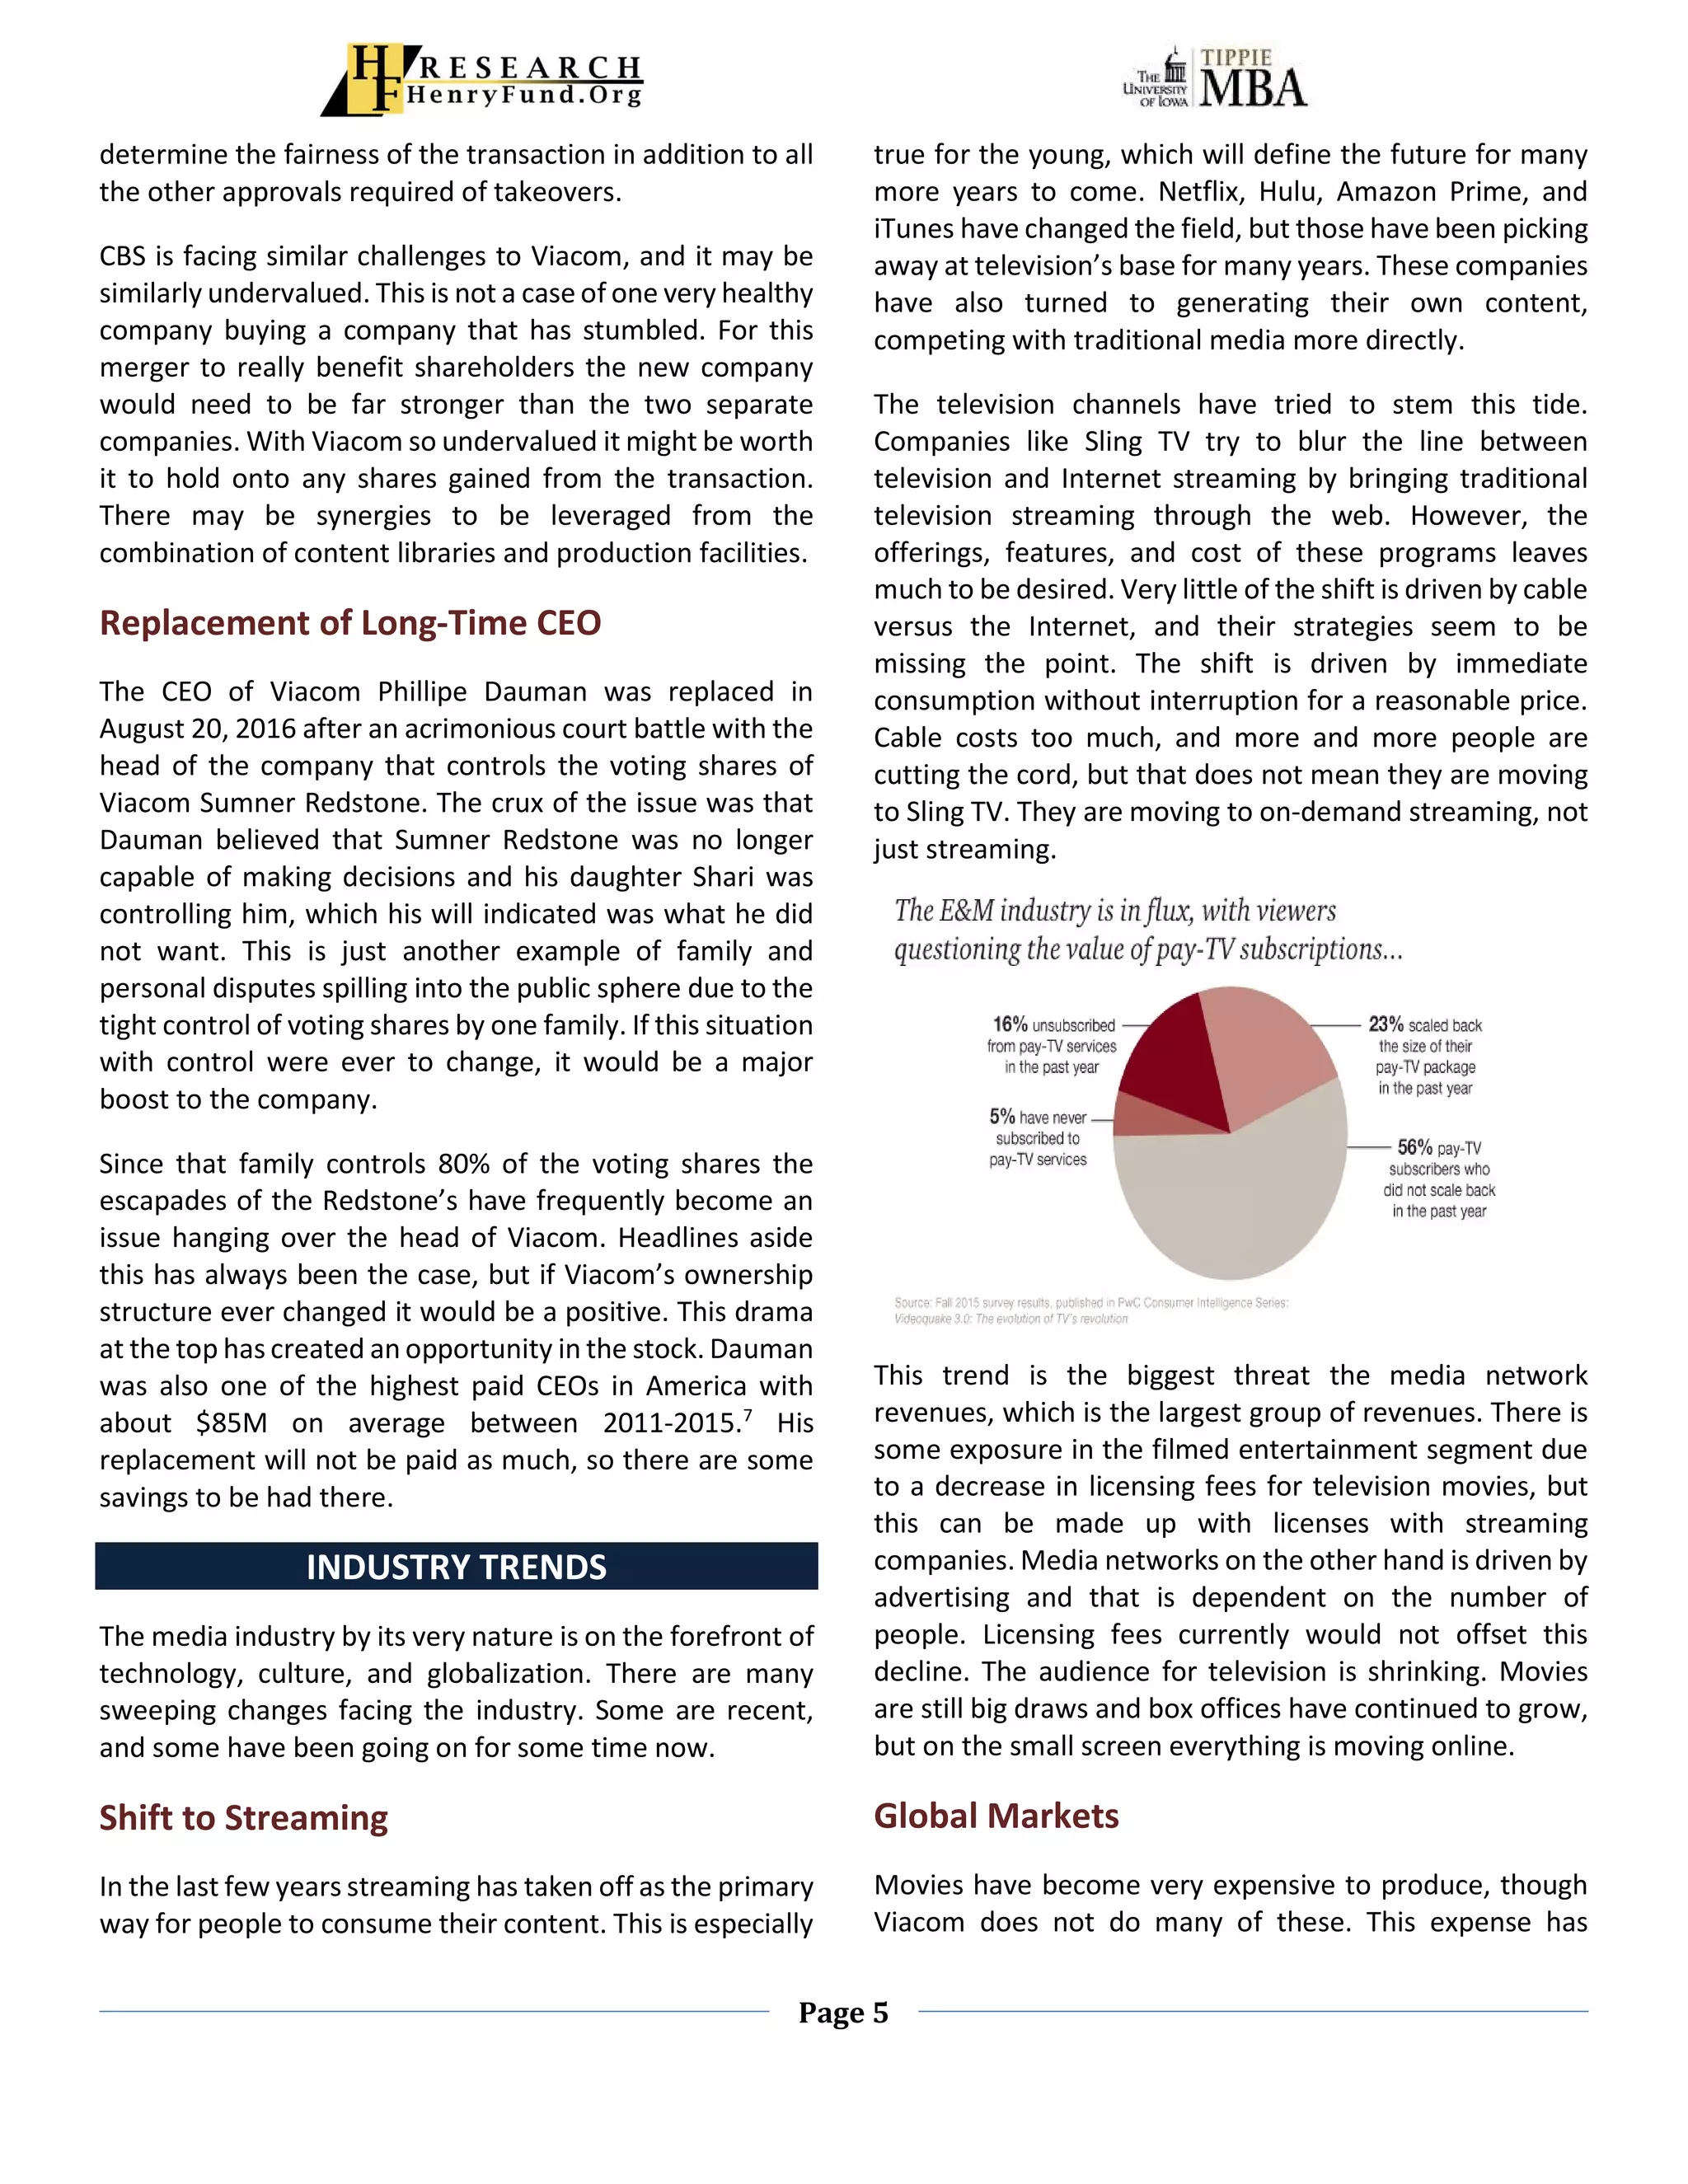
Traditional television is in a decline with the shift to streaming, and this
segment still makes up most of Viacom’s revenue. The company does not
currently have a fast-growing alternative that could replace this revenue
segment.
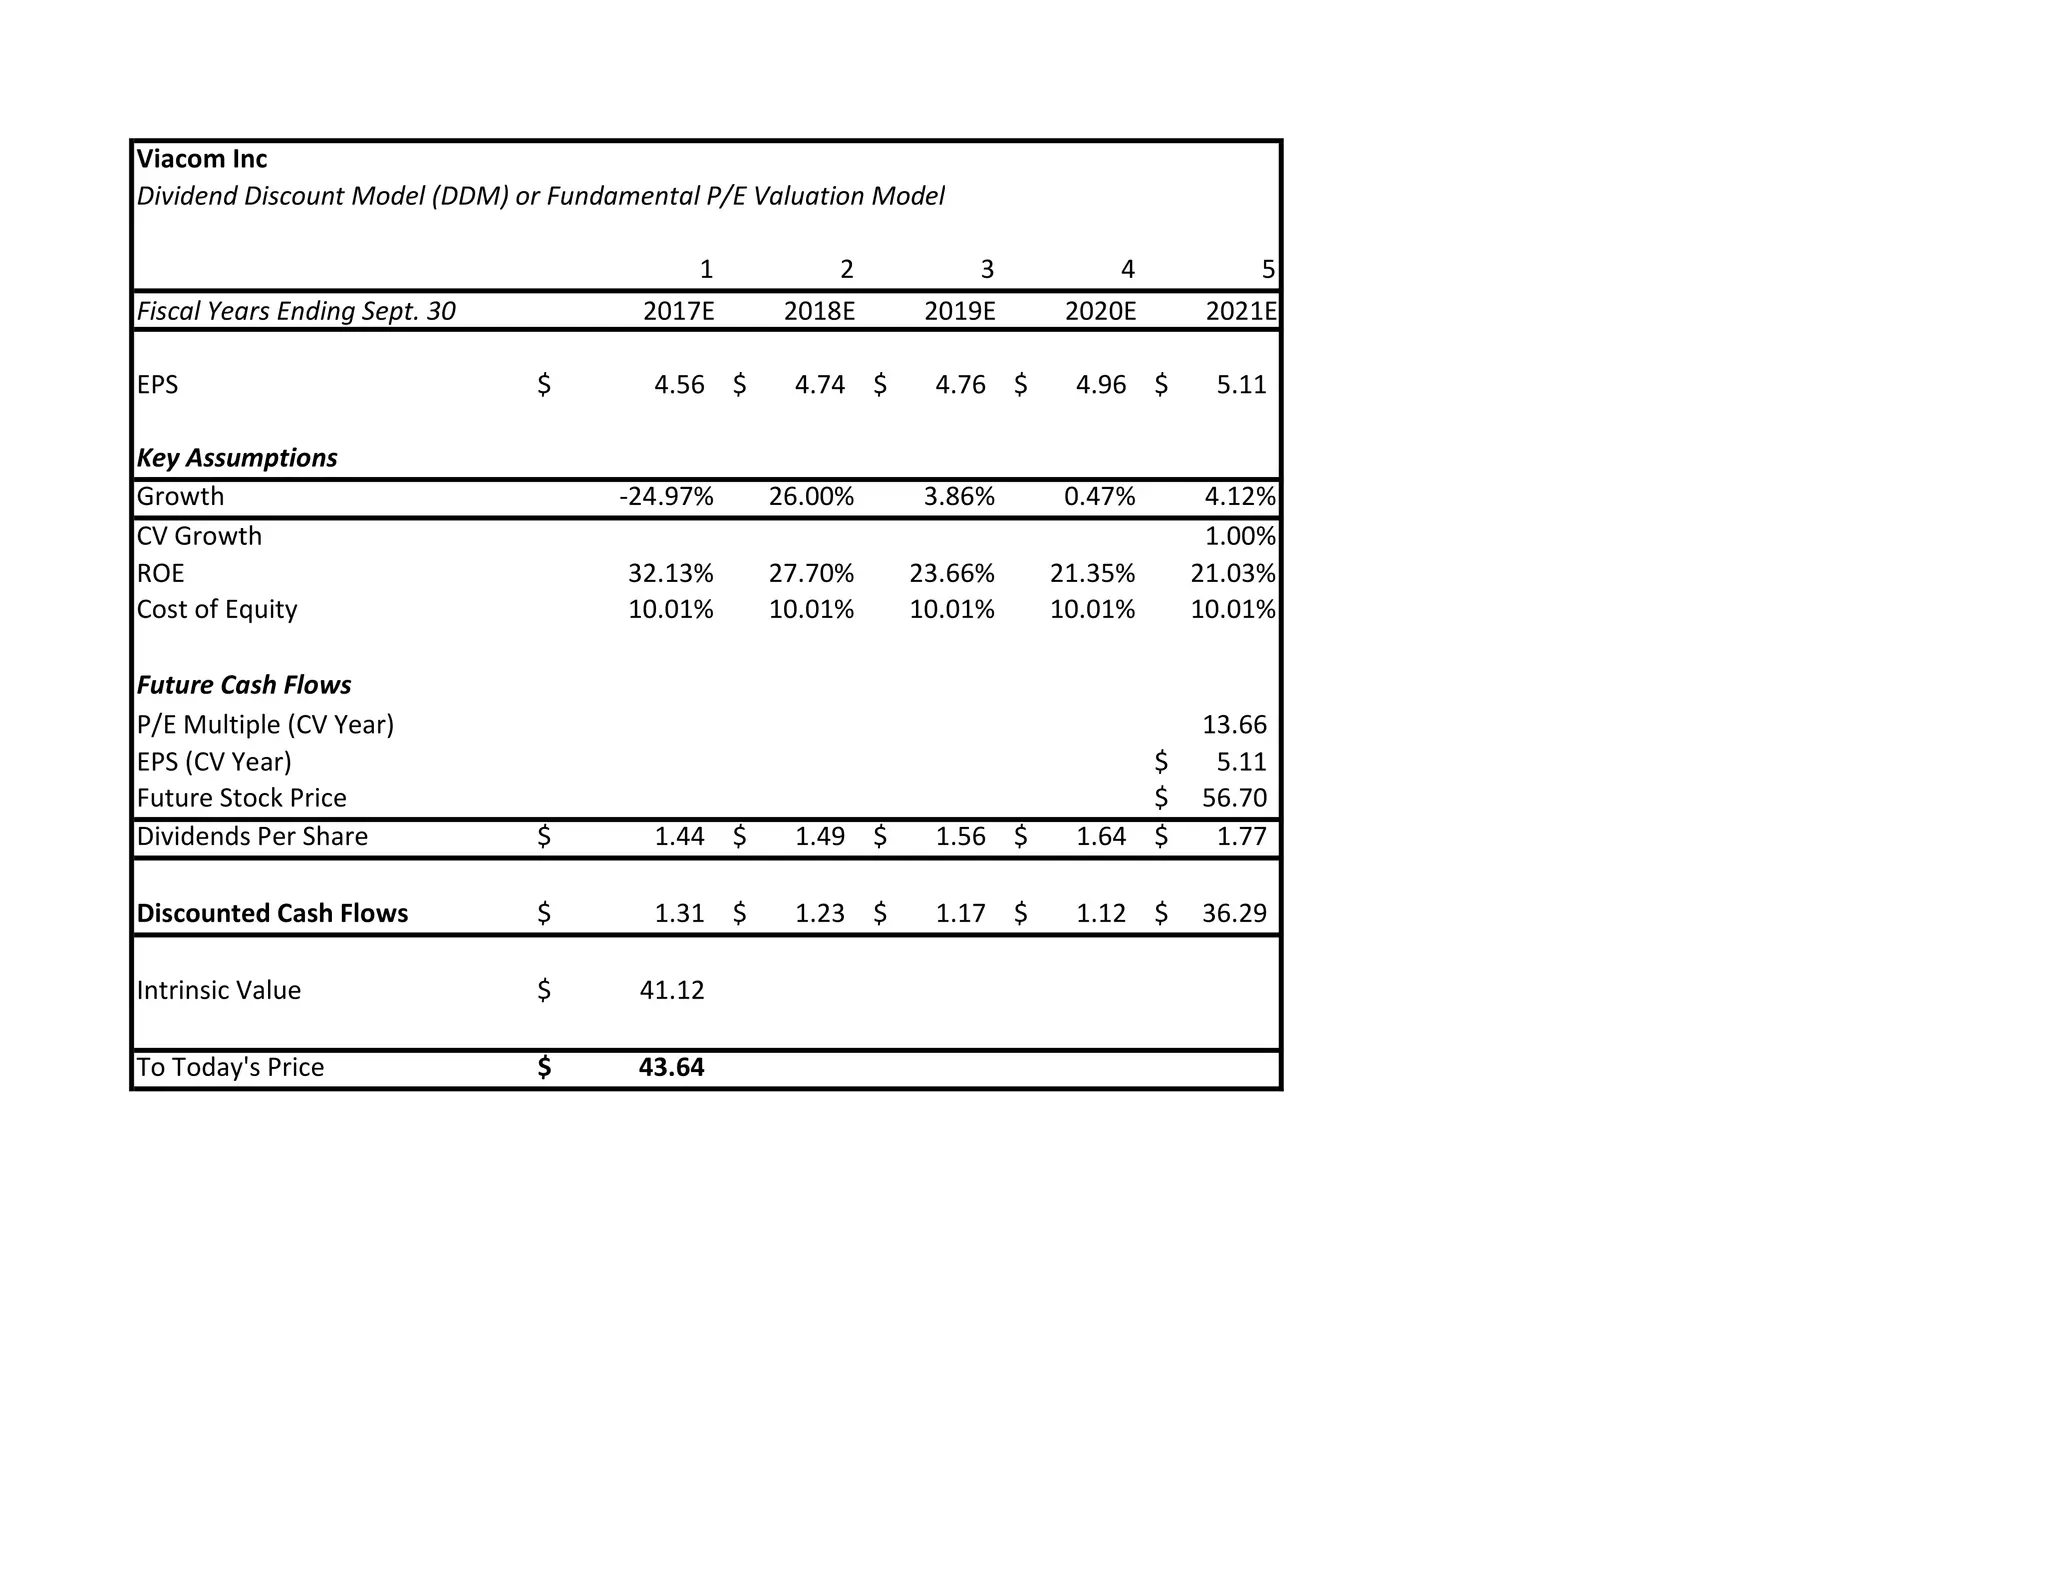
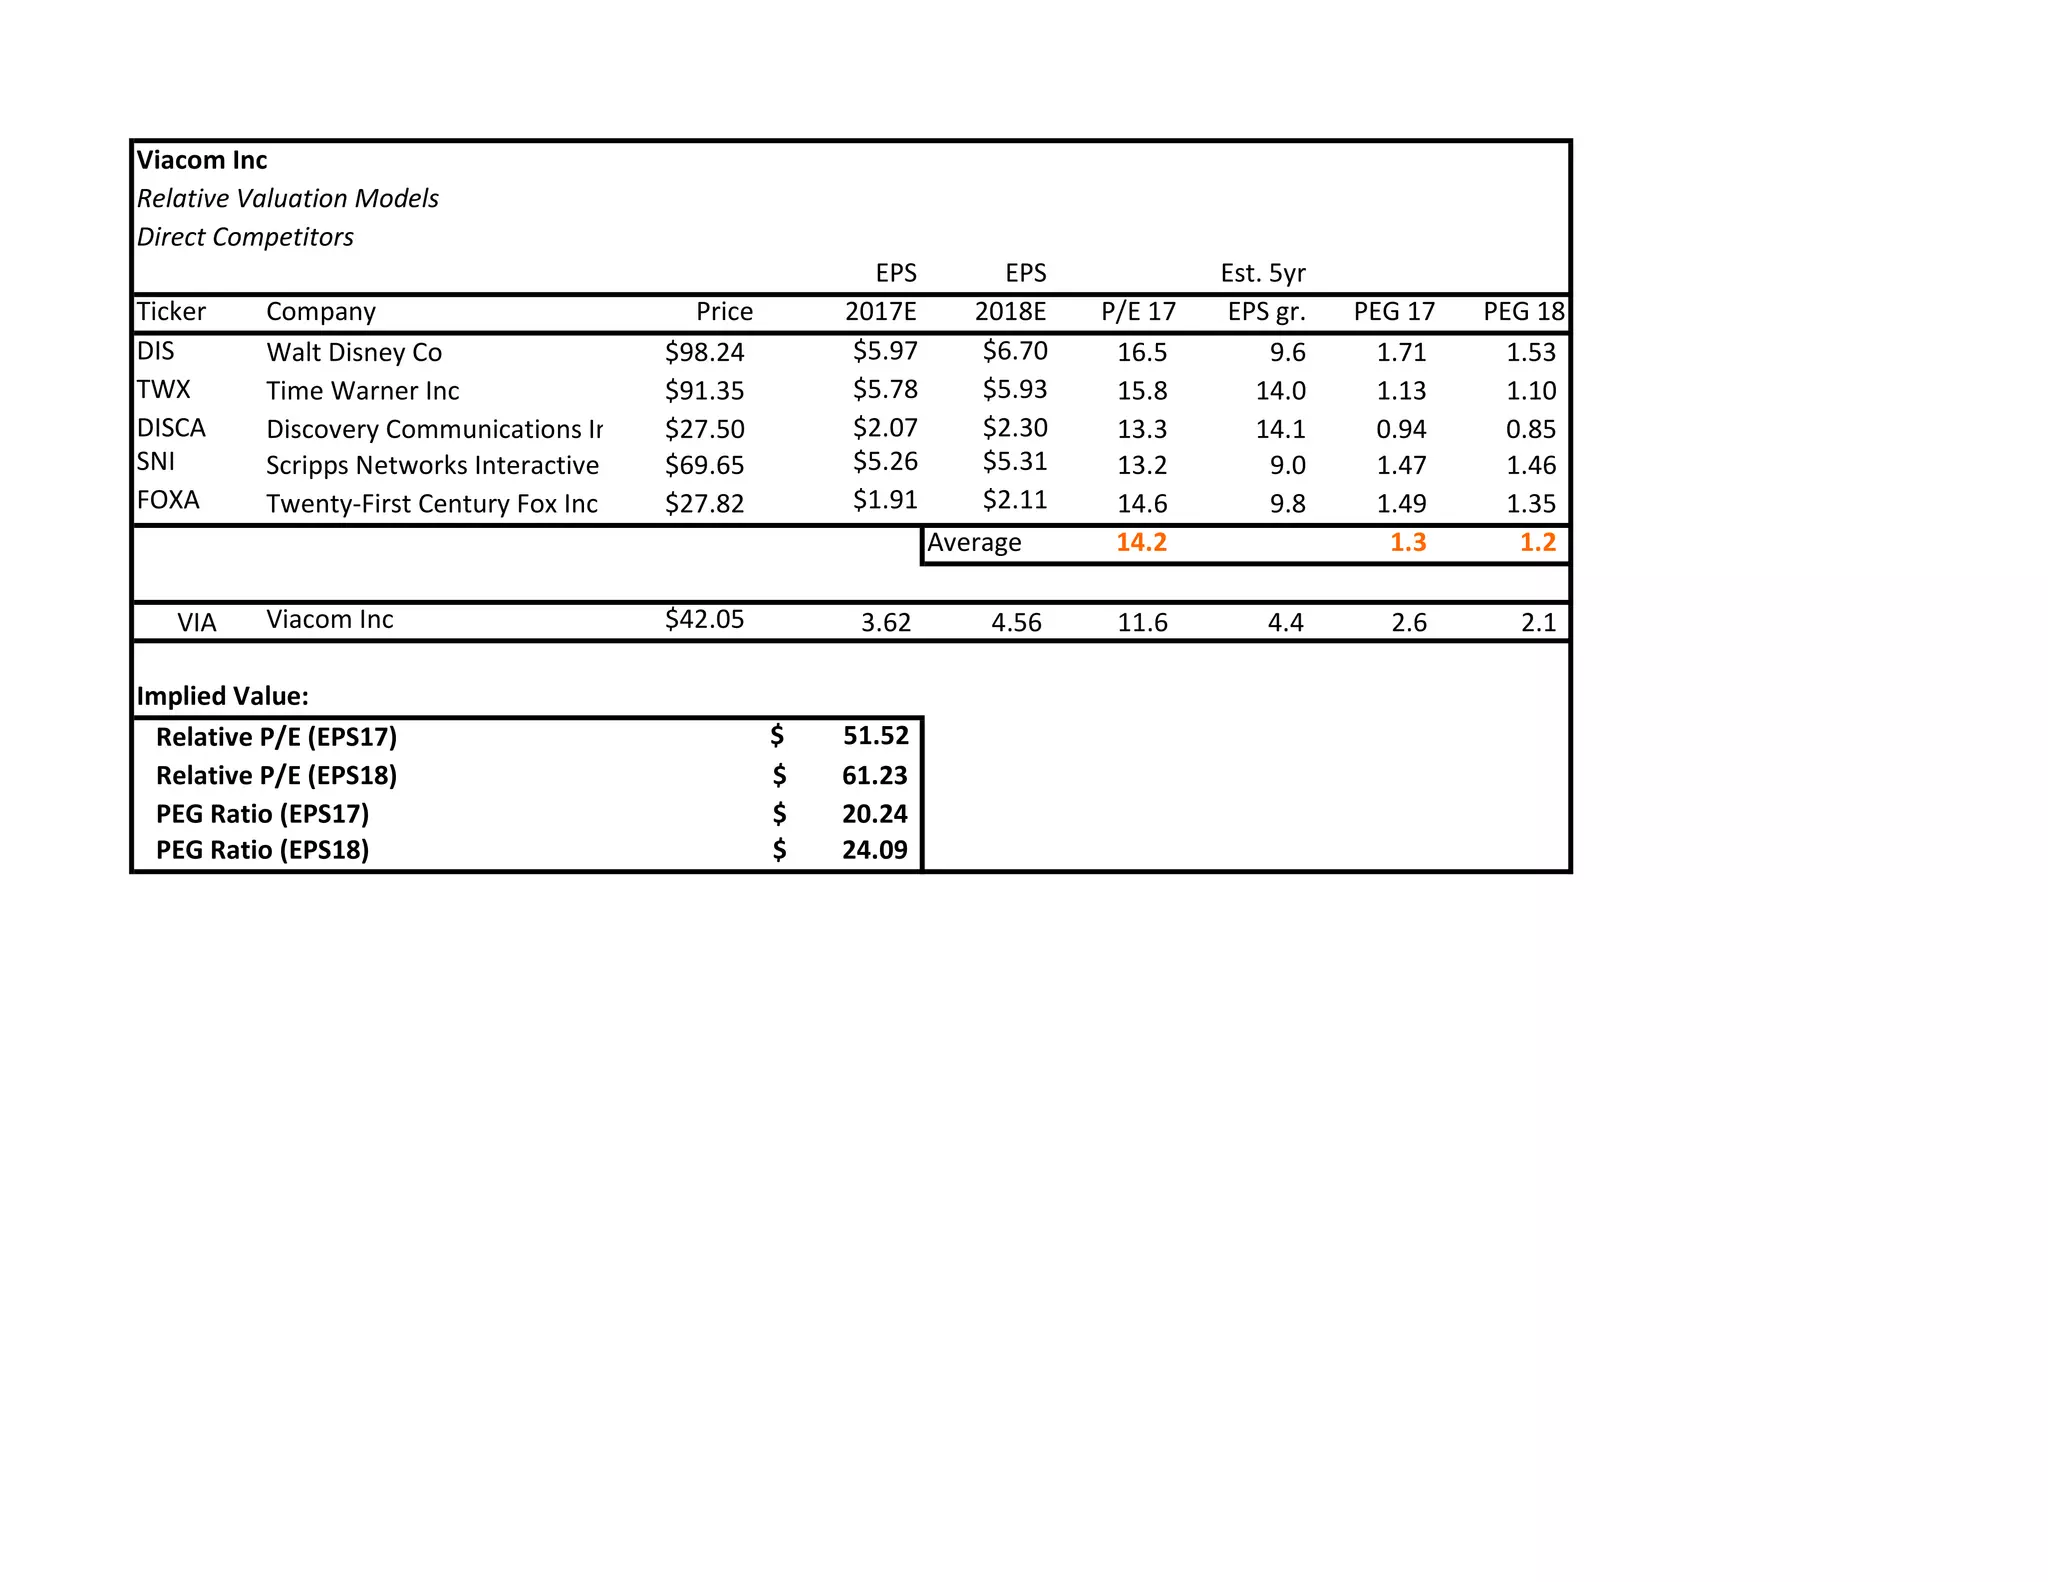
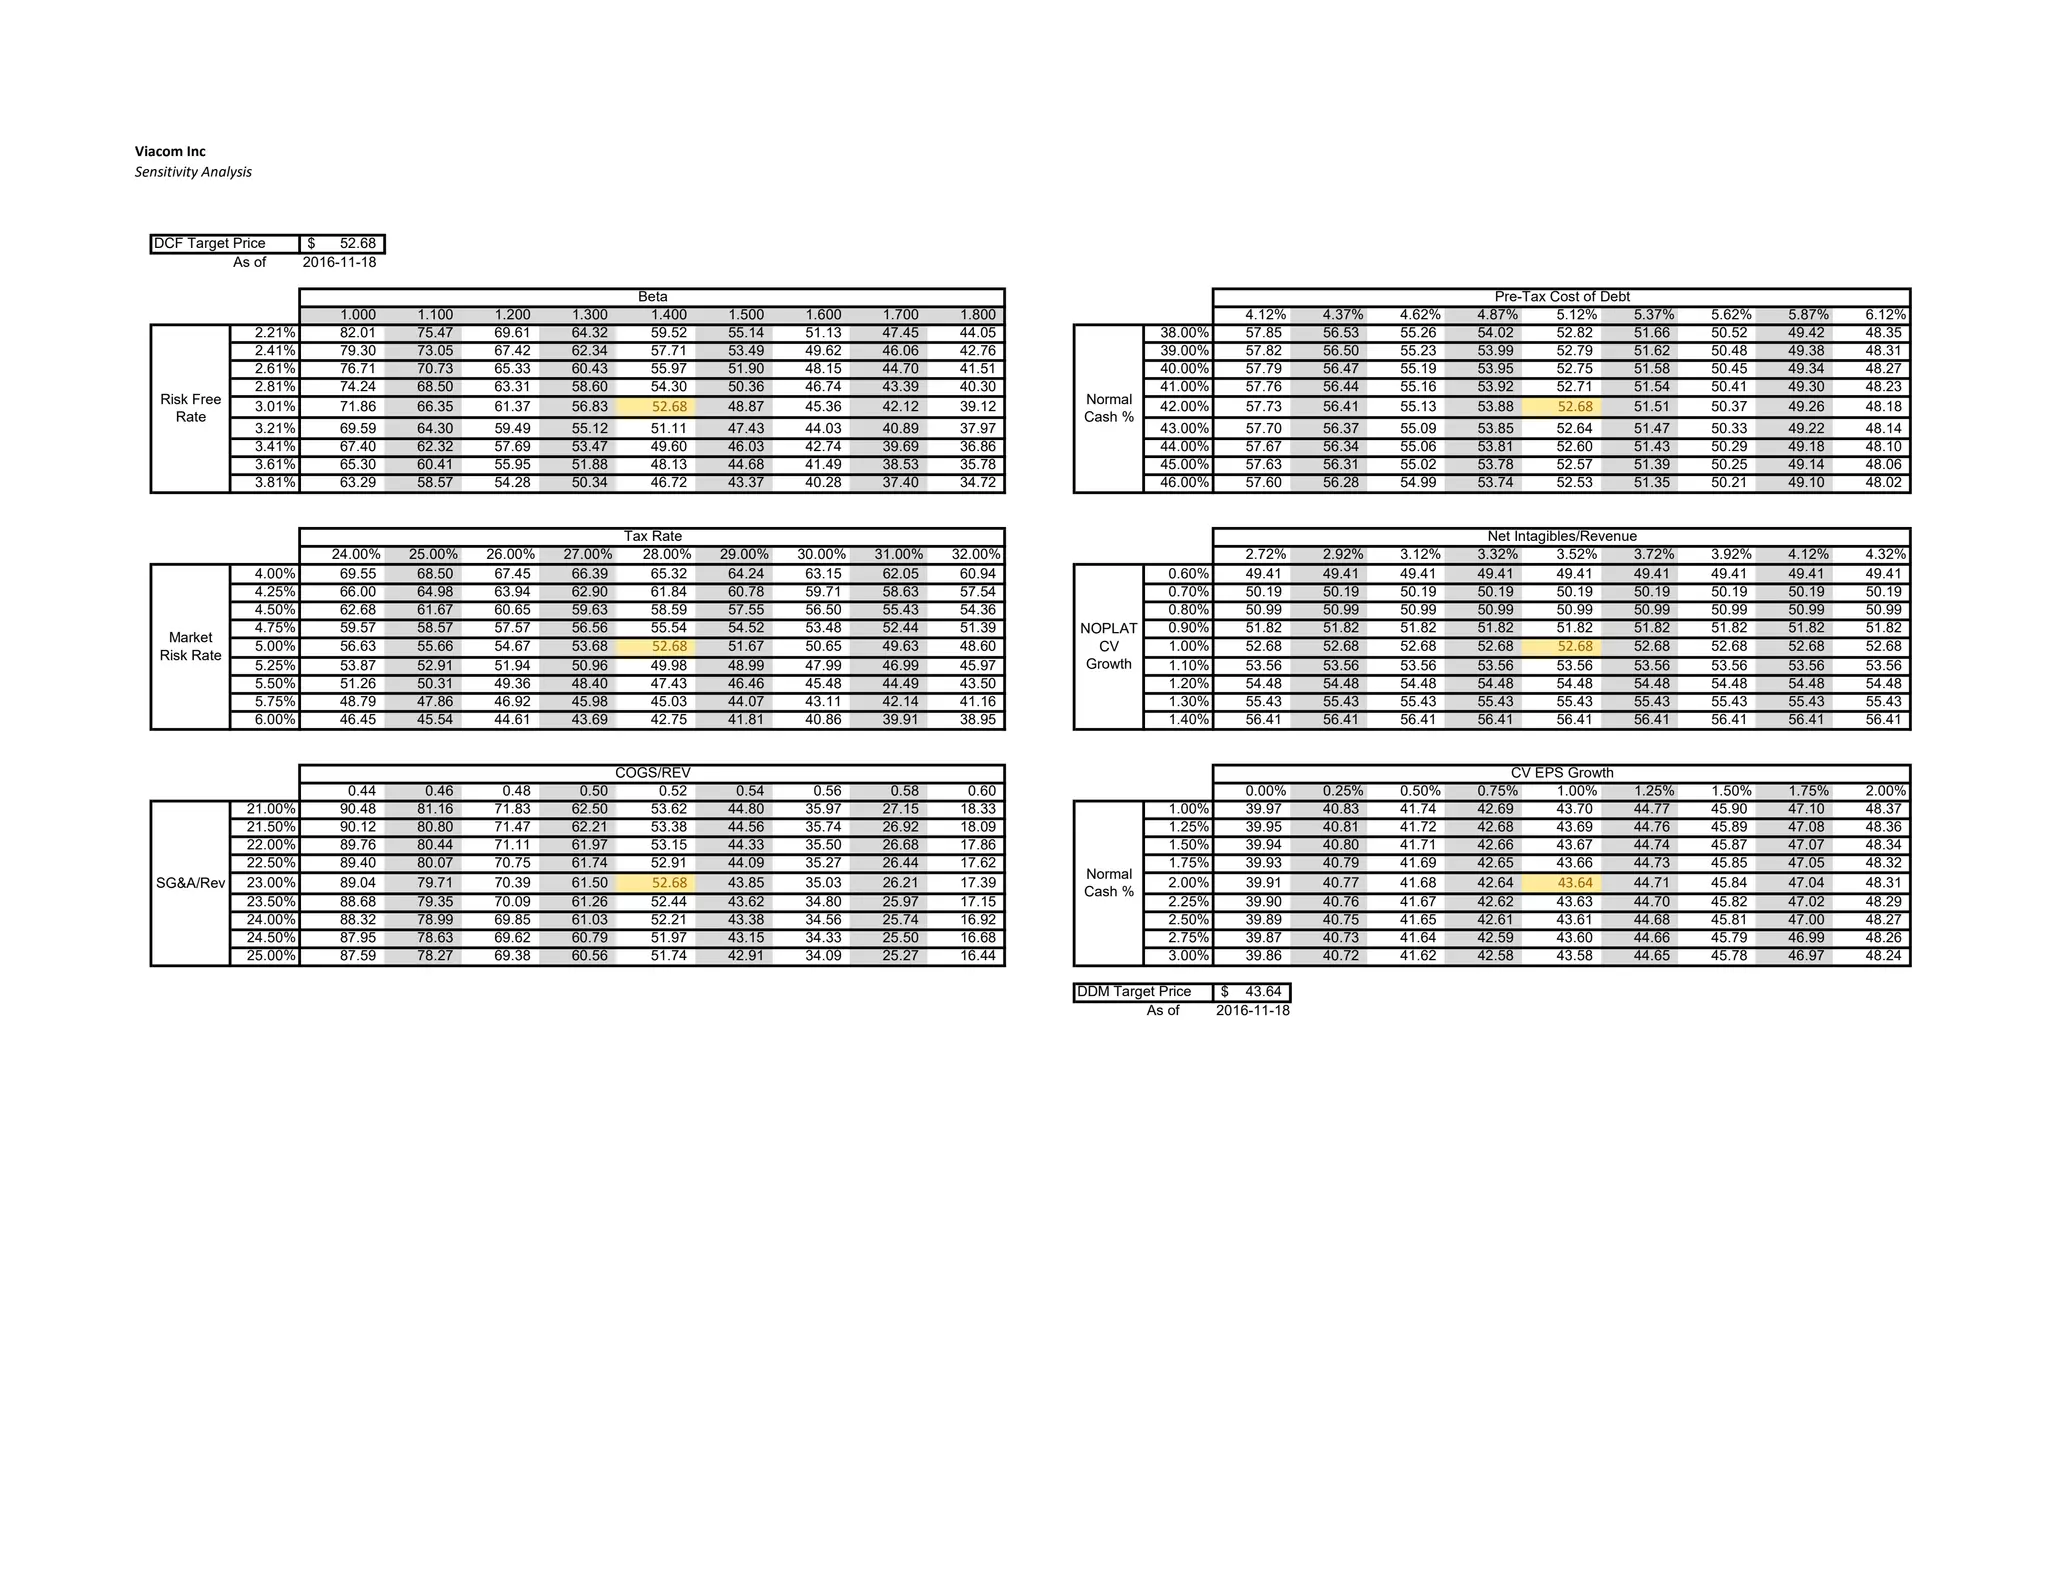
Henry Fund DCF $52.68
Henry Fund DDM $43.64
Relative PE (EPS17) $51.52
Price Data
Current Price $37.77
52wk Range $30.11-52.95
Consensus 1yr Target $42.59
Key Statistics
Market Cap (B) $15.15
Shares Outstanding (M) 397
Institutional Ownership 90.70%
Three Year Beta (weekly) 1.4000
Dividend Yield 2.1%
Est. 5yr Growth 4.5%
Price/Earnings (TTM) 10.67
Price/Earnings (FY1) 9.9
Price/Book (mrq) 3.5
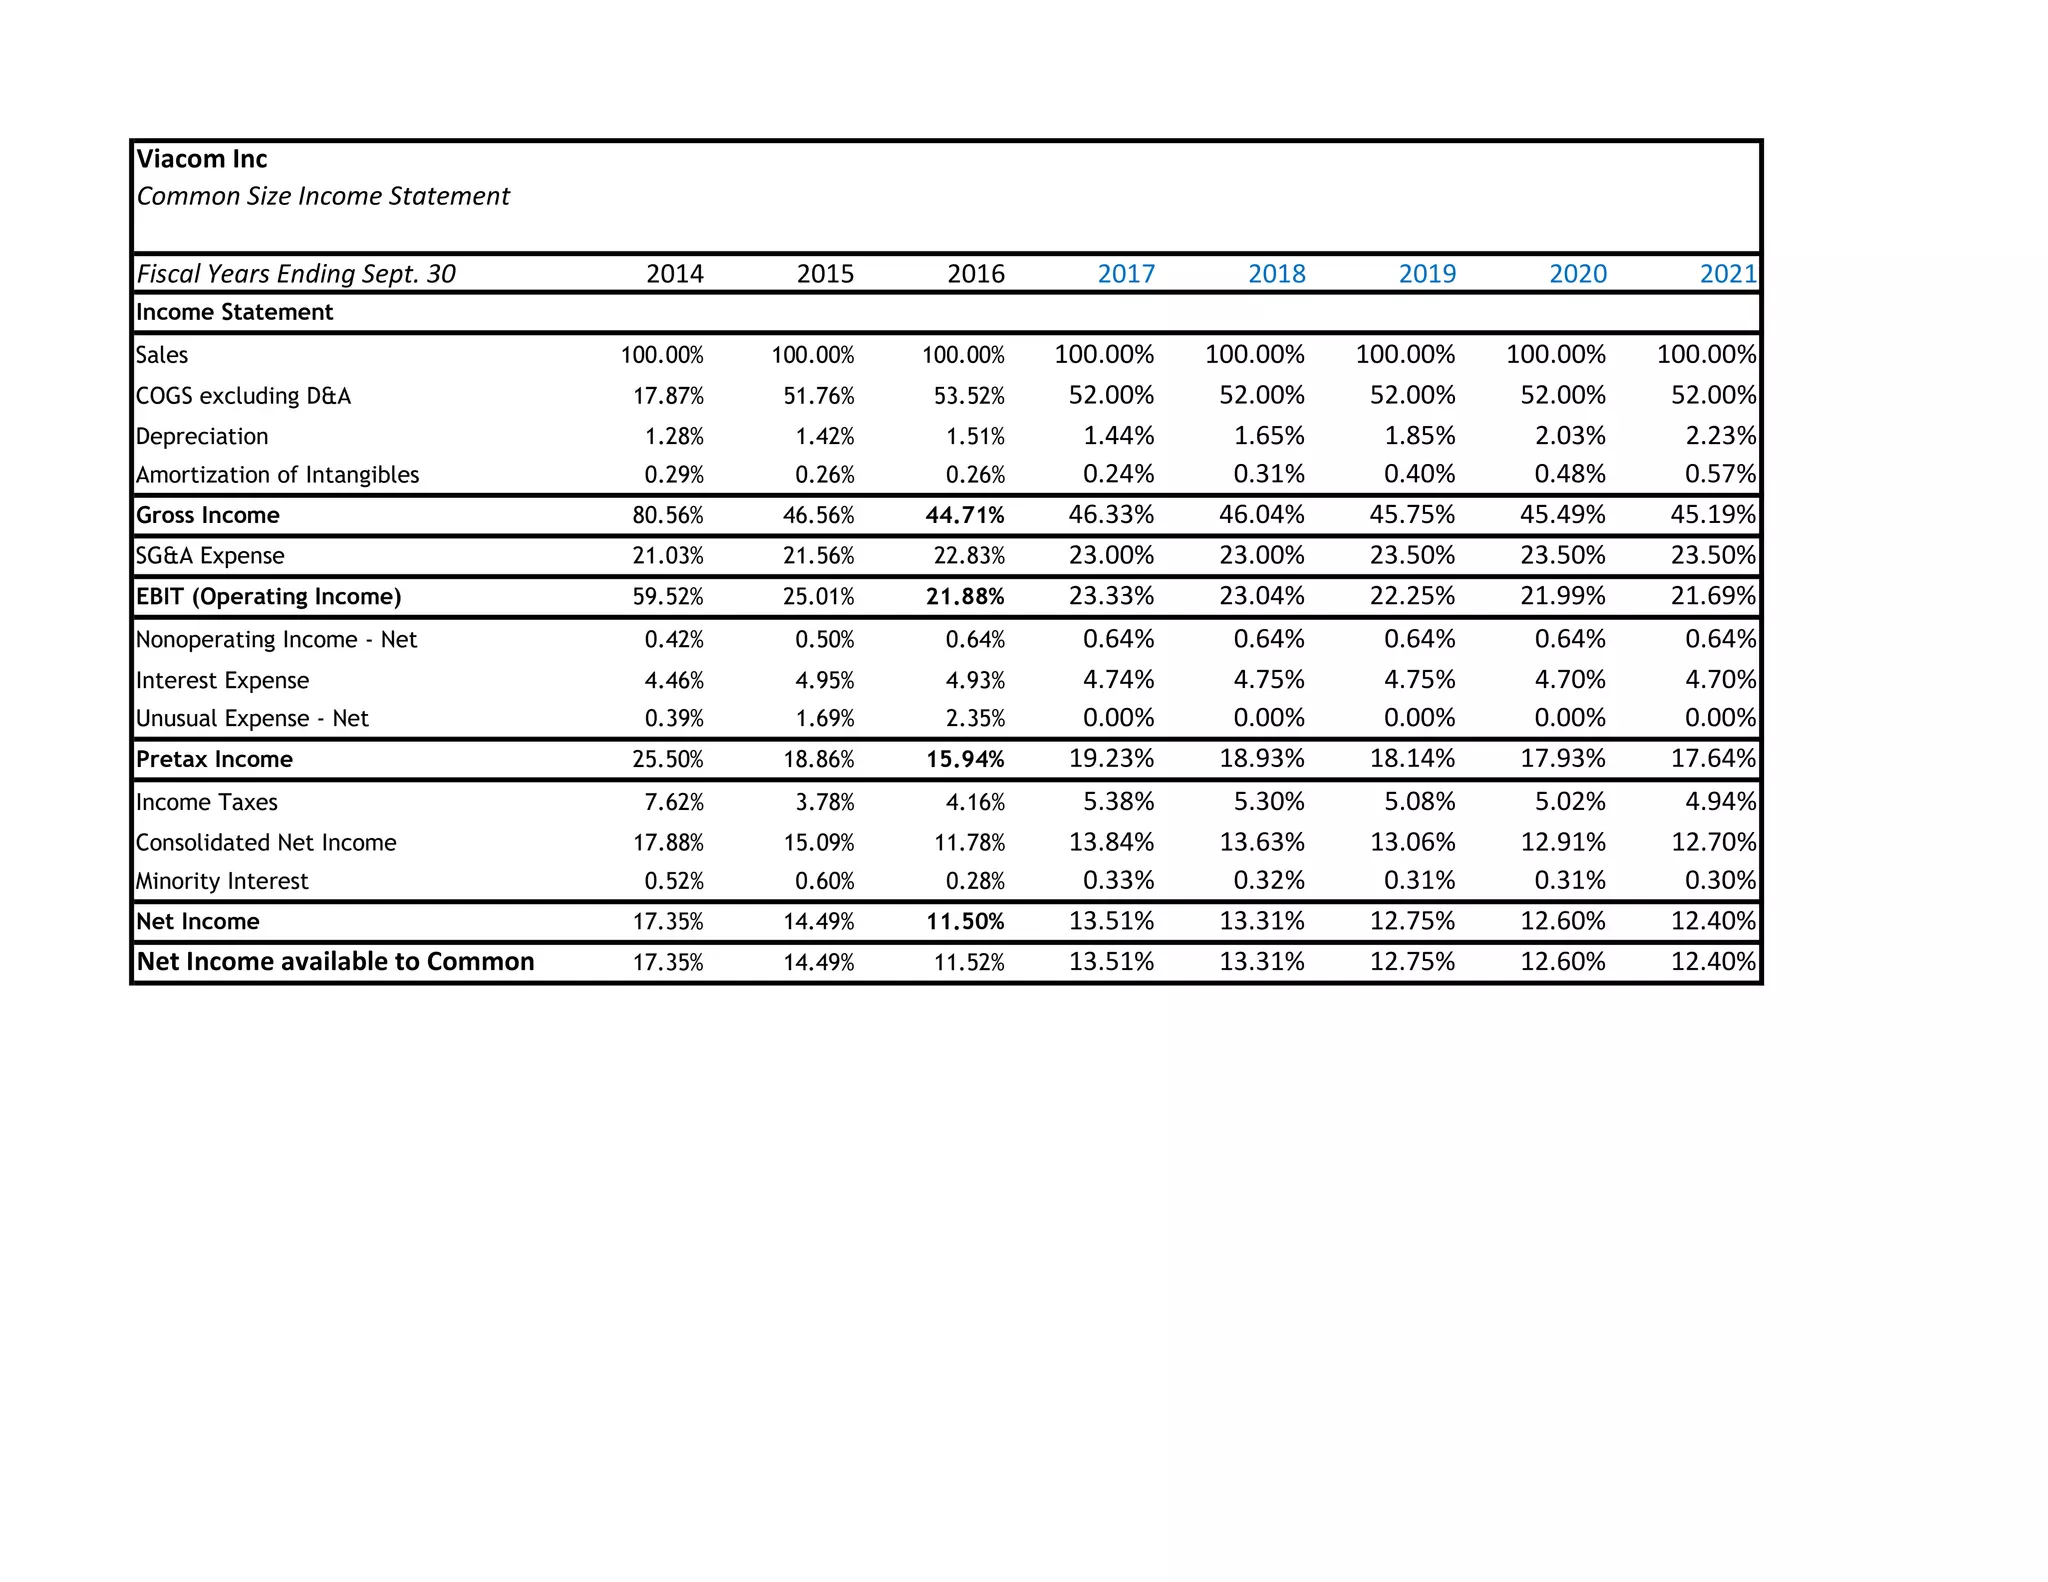
Profitability
Operating Margin 21.88%
Profit Margin 11.50%
Return on Assets (TTM) 6.42%
Return on Equity (TTM) 36.75%
Earnings Estimates
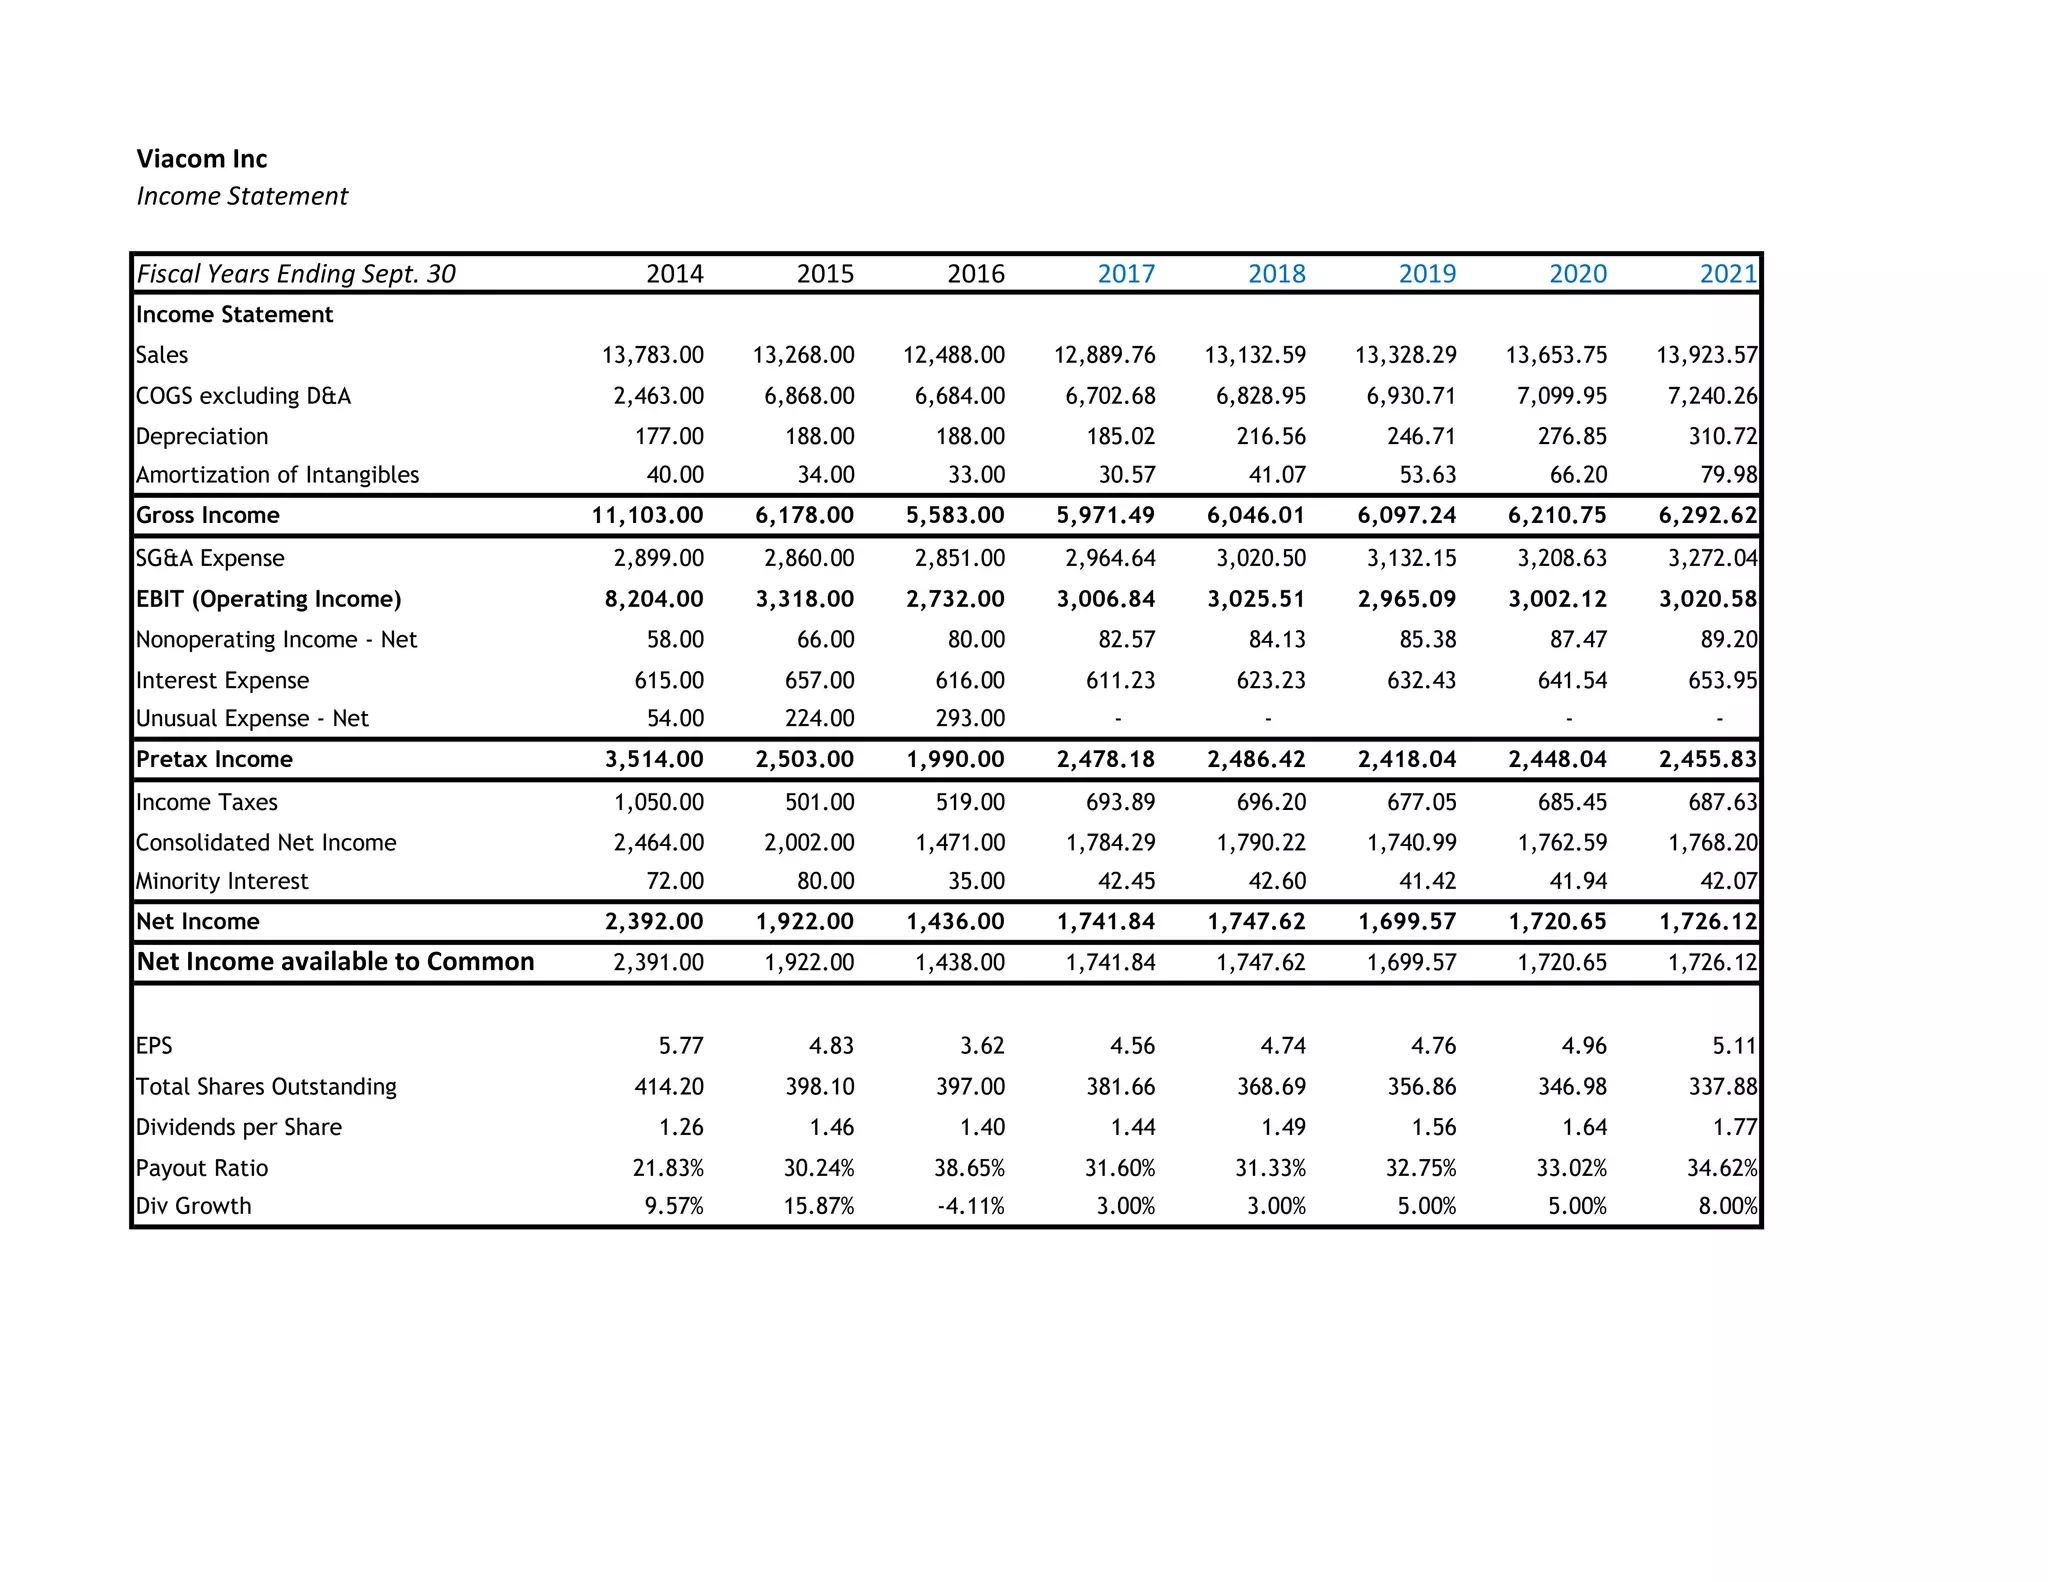
Year 2014 2015 2016 2017E 2018E 2019E
EPS $5.77 $4.83 $3.62 $4.56 $4.74 $4.78
Growth 8.29% -16.36% -24.97% 26.00% 3.86% 0.47%
12 Month Performance Company Description
Viacom Inc. is a media and entertainment
company that operates television channels,
produces content across all kinds of media, and
distributes films. Revenue is generated through
two segments media networks and filmed
entertainment. The company operates numerous
brands and owns many franchises. More than
some of its peers it relies more on marketing and
sees itself as a marketing firm
10.7
6.4
36.7
17.8
10.4
20.3
15.8
6.9
18.618.12
6
20
0
25
50
P/E ROA ROE
VIAB DIS TWX FOXA
Data Source: FactSet
-60%
-50%
-40%
-30%
-20%
-10%
0%
10%
20%
N D J F M A M J J A S O
VIAB S&P 500 TR
Data Source: Factset
2. Page 2
EXECUTIVE SUMMARY
Our recommendation on Viacom Inc. is a buy. The
company has faced some recent trials with a few film
productions doing poorly and a messy split with its former
CEO. The distraction for management is done and the
company can focus on creating broad content offerings
that will sustain it into the future. We have taken
conservative assumptions in valuing the company, and still
see significant upside. There is no indication that the
company’s operations are in a sustained downward trend.
The decline in the share price has been an overreaction.
There are lots of unknowns when it comes to media
companies. They make their money through advertising,
affiliates, and customer purchases. All the revenue boils
down to a product that people want to watch. There is no
way to know if a production will be successful, but all the
costs are borne upfront. This makes their results open to
significant volatility. However, media tends to be a bit
more defensive than other industries. People tend to stay
home and consume content when times are hard, because
a movie or TV is cheaper than traveling or other expensive
hobbies.
Traditional television faces significant pressure, but it is
still surviving. The key thing to look for into the future is
Viacom developing a strong strategy to content with the
disruptive effect of the move to streaming. Other than
that, we are not projecting any major changes to the
business.
Competition is fierce, but nothing can be done about that.
Producing better content is the key to success, and the
audiences will judge. Two good movies from two different
companies will both make money. With DVR and on-
demand even television is no longer restricted by time. In
the past ratings meant something, but since people can
record their shows that matters less now.
The case for Viacom being a buy is a simple one. Even with
little expected growth in media networks and a return to
normal in filmed entertainment, the DCF model is showing
a buy. The market may have reacted too negatively to the
company’s recent travails.
COMPANY DESCRIPTION
Viacom is a global media company that owns and operates
numerous television channels, produces films, and a range
of other content. The two primary segments of the
business are media networks and filmed entertainment.
Under media networks, Viacom owns brands like BET,
MTV, Nickelodeon, Spike, TV Land, and many others.1
Under the filmed entertainment segment brands such as
Paramount and the film version of the network brands.
These are well recognized brands in media. Media
segments is the far larger segment, but probably the one
under the greatest threat. The rise of cord-cutting and
streaming has disrupted the television industry, and the
movie industry is tough to dominate for a variety of
reasons.
Some of Viacom’s Brands:
Source: Viacom Brands
The segments bury a significant truth about Viacom. It is
not a media company that seeks to sell its media products.
78.88%
21.12%
Viacom Revenue Breakdown 2016
Media Networks
Filmed Entertainment
Source: Viacom's 10-k 2016
3. Page 3
It generates much of its revenue from advertising not from
simply selling its content. While this is always true for most
television content, it is also true for films in Viacom’s case.
Media Networks
Media networks are driven almost entirely by advertising
revenue. This makes the segment very cyclical and
extremely competitive. There is some value to generating
content and selling it via physical media or online, but this
is dwarfed by advertising revenue.
Media networks generate revenue by attracting
advertisers due to the number of people watching their
content. However, the other major part of media network
revenues is affiliate fees.2
These are the cut of cable fees
when people subscribe to the channels, like getting the
Comedy Central or Nickelodeon package.
Predicting the advertising spend cycle is very difficult.
Media exhibit some defensive characteristics due to
people staying at home more. Therefore, it is best to pick
a modest trend and continue this, rather than trying to
guess at when spending will be high and low. However,
when advertising spend decreases due to companies
having cash flow issues such as in 2008 it can lead to
cutbacks. Another aspect of the advertising business is the
product placement that happens in all media. Usually
these spots are used to offset production costs in new
shows, and to bring in revenue with popular shows.
Recently the main issue has been the decline in cable
television. Cable has not disappeared and is still a major
industry, but it is in a secular decline.3
Viacom has yet to
leverage online platforms to their full potential, but it is
not too late for this shift to occur.
Filmed Entertainment
Filmed entertainment is even more volatile. It is cyclical,
but by its very nature it is also more volatile. Films are
deficit financed like television shows, but unlike running a
television channel there are not reruns or one-offs to fill
the schedule. Film are large projects whose production is
financed entirely before the first revenue dollar even
comes in. Then there is the additional expense of
marketing the films.
Filmed entertainment includes distribution and
production with variations within those categories. Many
of the films are co-productions with other studios, or
Paramount is simply the distributor. Upfront, high costs
make this an industry where companies spread as much
risk as possible. In theaters, there is not as much incentive
to compete. Rather having different release schedules or
targeting different types of audiences during the same
day.
The money in movies at Viacom is not as high as some
other names. Disney for example makes a lot of money
from ticket sales, but in the whole year Viacom made less
than a billion dollars. Prior years are not broken down, but
revenue has never been that high considering the number
of movies. This is probably due to its role as distributor and
a co-producer, but it also employs a different strategy.
48.37%
45.83%
5.80%
Media Networks Breakdown 2016
Advertising
Affiliate
Ancillary
Source: Viacom's 10-k 2016
22.73%
29.41%
41.32%
6.54%
Filmed Entertainment Breakdown 2016
Theatrical
Home Entertainment
Television License Fees
Ancillary
Source: Viacom's 10-k 2016
4. Page 4
Disney currently uses its outside film offerings to drive
people to their movies. While the shows on Netflix and
television provide some revenue, it is the mega-
blockbusters that Marvel churns out that generate money.
Disney’s animated features somewhat support its
television offerings, but Viacom leverages the ecosystem
far more.4
It has consistently made movies that target
children, then release related shows to drive viewership.
The Madagascar series spawned a television show on
Nickelodeon, which later spawned a movie. It is that
targeting that makes Viacom different from other film
companies. It targets a segment to build an ecosystem
broader than just films, rather than aiming for mass appeal
blockbusters. This targeting also gives it a powerful
marketing channel for companies trying to reach their
audience. Product placement helps offset the costs of
production, and can provide some revenue in established
franchises.
Viacom, via subsidiary Paramount, has often treated its
film business as a potential marketing channel. The shifting
of targeted audiences from film to television through
related media is probably the reason that Viacom has
remained healthy despite the decline in network
television, however growth has become more difficult.
Viacom’s Share Structure
Viacom has both A, VIA, and B, VIAB, shares. The sole
difference is that the A shares are voting and the B shares
are not. Therefore, the A shares trade at a premium. 80%
of the voting shares of Viacom are controlled by National
Amusements a company controlled by Sumner Redstone
and eventually his family trust.
Looking at the historical difference between the value of
Class A and B the divergence is large. At one point the
shares were at parity, and during high volume periods
Class B shares have drifted above Class A shares by a few
cents. The most common gap has been around $1.25, but
recently it has moved to around $3. Since one party
controls 80% of voting shares there is not much value to
holding the remaining voting shares. Even in the event of
a merger with CBS the fairness test will be applied, but
minority holders would not be able to vote en masse to
block a deal to get a higher price if a court rules the existing
terms are fair. The valuation and percentages treat A and
B shares the same, but any reasonable adjustment would
still place Viacom heavily in buy territory.
RECENT DEVELOPMENTS
Viacom has faced some challenges in the last few years
stemming from internal upheaval, and a few missteps in
the filmed entertainment division.
Fiscal Year 2016 Earnings
Viacom just reported their 2016 annual results in
November. The company beat on EPS by $0.04 but missed
on revenue by $70M.5
The miss was due to losses in the
filmed entertainment division. A few projects failed to
deliver large returns, and the company expensed some
items for an upcoming project that was expected to fail.10
Strategic goals going forward include leveraging
technology to improve its advertising. It will also attempt
to take its media network brands international and do
better with appealing to more markets under its existing
brands. Integration between television and film is also
sought, and this should really help bring results back to
growth. However, the model does not project this, so it
would form additional upside.
CBS Bid
Viacom is currently an acquisition/merger target for CBS.
However, this is only in the exploratory phase and nothing
has been detailed yet. CBS is another Redstone family
controlled entity. It has a dual share structure, one voting
and one non-voting, with 80% of the voting shares held by
National Amusements. This is more than coincidence. Ten
years ago, Viacom and CBS split into two entities, both
controlled by National Amusements and Sumner
Redstone. With the difficulties facing traditional television
National Amusements sent a letter advocating a
combination.
If this proposed merger moves into the next stage it will
take quite a bit of time, and likely not yield much of a
premium. Approval will also be slow since the same party
controls both entities. This will trigger what is called the
entire fairness doctrine as described in Golden Cycle, LLC
vs Allen by the Delaware Chancery Court in 1998.6
This doctrine is triggered during a merger or acquisition
when a majority stockholder is on both sides of the
transaction. This rule is designed to prevent minority
shareholder interests. Any deal that will see Viacom and
CBS merge will probably see a lawsuit and a court must
5. Page 5
determine the fairness of the transaction in addition to all
the other approvals required of takeovers.
CBS is facing similar challenges to Viacom, and it may be
similarly undervalued. This is not a case of one very healthy
company buying a company that has stumbled. For this
merger to really benefit shareholders the new company
would need to be far stronger than the two separate
companies. With Viacom so undervalued it might be worth
it to hold onto any shares gained from the transaction.
There may be synergies to be leveraged from the
combination of content libraries and production facilities.
Replacement of Long-Time CEO
The CEO of Viacom Phillipe Dauman was replaced in
August 20, 2016 after an acrimonious court battle with the
head of the company that controls the voting shares of
Viacom Sumner Redstone. The crux of the issue was that
Dauman believed that Sumner Redstone was no longer
capable of making decisions and his daughter Shari was
controlling him, which his will indicated was what he did
not want. This is just another example of family and
personal disputes spilling into the public sphere due to the
tight control of voting shares by one family. If this situation
with control were ever to change, it would be a major
boost to the company.
Since that family controls 80% of the voting shares the
escapades of the Redstone’s have frequently become an
issue hanging over the head of Viacom. Headlines aside
this has always been the case, but if Viacom’s ownership
structure ever changed it would be a positive. This drama
at the top has created an opportunity in the stock. Dauman
was also one of the highest paid CEOs in America with
about $85M on average between 2011-2015.7
His
replacement will not be paid as much, so there are some
savings to be had there.
INDUSTRY TRENDS
The media industry by its very nature is on the forefront of
technology, culture, and globalization. There are many
sweeping changes facing the industry. Some are recent,
and some have been going on for some time now.
Shift to Streaming
In the last few years streaming has taken off as the primary
way for people to consume their content. This is especially
true for the young, which will define the future for many
more years to come. Netflix, Hulu, Amazon Prime, and
iTunes have changed the field, but those have been picking
away at television’s base for many years. These companies
have also turned to generating their own content,
competing with traditional media more directly.
The television channels have tried to stem this tide.
Companies like Sling TV try to blur the line between
television and Internet streaming by bringing traditional
television streaming through the web. However, the
offerings, features, and cost of these programs leaves
much to be desired. Very little of the shift is driven by cable
versus the Internet, and their strategies seem to be
missing the point. The shift is driven by immediate
consumption without interruption for a reasonable price.
Cable costs too much, and more and more people are
cutting the cord, but that does not mean they are moving
to Sling TV. They are moving to on-demand streaming, not
just streaming.
This trend is the biggest threat the media network
revenues, which is the largest group of revenues. There is
some exposure in the filmed entertainment segment due
to a decrease in licensing fees for television movies, but
this can be made up with licenses with streaming
companies. Media networks on the other hand is driven by
advertising and that is dependent on the number of
people. Licensing fees currently would not offset this
decline. The audience for television is shrinking. Movies
are still big draws and box offices have continued to grow,
but on the small screen everything is moving online.
Global Markets
Movies have become very expensive to produce, though
Viacom does not do many of these. This expense has
6. Page 6
caused international markets to become very important to
the viability of movies.8
In the past doing well in the US box
office was enough. Now it is not enough. That means that
movies should have broad appeal to many types of
audiences. Some of the recent movies released by
Paramount have struggled. This could be due to their
narrow focus on mostly the domestic market, but it is
competing against major franchises with broad appeal and
an established fan base.
Viacom has not created many franchises other than a few
children’s movies. Its role as a distributor also means it
comes in far later in the production cycle. It also creates
increased competition as there are many global
distributors, and simply focusing on the American market
is not as lucrative as it once was.
MARKETS AND COMPETITION
The media industry is completely fragmented with players
of all sizes and partnerships that form and dissolve on a
regular basis. Two companies working on the same
production may have projects that directly compete later.
There are tiny independent studios, some of which form
for one project, and there are mega studios like Marvel
that produce numerous movies. Early in the cycle of the
Marvel movies Paramount was a distributor, before Disney
took over.
On the film and media production side the industry is full
of players. The television channels do compete in a more
traditional way. Channels compete against one another to
grab the most viewers in the target demographic.
Broadcast television tries to capture the broadest
audience, while network TV can be more specific.
Competition
The competition in this industry across all the segments is
very simple. Attract the most people to your product. This
is done by producing quality material, making it readily
available, and marketing it well. With movies, the goal is to
sell tickets, DVDs, licenses, and merchandise. When done
well a franchise can be created that has numerous media
products and potentially other entertainment products to
perpetuate the concept into the future.
An ideal situation would be obtaining a place in the minds
of the public with a franchise. A recognizable and beloved
idea can always be relied on to generate revenue to the
extent that care is taken. Despite the negative reviews
Teenage Mutant Ninja Turtles remains a profitable
franchise, eventually more movies well be made. The
upcoming Power Rangers movie is based on a show that is
going on 25 years, and if successful will likely revitalize the
television business.
Television is about attracting viewers to increase revenue
from advertising. Slots are sold to advertisers. Lots of
viewers for a show generates a lot of ad revenue. A show
with very strong demographic numbers can attract
valuable targeted advertising dollars, which are more per
viewer. This is the most well-known form of revenue for
television channels.
The other source is affiliate payments, which are primarily
for network television. When a cable subscriber has a
channel in their plan that channel gets a payment. This
varies based on whether the channel is a common offering,
a premium channel, etc.
All the companies are competing for the interest of the
population. Competition is very high and fierce, but
success depends on quality. A slick marketing campaign
can get viewers onto a new show, but it cannot save a
terrible show.
Source: www.the-numbers.com/market/distributor/paramount-
pictures
Year Movies Market Share Gross
1995 21 9.97% 529,884,404.00$
1996 24 12.80% 740,924,146.00$
1997 27 13.99% 889,415,108.00$
1998 19 15.46% 1,046,011,656.00$
1999 21 11.56% 848,754,297.00$
2000 19 10.42% 785,491,260.00$
2001 18 11.02% 914,413,744.00$
2002 25 7.35% 673,939,881.00$
2003 23 7.11% 653,849,399.00$
2004 18 6.73% 624,885,940.00$
2005 17 9.32% 821,959,361.00$
2006 19 10.30% 947,010,659.00$
2007 21 15.38% 1,502,551,245.00$
2008 17 16.38% 1,602,712,839.00$
2009 16 13.72% 1,460,075,602.00$
2010 18 16.44% 1,727,156,249.00$
2011 23 19.31% 1,966,886,567.00$
2012 22 8.47% 933,803,997.00$
2013 15 9.01% 981,549,932.00$
2014 17 9.92% 1,027,851,276.00$
2015 17 6.17% 697,086,594.00$
2016 14 6.93% 655,775,020.00$
Year by Year Market Share
7. Page 7
Peer Comparisons
It is important when doing peer comparisons to keep the
stuff above in mind. So much of a company’s success is
dependent on creative matters, and the ability to execute
on a good idea. Capital constraints are why these
companies make deals with each other. Spreading the risk
is safer than going it alone in all cases, especially when
upfront costs get large.
While television stations still compete with one another,
DVR and streaming means that quality always wins out.
There is a lot of market to be had. People are consuming
more and more content, and there is no brand loyalty.
People will watch everything they enjoy.
Debt and Liquidity
Long-Term
Debt ($M)
Current
Ratio
Quick
Ratio
Viacom 11,913 1.23 1.00
Time Warner 24,471 1.76 1.51
Disney 16,674 0.91 0.83
Discovery 7,926 1.76 1.76
21st
Century Fox 19,488 2.01 1.57
Source: Factset
Liquidity is not a risk for Viacom. These media companies
do not have high CapEx or other expenses. Most costs are
associated with producing the content. These expenses
are high risk, since they are upfront in their entirety.
Disney is a bit different because it is a conglomerate with
many kinds of businesses.
Margins
Net
Margins
Operating
Margins
PE
Viacom 11.5% 21.9% 10.69
Time Warner 15.6% 25.8% 15.84
Disney 16.6% 25.7% 17.76
Discovery 17.1% 32.4% 15.46
21st
Century Fox 10.5% 22.5% 18.12
Source: Factset
Margins for these companies vary greatly due to the
nature of their business. Viacom’s margins have been hurt
by the recent weakness in its filmed entertainment
business. From the PE ratio, we can see how the recent
events at Viacom have impacted the share price relative to
its peers. While Viacom has experienced some weakness,
it has not seen a very dramatic decrease in EPS.
Returns and Free Cash
ROA ROE Free Cash
Margin
Viacom 6.4% 36.7% 9.6%
Time Warner 6.9% 18.6% 13.8%
Disney 10.4% 20.3% 14.1%
Discovery 7.0% 20.4% 22.3%
21st
Century Fox 6.0% 20.0% 14.6%
Source: Factset
Viacom’s cash flows have suffered recently. A few years
ago, the company authorized a $20Bn repurchase plan,
and it made use of this to buy back shares this last year.
This has boosted its ROE.
ECONOMIC OUTLOOK
The media industry shows some defensive characteristics,
because when the economy is weak people stay in and
watch TV or stream movies. While plenty of people
complain about the price of movie tickets it is cheaper than
a trip. The real issue is when corporate earnings weaken
and they cut down on advertising spending. Usually this
leads to declines in revenue not the absence of them.
Television always has commercials.
We expect the economy to remain strong in the next few
years. Box offices have continued to grow. The companies
are breaking into more markets. For English language
content the market is becoming much more global.
While the market will continue to expand that just means
more companies can come in to fill the demand. Even with
large amounts of capital doing too many productions at
once poses serious risk. Directors, actors, editors, post-
production specialists, and other professionals are not
endless. There is also limited time, and there is little
incentive to compete head to head on every occasion.
So, there are no specific macroeconomic issues that should
be of concern. The recent low debt environment has
allowed firms to take on debt to finance more product
themselves, because they will accrue more of the benefit.
However, the low rate environment created this demand.
For Viacom, which does not run a cable service just
channels, it does not need to rely on debt in the future for
CapEx. One of the bigger drivers will be increasing wealth
in emerging markets, which would open more markets and
expand existing ones.
8. Page 8
VALUATION
Revenue Growth
Revenues are extremely unpredictable in this industry.
While there are certain predictable revenues from the
media networks business the filmed entertainment branch
is subject to the market’s reaction to the product.
Estimates can be made on sequels and related movies, but
brand new movies are inherently unpredictable.
When it comes to modeling the growth rates, we chose to
use analyst averages and adjusted them downward. As this
is not a current holding we feel this cautious approach will
yield the clearest signal. Media networks are projected to
grow at 1.5% next year, right around inflation levels, and
move down to 0.5%.
Verizon’s Revenue Growth
2014 -0.08%
2015 -3.74%
2016 -5.88%
Source: Viacom 2016 10-K
Filmed entertainment is trickier. The last few years has
seen revenue decline due to a variety of factors. Some are
due to missteps, and some are due to the former CEO
Dauman’s plans for the movie segment. Viacom got
involved in some high-quality projects such as The Big
Short and Interstellar before that. These films just tend to
be outside their normal space. Children’s movies push
viewers to their media network properties, and generate
follow-up short films, DVDs, and licensed products.
While Interstellar and The Big Short were high quality
pictures they had niche audiences and were not something
Viacom could continue to leverage. They were only
distributor, but they could easily make a partnership to do
more. In addition to that subtle shift a few of the recent
movies did not bring in much revenue. The segment has
seen a decline from over $4bn a few years ago, to between
$2-3bn now. We project the revenue next year will grow
7%, simply to bring them into line with the company’s size
and general performance. It remains conservative relative
to analysts.
The effect of these growth numbers boils down to 2012
and 2021, the end of our forecast, having revenues that
are very close $13,887M and $13,923M respectively. This
is one of the reasons we are confident in our buy
recommendation, though not necessarily the exact price.
Cost of Goods Sold
This is extremely difficult to estimate for most things.
Production costs are upfront and fixed once done. A major
blockbuster does not cost more due to being a major
blockbuster, after the fact. The expectation of major
success can increase spending, but this is not guaranteed.
If a production cost $100M, then the cost of goods sold
changes based on whether it makes $50M or $300M. Each
production is different, and the success of one does not
affect another. The same is true of television. The success
of an MTV show does not determine the success of a
Nickelodeon show.
For reference, when filmed entertainment did well and
generated profits for the company COGS as a percentage
of revenue was 17.87%. In 2015 that number was 51.76%,
and in 2016 it was 53.52%. Erring on the side of caution
again we chose 52% for COGS, which gives tremendous
opportunity if the next few films do well.
Selling, General, and Administrative Expense
SG&A expense does not vary much from year to year. We
fix ours at the high end of the small range at 23% and move
that up to 23.50% later in forecast due to the eventual
online push the company will make.
-25.00%
-20.00%
-15.00%
-10.00%
-5.00%
0.00%
5.00%
10.00%
2014 2015 2016 2017E 2018E 2019E 2020E 2021E
Revenue Growth Rates
Media
Networks
Filmed
Entertainment
Total Revenue
Growth
Source of Historical Data: Viacom 10-k 2016, 2015, 2014
9. Page 9
Other
There are no significant CapEx assumptions, nor other
major cost assumptions. We keep the same debt structure
anticipating that the recent missteps will push reducing
debt off into the future. We do not project any buybacks
beyond the $4.9B currently left on their authorization.9
Continuing Growth Assumptions
We assume that the company continues growing at 1%,
which is below expected inflation. This is due to increased
competition since barriers to entry are even lower on the
Internet. Then there is the long-term decline in television.
The cautiousness of the assumption also gives strength to
the buy recommendation.
Alternative Valuation
Relative PE gives a valuation of $51.42 and the dividend
discount model gives a price of $43.94. You can adjust
these for the class B shares, the recent year has seen a
premium of over $4 for the class A shares over the B.
However, historically this premium has shrunk down to $1
or $2 or disappeared altogether.
Since the largest shareholder controls 80% of the voting
shares there is no reason to give those shares a premium.
Even owning all of them would not give significant power
to affect the direction of the company. Both valuation
methods confirm the buy rating. This can change to a hold
with upside depending on the premium knocked off for
nonvoting shares, but if there is upside after all that it
makes the recommendation a safe one.
Implied Value:
Relative P/E (EPS17) $ 51.42
Relative P/E (EPS18) $ 61.02
PEG Ratio (EPS17) $ 20.50
PEG Ratio (EPS18) $ 24.38
Data for Estimates: FactSet
For Verizon, the DCF or the dividend discount model can
be used. The issue with the dividend discount model is the
same as the one with the relative PE. There is too much
reliance on the calculated EPS numbers in the model.
Compared to analysts, the model’s EPS numbers are far
lower, despite having higher revenues. Relative PE has a
problem with outliers like US Cellular with a 2016 PE
estimate of 76.6. Compared to AT&T, similar size and
business, and Comcast, similar size, Verizon is more fairly
valued in relative terms.
KEYS TO MONITOR
An eye needs to be kept on media network revenue.
Significant declines would change the recommendation. A
decline is factored into the recommendation, but not very
fast decline. Also, if Viacom does not come up with an
online strategy or platform it would endanger its viability
in the future and the recommendation would change.
More missteps in filmed entertainment would bring into
question the effectiveness of management even if they
were not enough to really change the model. There is also
the issue of family control. If more personality issues affect
the business it might be better to sit out Viacom.
The details of the CBS merger will also be important going
forward. If CBS acquires Viacom and there is a solid
premium it might be worth selling the stock to take the
benefit. Viacom and CBS are struggling with the changes in
their industry so it might be better to avoid them for now.
REFERENCES
1. Viacom Brands -
http://www.viacom.com/brands/pages/default.aspx
2. Viacom Affiliate Fees -
http://www.wikinvest.com/stock/Viacom_(VIA)/Affili
ate_Fees
3. Traditional TV just got bashed by an influential expert
- Business Insider -
http://www.businessinsider.com/traditional-tv-is-in-
decline-2015-8
4. Viacom Is a Buy: It's Cheap and The Market
Misunderstands Its Business - SeekingAlpha -
http://seekingalpha.com/article/4007614-viacom-
buy-cheap-market-misunderstands-business
5. 4Q2016 Earnings Call Transcript - SeekingAlpha -
http://seekingalpha.com/article/4021668-viacoms-
viab-ceo-tom-dooley-q4-2016-results-earnings-call-
transcript
6. GOLDEN CYCLE, LLC V. ALLEN, 16301 (DEL.CH. 1998) -
Case Text - https://casetext.com/case/golden-cycle-
llc-v-allen
10. Page 10
7. Viacom CEO paid more than you think: Expert - CNBC
- http://www.cnbc.com/2016/02/09/viacom-ceo-
paid-more-than-you-think-expert.html
8. 2016 Entertainment & Media Industry Trends - PwC -
http://www.strategyand.pwc.com/perspectives/2016
-entertainment-media-industry-trends
9. Viacom 2016 10-k -
http://ir.viacom.com/secfiling.cfm?filingID=1339947-
16-110&CIK=1339947
10. ‘Monster Trucks’ Drove Viacom’s $115M Charge Even
Before Its Release – Deadline Hollywood -
http://deadline.com/2016/09/monster-trucks-drove-
viacom-115m-charge-before-release-1201824353/
IMPORTANT DISCLAIMER
Henry Fund reports are created by student enrolled in the
Applied Securities Management (Henry Fund) program at
the University of Iowa’s Tippie School of Management.
These reports are intended to provide potential employers
and other interested parties an example of the analytical
skills, investment knowledge, and communication abilities
of Henry Fund students. Henry Fund analysts are not
registered investment advisors, brokers or officially
licensed financial professionals. The investment opinion
contained in this report does not represent an offer or
solicitation to buy or sell any of the aforementioned
securities. Unless otherwise noted, facts and figures
included in this report are from publicly available sources.
This report is not a complete compilation of data, and its
accuracy is not guaranteed. From time to time, the
University of Iowa, its faculty, staff, students, or the Henry
Fund may hold a financial interest in the companies
mentioned in this report.
18. Viacom Inc
Value Driver Estimation
Fiscal Years Ending Sept. 30 2014 2015 2016 2017E 2018E 2019E 2020E 2021E
Sales 13,783.00 13,268.00 12,488.00 12,889.76 13,132.59 13,328.29 13,653.75 13,923.57
COGS excluding D&A 2,463.00 6,868.00 6,684.00 6,702.68 6,828.95 6,930.71 7,099.95 7,240.26
Depreciation 177.00 188.00 188.00 185.02 216.56 246.71 276.85 310.72
Amortization of Intangibles 40.00 34.00 33.00 30.57 41.07 53.63 66.20 79.98
SG&A 2,899.00 2,860.00 2,851.00 2,964.64 3,020.50 3,132.15 3,208.63 3,272.04
+PV of Interest on Op Leases 64.80 68.77 71.63 67.51 69.68 70.99 72.05 73.81
EBITA 8,268.80 3,386.77 2,803.63 3,074.35 3,095.20 3,036.08 3,074.17 3,094.39
106.95% -59.04% -17.22% 9.66% 0.68% -1.91% 1.25% 0.66%
Pre Tax Income 3,514.00 2,503.00 1,990.00 2,478.18 2,486.42 2,418.04 2,448.04 2,455.83
Total Income Tax Provision (inc. tax) 1,050.00 501.00 519.00 693.89 696.20 677.05 685.45 687.63
Tax Rate = Pre Tax/Total Inc. Provision. 29.88% 20.02% 26.08% 28.00% 28.00% 28.00% 28.00% 28.00%
Plus Tax Shield on Interest Expense 183.76 131.50 160.66 171.15 174.50 177.08 179.63 183.11
Plus Tax on Lease Interest 19.36 13.77 18.68 18.90 19.51 19.88 20.17 20.67
Plus Tax Shield on Amortized Goodwill 16.14 44.84 76.42 - - - - -
Minus Tax on Non-Operating Income (Plus
in this formula) (Nonop Int. Income+Other
Inc)
17.33 13.21 20.86 23.12 23.56 23.91 24.49 24.98
Less Adjusted Taxes 1,251.93 677.90 753.89 860.82 866.65 850.10 860.77 866.43
Plus Change in Deferred Taxes (383.00) (43.00) 158.00 (381.00) - - - -
Equals NOPLAT 6,633.86 2,665.88 2,207.74 1,832.54 2,228.54 2,185.98 2,213.40 2,227.96
NOPLAT Growth % 149.81% -59.81% -17.19% -17.00% 21.61% -1.91% 1.25% 0.66%
Normal Cash (2% * Sales) 275.66 265.36 249.76 257.80 262.65 266.57 273.08 278.47
Short-Term Receivables 3,066.00 2,807.00 2,712.00 2,799.25 2,851.98 2,894.48 2,965.16 3,023.76
Inventory 846.00 786.00 844.00 871.15 887.56 900.79 922.79 941.02
Other Current Assets 340.00 559.00 587.00 605.88 617.30 626.50 641.80 654.48
Operating Current Assets 4,527.66 4,417.36 4,392.76 4,534.08 4,619.50 4,688.34 4,802.82 4,897.73
Accounts Payable 475.00 506.00 453.00 467.57 476.38 483.48 495.29 505.08
Non Interest-Bearing Current Liabilities 741.00 729.00 834.00 467.57 476.38 483.48 495.29 505.08
Net Operating Working Capital 3,786.66 3,688.36 3,558.76 4,066.51 4,143.12 4,204.86 4,307.54 4,392.66
Plus Net PPE 1,016.00 947.00 932.00 1,090.88 1,242.76 1,394.56 1,565.15 1,735.32
PV of Operating Leases 1,343.20 1,399.08 1,318.56 1,360.98 1,386.62 1,407.28 1,441.65 1,470.13
Net Other Intangibles 399.00 340.00 315.00 423.15 552.52 682.09 824.02 967.07
Other Assets 4,088.00 3,760.00 4,207.00 4,342.35 4,424.15 4,490.08 4,599.72 4,690.62
Plus Net Other Operating Assets 5,830.20 5,499.08 5,840.56 6,126.47 6,363.29 6,579.45 6,865.39 7,127.83
Less other Liab. (BS line items) 3,442.00 3,330.00 3,202.00 3,305.01 3,367.28 3,417.45 3,500.91 3,570.09
Invested Capital 7,190.86 6,804.44 7,129.32 7,978.85 8,381.89 8,761.42 9,237.17 9,685.72
WACC 7.00% 7.00% 7.00% 7.00% 7.00% 7.00% 7.00% 7.00%
NOPLAT 6,633.86 2,665.88 2,207.74 1,832.54 2,228.54 2,185.98 2,213.40 2,227.96
Beg Invested Capital 6,776.42 7,190.86 6,804.44 7,129.32 7,978.85 8,381.89 8,761.42 9,237.17
End Invested Capital 7,190.86 6,804.44 7,129.32 7,978.85 8,381.89 8,761.42 9,237.17 9,685.72
ROIC (NOPLAT/Beg IC) 97.90% 37.07% 32.45% 25.70% 27.93% 26.08% 25.26% 24.12%
FCF (NOPLAT - Change in IC) 6,219.43 3,052.29 1,882.87 983.01 1,825.50 1,806.46 1,737.65 1,779.42
EP (Beg IC * (ROIC-WACC)) 6,159.69 2,162.70 1,731.61 1,333.67 1,670.23 1,599.47 1,600.33 1,581.60
19. Viacom Inc
Weighted Average Cost of Capital (WACC) Estimation
2016
Risk Free Rate (30yr T-Bond as of 9/9/16) 3.01%
Market Risk Premium (Henry Fund Team Choice) 5.00%
Beta (Bloomberg) 1.400
Cost of Equity (Risk Free + (Beta * Mkt Risk) 10.01%
Cost of Debt (From Bond Maturity: 08/21/2046) 5.12%
Cost of Preferred Shares 0
Marginal Tax Rate (Effective) 28.00%
Total Shares Outstanding 397.00
Price $37.77
Mkt Value of Equity ( E ) 14,994.69$
FMV of Debt 11,820.81$
Operating Leases (PV) 1,318.56$
Underfunded Pension Liabilities 504.00$
Mkt Value of Debt ( D ) 13,643$
Mkt Value of Preferred (Pfd) -$
Mkt Value of Firm (E+D+PfD) (V) 28,638.06$
Equity Portion of WACC (Cost of Equity * E/V) 5.24%
Debt Portion of WACC (cost of Debt* (1-t) * D/V) 1.76%
Preferred Portion of WACC (Cost of Preferred * Pfd/V) -$
WACC 7.00%
20. Viacom Inc
Discounted Cash Flow (DCF) and Economic Profit (EP) Valuation Models
Key Inputs:
CV NOPLAT Growth 1.00% Beg IC 2017 7,129.32
CV ROIC 24.12% Shares Outstanding 381.66
WACC 7.00%
Cost of Equity 10.01%
Fiscal Years Ending Sept. 30 2017E 2018E 2019E 2020E 2021E CV (End of 2021/Beg 2022)
DCF Model
NOPLAT 1,832.54 2,228.54 2,185.98 2,213.40 2,227.96
Beg IC 7,129.32 7,978.85 8,381.89 8,761.42 9,237.17
End IC 7,978.85 8,381.89 8,761.42 9,237.17 9,685.72
ROIC 25.70% 27.93% 26.08% 25.26% 24.12%
DCF CV (NOPLAT*(1- g/ROIC)/(WACC-g)) 35,608.65
FCF (NOPLAT - Change in IC) 983.01 1,825.50 1,806.46 1,737.65 1,779.42
PV of FCF 918.72 1,594.54 1,474.72 1,325.77 1,268.85 25,391.57
V of Oper (Sum of PV of FCF) 31,974.17
Cash (81.90)
Normal Cash (Sales * Normal Cash %) (2%) 257.80
Excess Cash (Cash-Normal Cash) -
Minority Interests (- V of Other) (264.00)
Long Term Investments 986.70
V of Non-Oper 722.70
-V of Debt = FMV of Debt (From WACC sheet) 13,643.37
-PV of ESOP 113.39
V of Equity 18,940.10$
Shares Outstanding 381.66
Target Price (V of Equity/Shares) 49.63$
To Today's Value 52.68$
EP Model
NOPLAT 1,832.54 2,228.54 2,185.98 2,213.40 2,227.96
Beg IC 7,129.32 7,978.85 8,381.89 8,761.42 9,237.17
End IC 7,978.85 8,381.89 8,761.42 9,237.17 9,685.72
ROIC 25.70% 27.93% 26.08% 25.26% 24.12%
EP CV 26,371.48
EP (Beg IC * (ROIC-WACC)) 1,333.67 1,670.23 1,599.47 1,600.33 1,581.60
Discounted EP 1,246.45 1,458.91 1,305.74 1,221.00 1,127.80 18,485.13
V of Oper (Beg IC 2015 + Sum of PV of EP) 31,974.35
V of Non-Oper 722.70
-V of Debt = FMV of Debt (From WACC sheet) 13,643.37
-PV of ESOP 113.39
V of Equity 18,940.29$
Shares Outstanding 381.66
Target Price (V of Equity/Shares) 49.63$
To Today's Value 52.68$