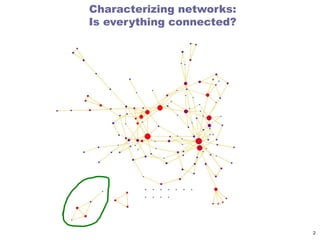
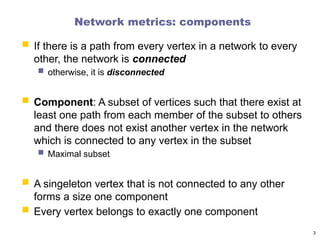
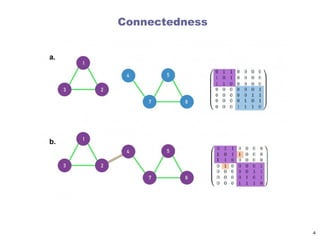
Network metrics: components
If there is a path from every vertex in a network to every
other, the network is connected
otherwise, it is disconnected
Component: A subset of vertices such that there exist at
least one path from each member of the subset to others
and there does not exist another vertex in the network
which is connected to any vertex in the subset
Maximal subset
A singeleton vertex that is not connected to any other
forms a size one component
Every vertex belongs to exactly one component
3
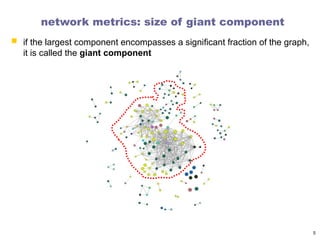
network metrics: sizeof giant component
if the largest component encompasses a significant fraction of the graph,
it is called the giant component
5
6.
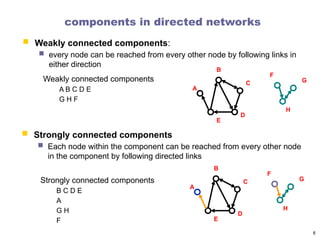
components in directednetworks
A
B
C
D
E
F
G
H
Weakly connected components
A B C D E
G H F
6
Strongly connected components
Each node within the component can be reached from every other node
in the component by following directed links
Strongly connected components
B C D E
A
G H
F
Weakly connected components:
every node can be reached from every other node by following links in
either direction
A
B
C
D
E
F
G
H
7.
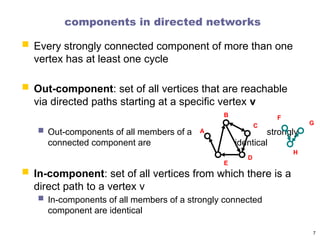
components in directednetworks
Every strongly connected component of more than one
vertex has at least one cycle
Out-component: set of all vertices that are reachable
via directed paths starting at a specific vertex v
Out-components of all members of a strongly
connected component are identical
In-component: set of all vertices from which there is a
direct path to a vertex v
In-components of all members of a strongly connected
component are identical
7
A
B
C
D
E
F
G
H
8.
bowtie model ofthe web
The Web is a directed graph:
webpages link to other webpages
The connected components tell us what set of pages can
be reached from any other just by surfing
no ‘jumping’ around by typing in a URL or using a search engine
Broder et al. 1999 – crawl of over 200 million pages and
1.5 billion links.
SCC – 27.5%
IN and OUT – 21.5%
Tendrils and tubes – 21.5%
Disconnected – 8%
8
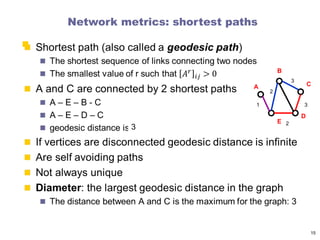
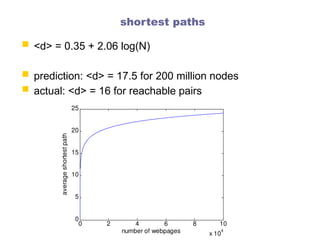
Network metrics: paths
A path is any sequence of vertices such that every
consecutive pair of vertices in the sequence is
connected by an edge in the network.
For directed: traversed in the correct direction for the edges.
path can visit itself (vertex or edge) more than once
Self-avoiding paths do not intersect themselves.
Path length r is the number of edges on the path
Called hops
10
11.
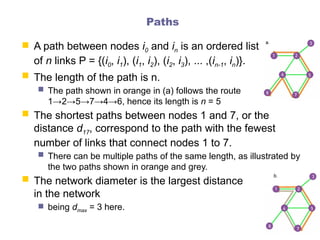
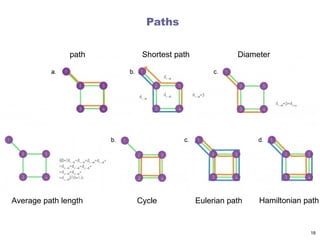
Paths
A pathbetween nodes i0 and in is an ordered list
of n links P = {(i0, i1), (i1, i2), (i2, i3), ... ,(in-1, in)}.
The length of the path is n.
The path shown in orange in (a) follows the route
1→2→5→7→4→6, hence its length is n = 5
The shortest paths between nodes 1 and 7, or the
distance d17, correspond to the path with the fewest
number of links that connect nodes 1 to 7.
There can be multiple paths of the same length, as illustrated by
the two paths shown in orange and grey.
The network diameter is the largest distance
in the network
being dmax = 3 here.
12.
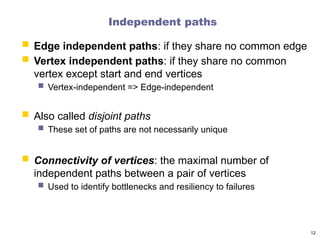
Independent paths
Edgeindependent paths: if they share no common edge
Vertex independent paths: if they share no common
vertex except start and end vertices
Vertex-independent => Edge-independent
Also called disjoint paths
These set of paths are not necessarily unique
Connectivity of vertices: the maximal number of
independent paths between a pair of vertices
Used to identify bottlenecks and resiliency to failures
12
13.
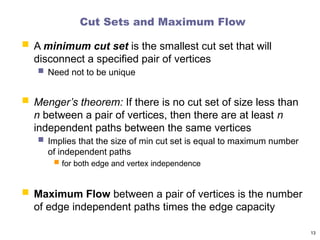
Cut Sets andMaximum Flow
A minimum cut set is the smallest cut set that will
disconnect a specified pair of vertices
Need not to be unique
Menger’s theorem: If there is no cut set of size less than
n between a pair of vertices, then there are at least n
independent paths between the same vertices
Implies that the size of min cut set is equal to maximum number
of independent paths
for both edge and vertex independence
Maximum Flow between a pair of vertices is the number
of edge independent paths times the edge capacity
13
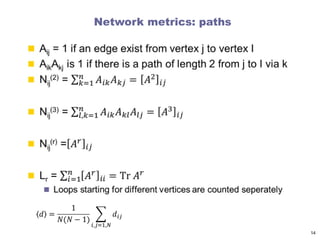
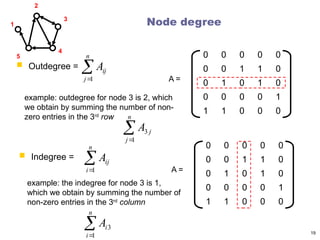
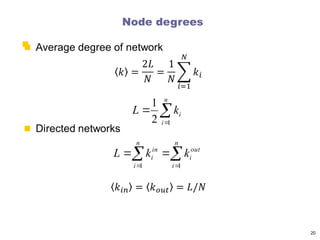
Node degree
Outdegree=
0 0 0 0 0
0 0 1 1 0
0 1 0 1 0
0 0 0 0 1
1 1 0 0 0
A =
n
j
ij
A
1
example: outdegree for node 3 is 2, which
we obtain by summing the number of non-
zero entries in the 3rd
row
Indegree =
0 0 0 0 0
0 0 1 1 0
0 1 0 1 0
0 0 0 0 1
1 1 0 0 0
A =
n
i
ij
A
1
example: the indegree for node 3 is 1,
which we obtain by summing the number of
non-zero entries in the 3rd
column
n
i
i
A
1
3
n
j
j
A
1
3
1
2
3
4
5
19
Degree sequence andDegree frequency
Degree sequence: An ordered list of the (in,out) degree of each node
In-degree sequence:
[2, 2, 2, 1, 1, 1, 1, 0]
Out-degree sequence:
[2, 2, 2, 2, 1, 1, 1, 0]
(undirected) degree sequence:
[3, 3, 3, 2, 2, 1, 1, 1]
Degree frequency: A frequency count of the occurrence of each degree
In-degree frequency:
[(2,3) (1,4) (0,1)]
Out-degree frequency :
[(2,4) (1,3) (0,1)]
(undirected) frequency :
[(3,3) (2,2) (1,3)]
0 1 2
0
1
2
3
4
5
indegree
frequency
21
22.
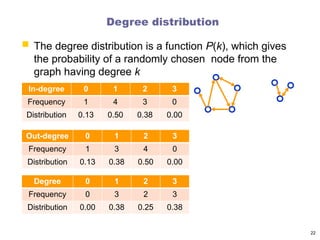
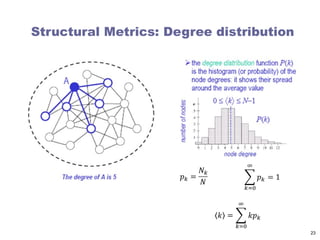
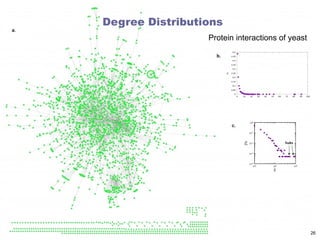
Degree distribution
Thedegree distribution is a function P(k), which gives
the probability of a randomly chosen node from the
graph having degree k
22
In-degree 0 1 2 3
Frequency 1 4 3 0
Distribution 0.13 0.50 0.38 0.00
Out-degree 0 1 2 3
Frequency 1 3 4 0
Distribution 0.13 0.38 0.50 0.00
Degree 0 1 2 3
Frequency 0 3 2 3
Distribution 0.00 0.38 0.25 0.38
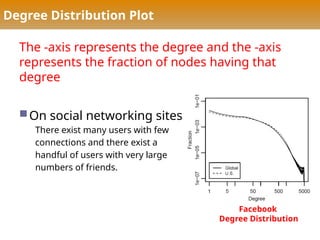
Degree Distribution Plot
The-axis represents the degree and the -axis
represents the fraction of nodes having that
degree
On social networking sites
There exist many users with few
connections and there exist a
handful of users with very large
numbers of friends.
Facebook
Degree Distribution
25.
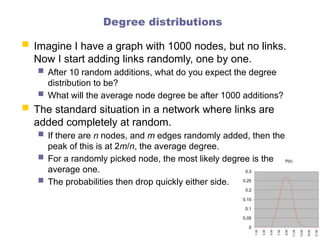
Degree distributions
ImagineI have a graph with 1000 nodes, but no links.
Now I start adding links randomly, one by one.
After 10 random additions, what do you expect the degree
distribution to be?
What will the average node degree be after 1000 additions?
The standard situation in a network where links are
added completely at random.
If there are n nodes, and m edges randomly added, then the
peak of this is at 2m/n, the average degree.
For a randomly picked node, the most likely degree is the
average one.
The probabilities then drop quickly either side.
P(k)
0
0.05
0.1
0.15
0.2
0.25
0.3
1.00
3.00
5.00
7.00
9.00
11.00
13.00
15.00
17.00
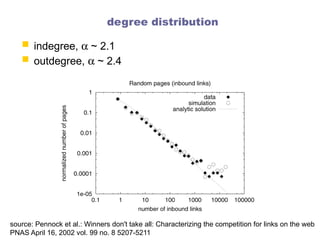
degree distribution
indegree,a ~ 2.1
outdegree, a ~ 2.4
source: Pennock et al.: Winners don't take all: Characterizing the competition for links on the web
PNAS April 16, 2002 vol. 99 no. 8 5207-5211
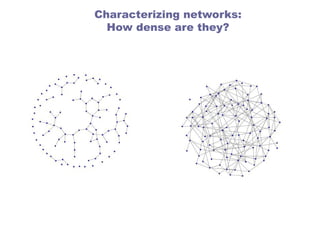
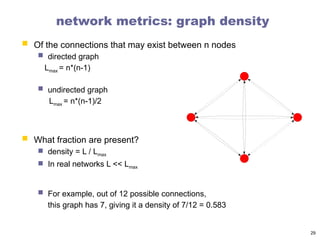
network metrics: graphdensity
Of the connections that may exist between n nodes
directed graph
Lmax = n*(n-1)
undirected graph
Lmax = n*(n-1)/2
What fraction are present?
density = L / Lmax
In real networks L << Lmax
For example, out of 12 possible connections,
this graph has 7, giving it a density of 7/12 = 0.583
29
30.
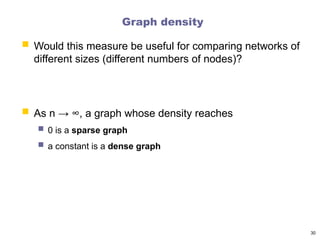
Graph density
30
Wouldthis measure be useful for comparing networks of
different sizes (different numbers of nodes)?
As n → ∞, a graph whose density reaches
0 is a sparse graph
a constant is a dense graph
31.
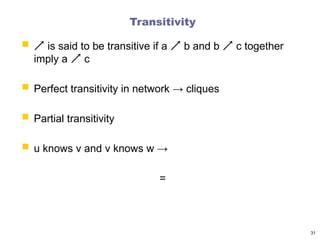
Transitivity
issaid to be transitive if a b and b c together
imply a c
Perfect transitivity in network → cliques
Partial transitivity
u knows v and v knows w →
=
31
32.
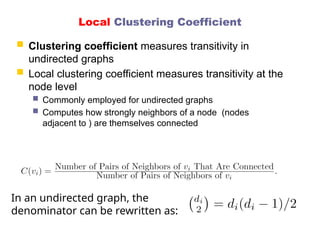
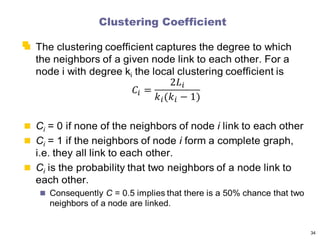
Local Clustering Coefficient
Clustering coefficient measures transitivity in
undirected graphs
Local clustering coefficient measures transitivity at the
node level
Commonly employed for undirected graphs
Computes how strongly neighbors of a node (nodes
adjacent to ) are themselves connected
In an undirected graph, the
denominator can be rewritten as:
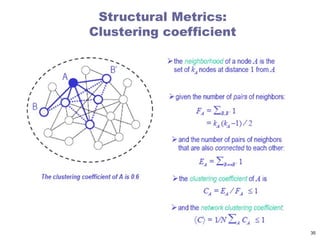
33.
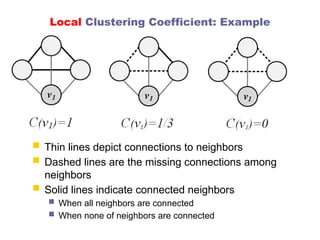
Local Clustering Coefficient:Example
Thin lines depict connections to neighbors
Dashed lines are the missing connections among
neighbors
Solid lines indicate connected neighbors
When all neighbors are connected
When none of neighbors are connected
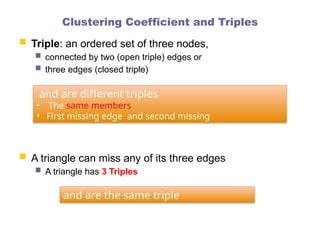
Clustering Coefficient andTriples
Triple: an ordered set of three nodes,
connected by two (open triple) edges or
three edges (closed triple)
A triangle can miss any of its three edges
A triangle has 3 Triples
and are different triples
• The same members
• First missing edge and second missing
and are the same triple
37.
[Global] Clustering Coefficient
Count paths of length two and check whether the third edge
exists
When counting triangles, since every triangle has 6
closed paths of length 2
Or we can rewrite it as
38.
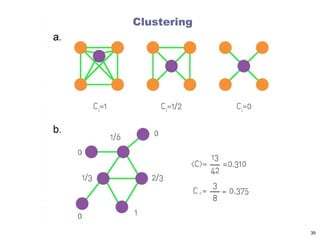
[Global] Clustering Coefficient:Example
• Average clustering coefficient and global clustering
coefficient are different
• In some extreme cases they could differ
considerably
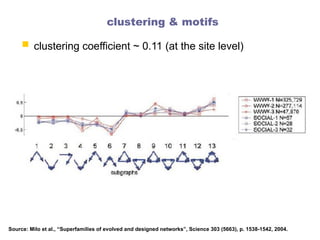
clustering & motifs
clustering coefficient ~ 0.11 (at the site level)
Source: Milo et al., “Superfamilies of evolved and designed networks”, Science 303 (5663), p. 1538-1542, 2004.
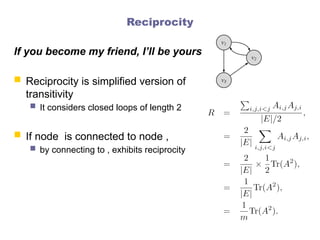
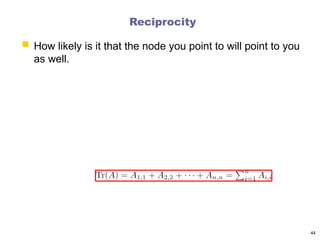
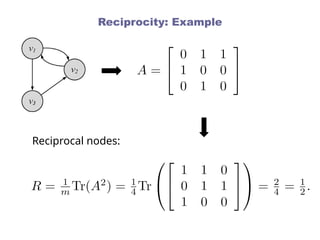
Reciprocity
If you becomemy friend, I’ll be yours
Reciprocity is simplified version of
transitivity
It considers closed loops of length 2
If node is connected to node ,
by connecting to , exhibits reciprocity
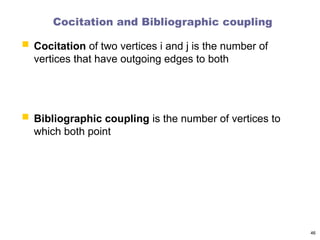
Cocitation and Bibliographiccoupling
Cocitation of two vertices i and j is the number of
vertices that have outgoing edges to both
Bibliographic coupling is the number of vertices to
which both point
46
47.
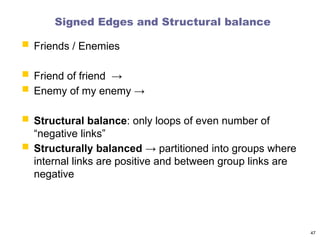
Signed Edges andStructural balance
Friends / Enemies
Friend of friend →
Enemy of my enemy →
Structural balance: only loops of even number of
“negative links”
Structurally balanced → partitioned into groups where
internal links are positive and between group links are
negative
47
48.
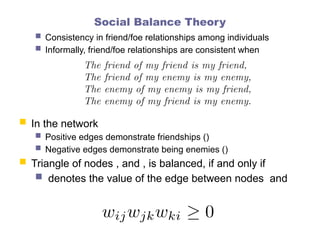
Social Balance Theory
Consistency in friend/foe relationships among individuals
Informally, friend/foe relationships are consistent when
In the network
Positive edges demonstrate friendships ()
Negative edges demonstrate being enemies ()
Triangle of nodes , and , is balanced, if and only if
denotes the value of the edge between nodes and
49.
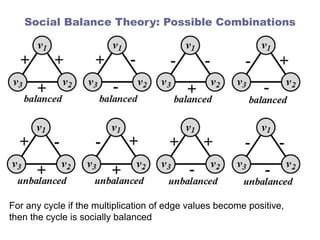
Social Balance Theory:Possible Combinations
For any cycle if the multiplication of edge values become positive,
then the cycle is socially balanced
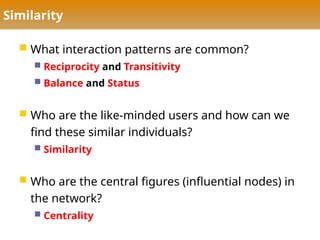
Similarity
What interactionpatterns are common?
Reciprocity and Transitivity
Balance and Status
Who are the like-minded users and how can we
find these similar individuals?
Similarity
Who are the central figures (influential nodes) in
the network?
Centrality
52.
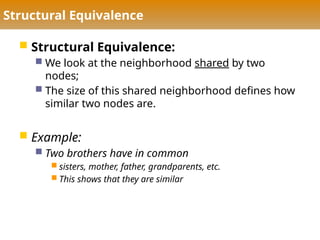
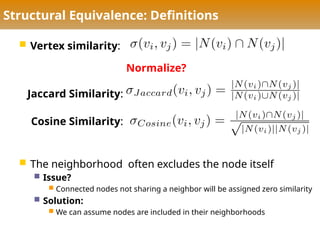
Structural Equivalence
StructuralEquivalence:
We look at the neighborhood shared by two
nodes;
The size of this shared neighborhood defines how
similar two nodes are.
Example:
Two brothers have in common
sisters, mother, father, grandparents, etc.
This shows that they are similar
53.
Vertex similarity:
The neighborhood often excludes the node itself
Issue?
Connected nodes not sharing a neighbor will be assigned zero similarity
Solution:
We can assume nodes are included in their neighborhoods
Structural Equivalence: Definitions
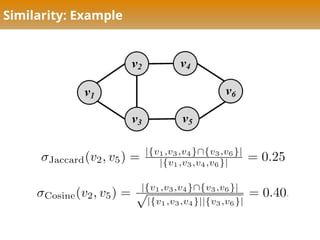
Jaccard Similarity:
Cosine Similarity:
Normalize?
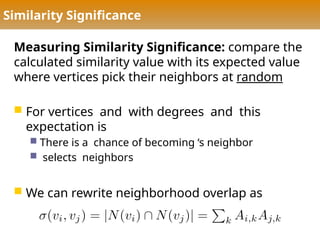
Similarity Significance
Measuring SimilaritySignificance: compare the
calculated similarity value with its expected value
where vertices pick their neighbors at random
For vertices and with degrees and this
expectation is
There is a chance of becoming ‘s neighbor
selects neighbors
We can rewrite neighborhood overlap as
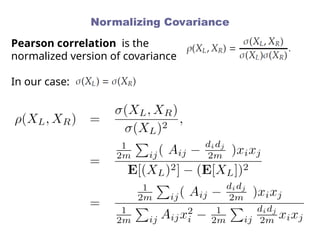
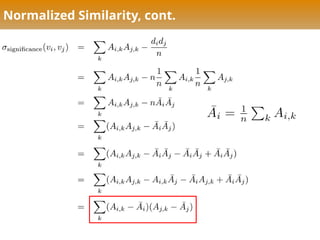
Normalized Similarity, cont.
timesthe Covariance between and
Normalize the covariance by the multiplication of Variances
We get Pearson correlation coefficient
(range of [-1,1] )
58.
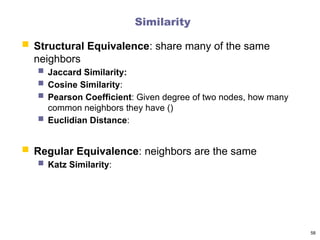
Similarity
Structural Equivalence:share many of the same
neighbors
Jaccard Similarity:
Cosine Similarity:
Pearson Coefficient: Given degree of two nodes, how many
common neighbors they have ()
Euclidian Distance:
Regular Equivalence: neighbors are the same
Katz Similarity:
58
59.
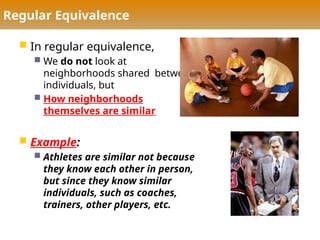
Regular Equivalence
Inregular equivalence,
We do not look at
neighborhoods shared between
individuals, but
How neighborhoods
themselves are similar
Example:
Athletes are similar not because
they know each other in person,
but since they know similar
individuals, such as coaches,
trainers, other players, etc.
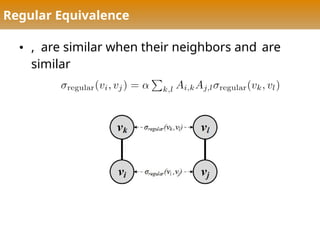
60.
• , aresimilar when their neighbors and are
similar
Regular Equivalence
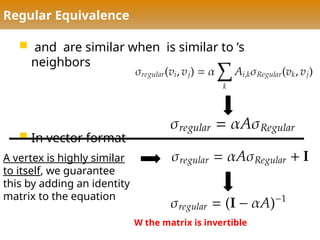
61.
Regular Equivalence
andare similar when is similar to ’s
neighbors
In vector format
A vertex is highly similar
to itself, we guarantee
this by adding an identity
matrix to the equation
W the matrix is invertible
62.
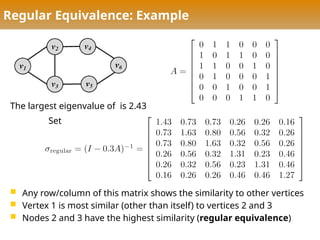
Regular Equivalence: Example
Any row/column of this matrix shows the similarity to other vertices
Vertex 1 is most similar (other than itself) to vertices 2 and 3
Nodes 2 and 3 have the highest similarity (regular equivalence)
The largest eigenvalue of is 2.43
Set
63.
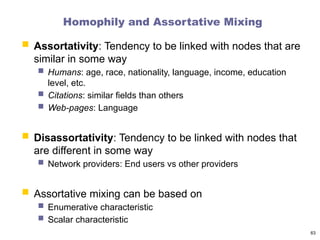
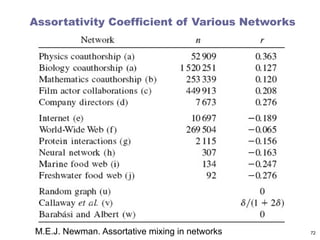
Homophily and AssortativeMixing
Assortativity: Tendency to be linked with nodes that are
similar in some way
Humans: age, race, nationality, language, income, education
level, etc.
Citations: similar fields than others
Web-pages: Language
Disassortativity: Tendency to be linked with nodes that
are different in some way
Network providers: End users vs other providers
Assortative mixing can be based on
Enumerative characteristic
Scalar characteristic
63
64.
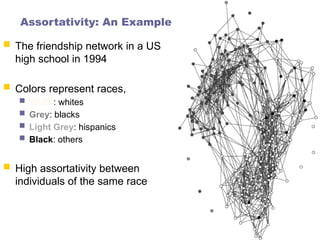
Assortativity: An Example
The friendship network in a US
high school in 1994
Colors represent races,
White: whites
Grey: blacks
Light Grey: hispanics
Black: others
High assortativity between
individuals of the same race
65.
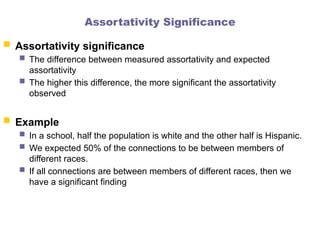
Assortativity Significance
Assortativitysignificance
The difference between measured assortativity and expected
assortativity
The higher this difference, the more significant the assortativity
observed
Example
In a school, half the population is white and the other half is Hispanic.
We expected 50% of the connections to be between members of
different races.
If all connections are between members of different races, then we
have a significant finding
66.
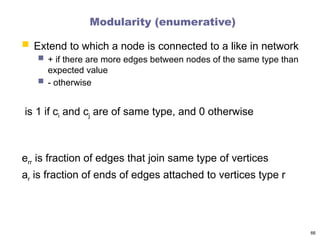
Modularity (enumerative)
Extendto which a node is connected to a like in network
+ if there are more edges between nodes of the same type than
expected value
- otherwise
is 1 if ci and cj are of same type, and 0 otherwise
err is fraction of edges that join same type of vertices
ar is fraction of ends of edges attached to vertices type r
66
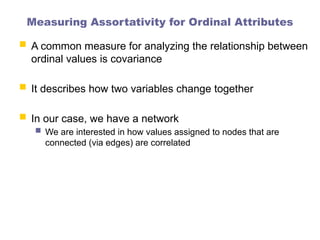
Measuring Assortativity forOrdinal Attributes
A common measure for analyzing the relationship between
ordinal values is covariance
It describes how two variables change together
In our case, we have a network
We are interested in how values assigned to nodes that are
connected (via edges) are correlated
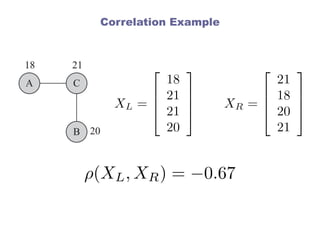
72.
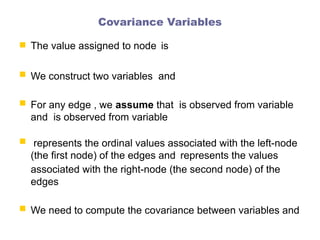
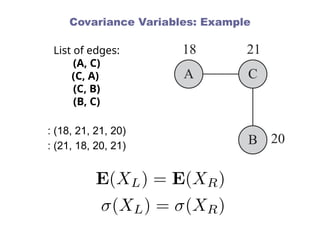
Covariance Variables
Thevalue assigned to node is
We construct two variables and
For any edge , we assume that is observed from variable
and is observed from variable
represents the ordinal values associated with the left-node
(the first node) of the edges and represents the values
associated with the right-node (the second node) of the
edges
We need to compute the covariance between variables and
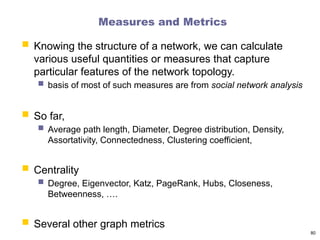
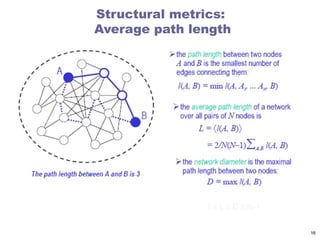
Measures and Metrics
Knowing the structure of a network, we can calculate
various useful quantities or measures that capture
particular features of the network topology.
basis of most of such measures are from social network analysis
So far,
Average path length, Diameter, Degree distribution, Density,
Assortativity, Connectedness, Clustering coefficient,
Centrality
Degree, Eigenvector, Katz, PageRank, Hubs, Closeness,
Betweenness, ….
Several other graph metrics
80
77.
Outline
Network metricscan help us characterize networks
This has is roots in graph theory
Today there are many network analysis tools to choose
from
Editor's Notes
#44 Trace of a matrix is the sum of diagonal elements


![Degree sequence and Degree frequency
Degree sequence: An ordered list of the (in,out) degree of each node
In-degree sequence:
[2, 2, 2, 1, 1, 1, 1, 0]
Out-degree sequence:
[2, 2, 2, 2, 1, 1, 1, 0]
(undirected) degree sequence:
[3, 3, 3, 2, 2, 1, 1, 1]
Degree frequency: A frequency count of the occurrence of each degree
In-degree frequency:
[(2,3) (1,4) (0,1)]
Out-degree frequency :
[(2,4) (1,3) (0,1)]
(undirected) frequency :
[(3,3) (2,2) (1,3)]
0 1 2
0
1
2
3
4
5
indegree
frequency
21](https://image.slidesharecdn.com/4-netwmetrics-250214192704-891d3fea/85/Network-Measures-Characterizing-networks-21-320.jpg)
![[Global] Clustering Coefficient
Count paths of length two and check whether the third edge
exists
When counting triangles, since every triangle has 6
closed paths of length 2
Or we can rewrite it as](https://image.slidesharecdn.com/4-netwmetrics-250214192704-891d3fea/85/Network-Measures-Characterizing-networks-37-320.jpg)
![[Global] Clustering Coefficient: Example
• Average clustering coefficient and global clustering
coefficient are different
• In some extreme cases they could differ
considerably](https://image.slidesharecdn.com/4-netwmetrics-250214192704-891d3fea/85/Network-Measures-Characterizing-networks-38-320.jpg)

![Normalized Similarity, cont.
times the Covariance between and
Normalize the covariance by the multiplication of Variances
We get Pearson correlation coefficient
(range of [-1,1] )](https://image.slidesharecdn.com/4-netwmetrics-250214192704-891d3fea/85/Network-Measures-Characterizing-networks-57-320.jpg)