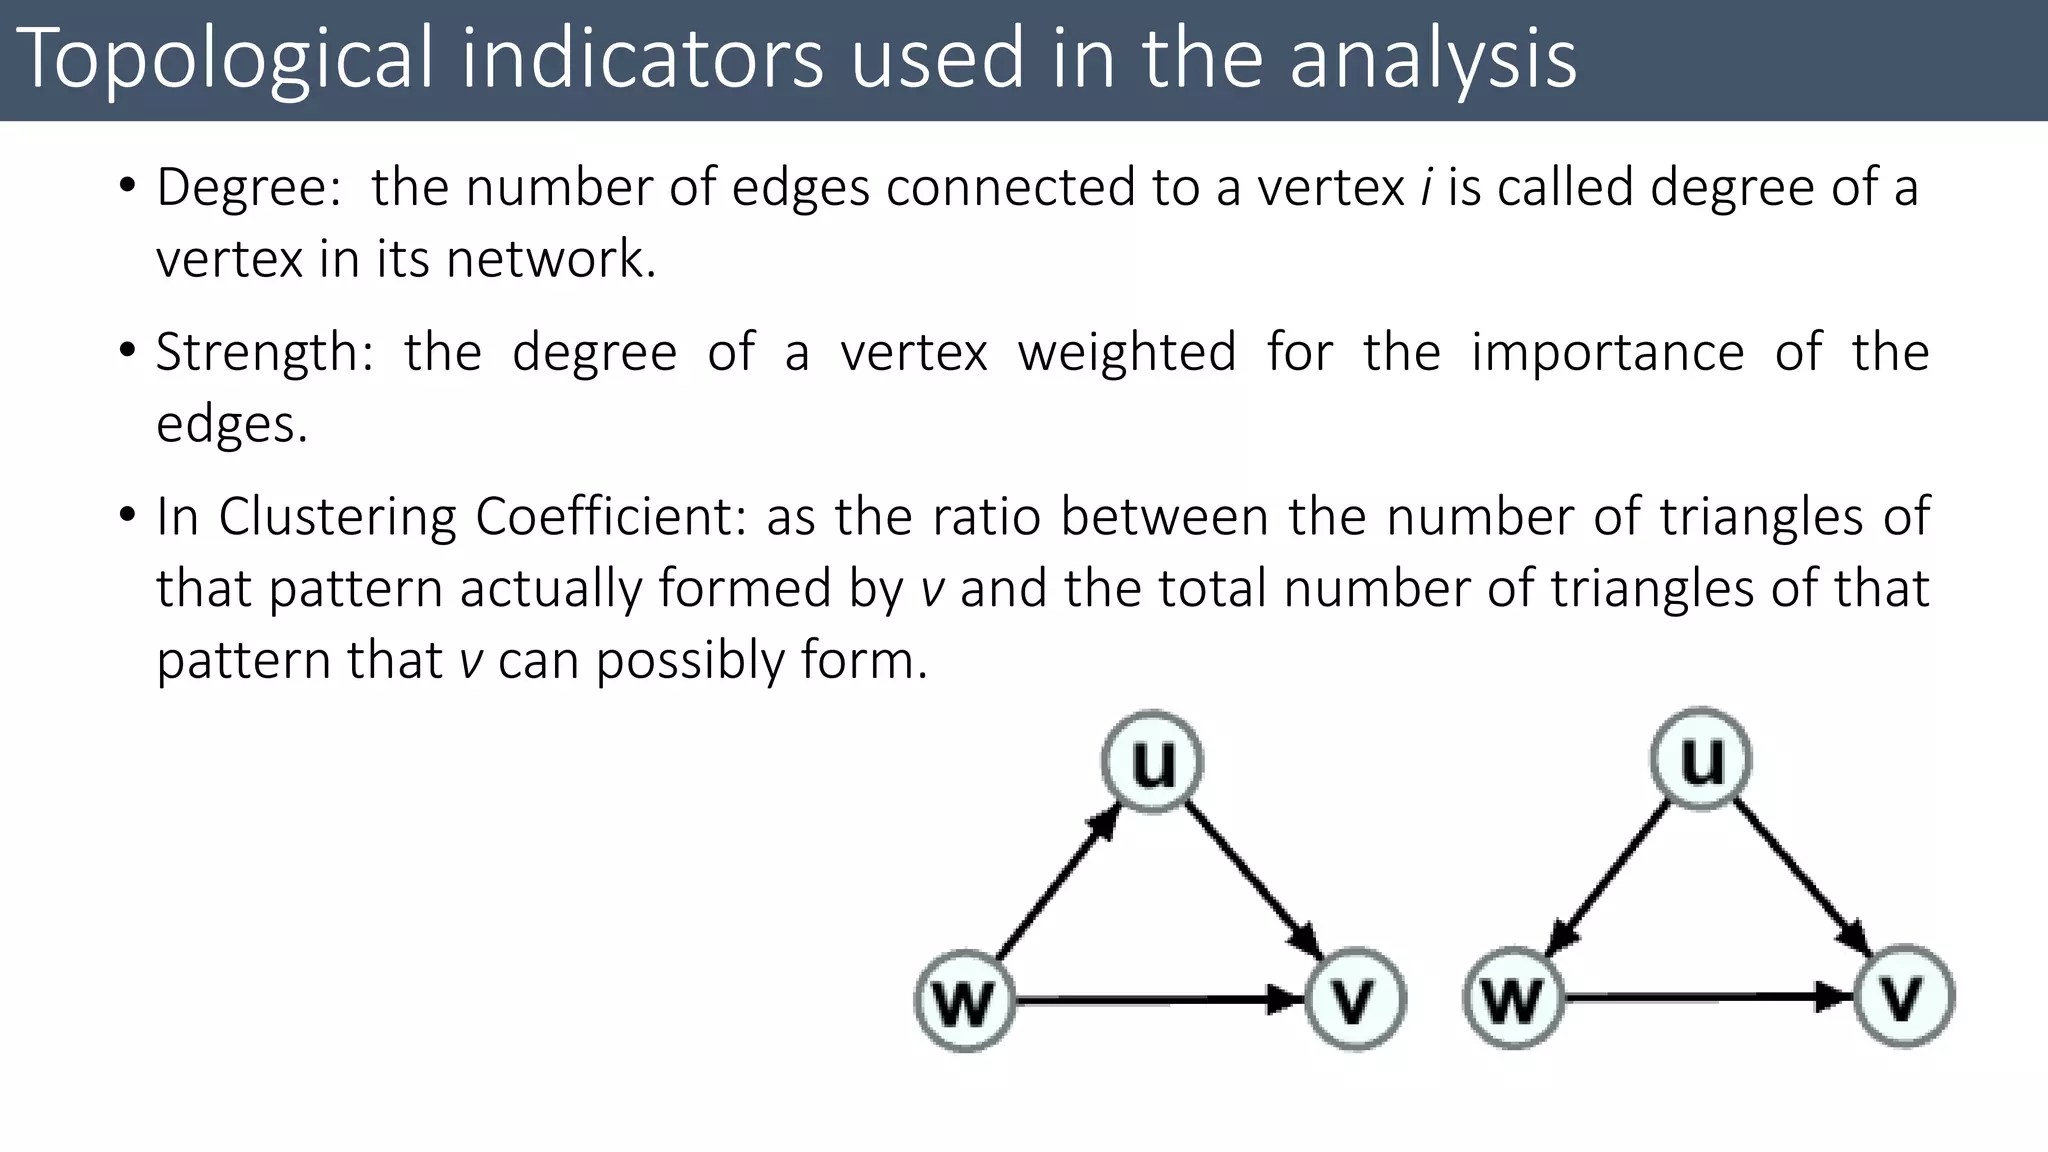
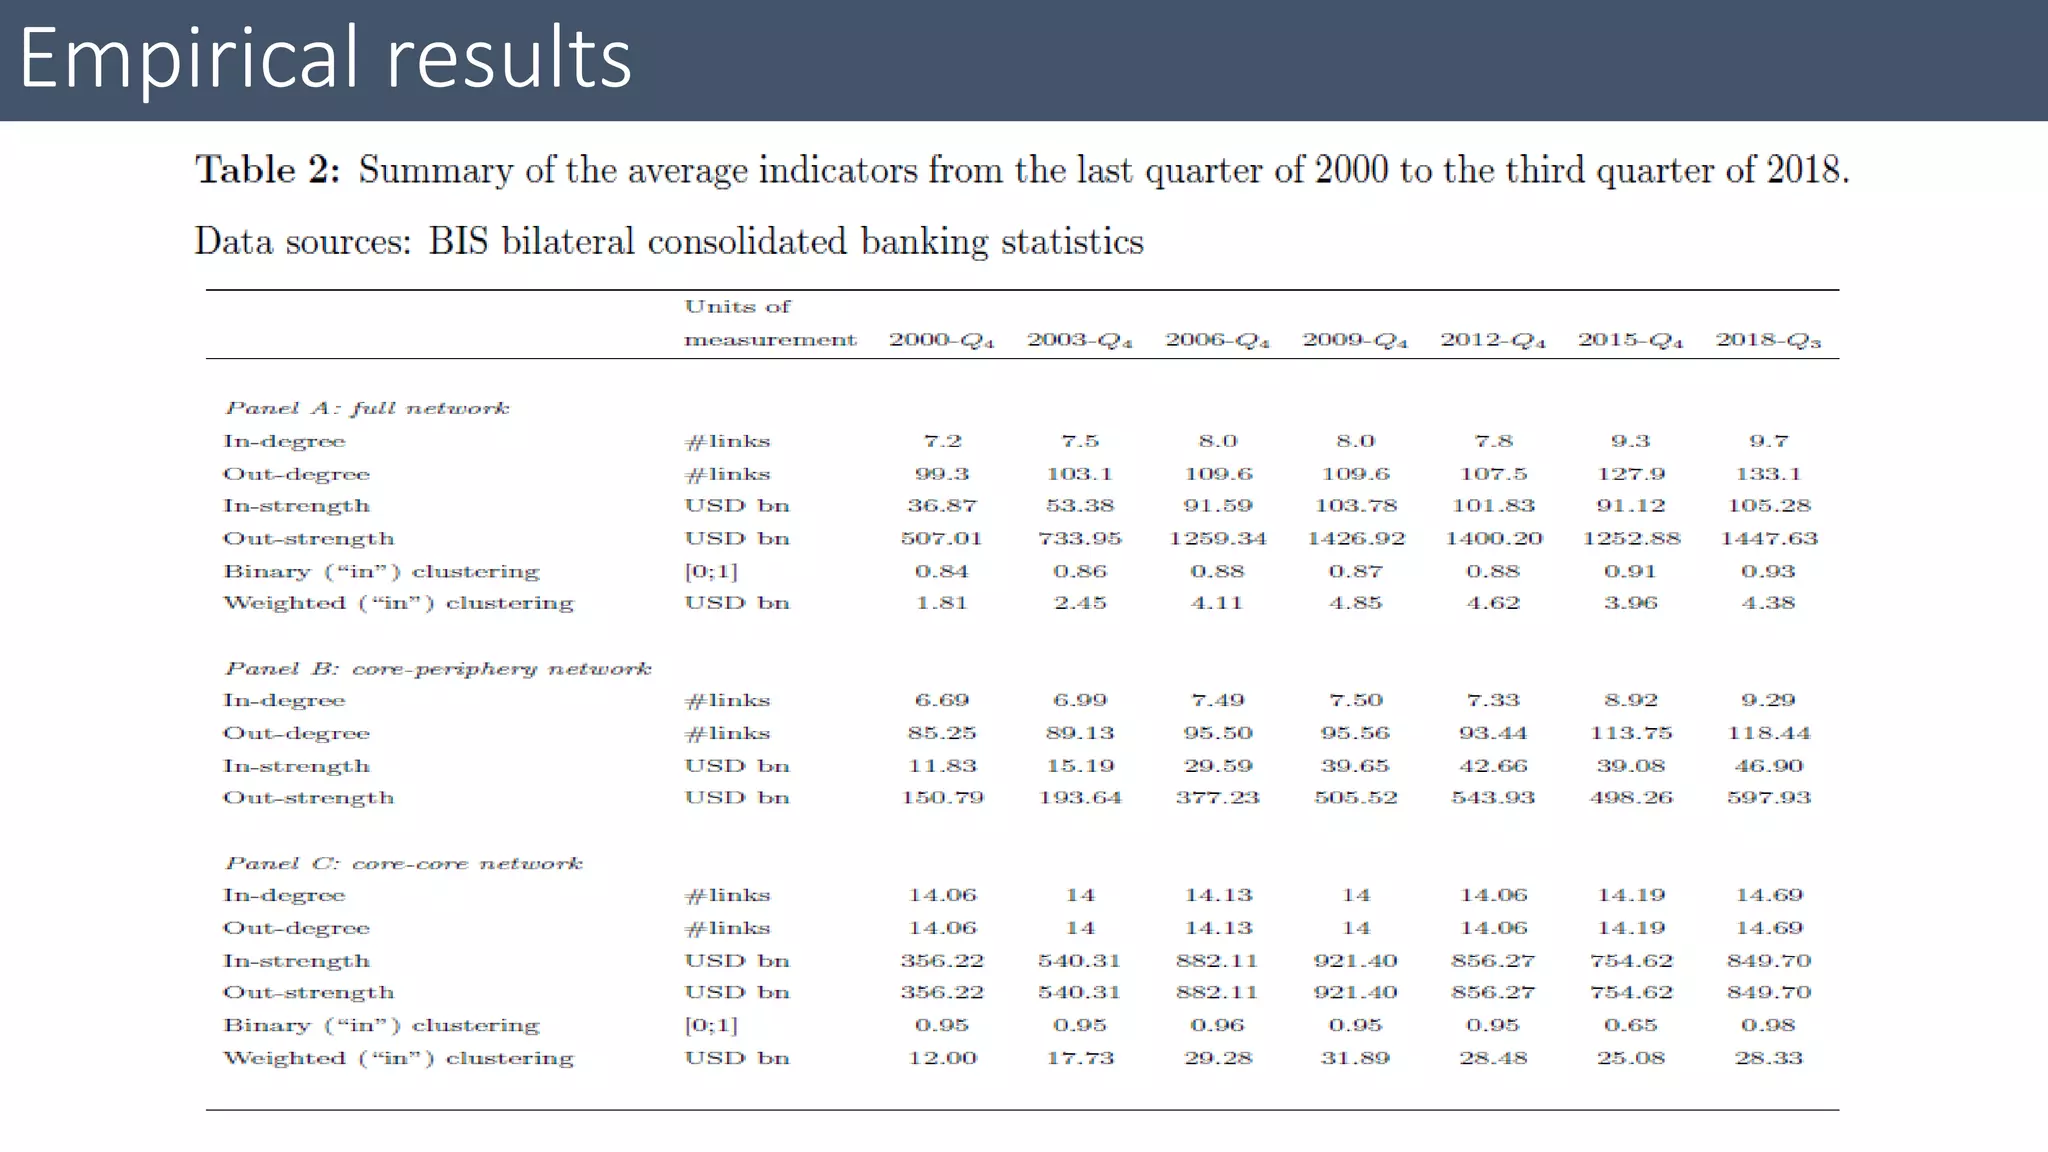
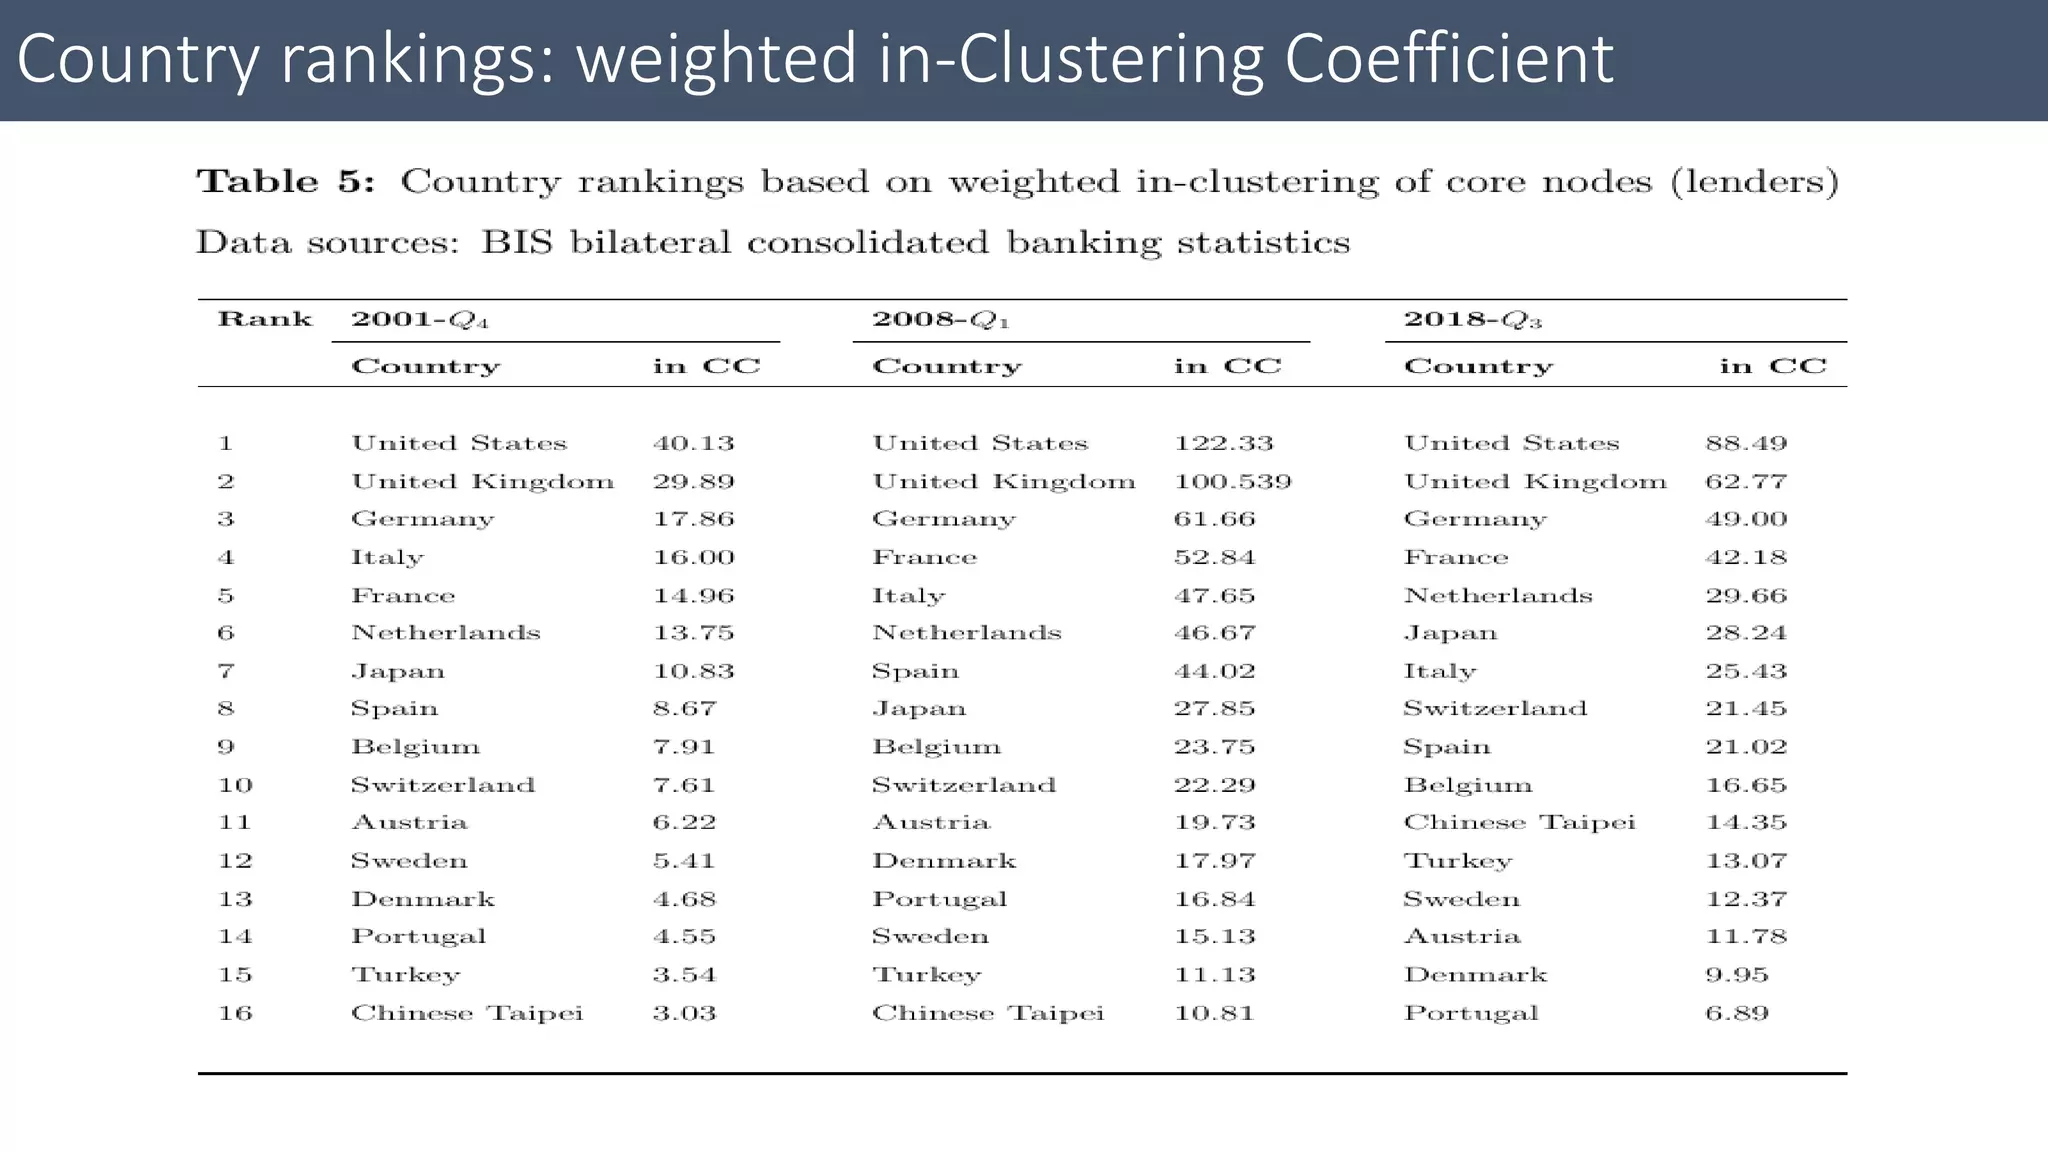
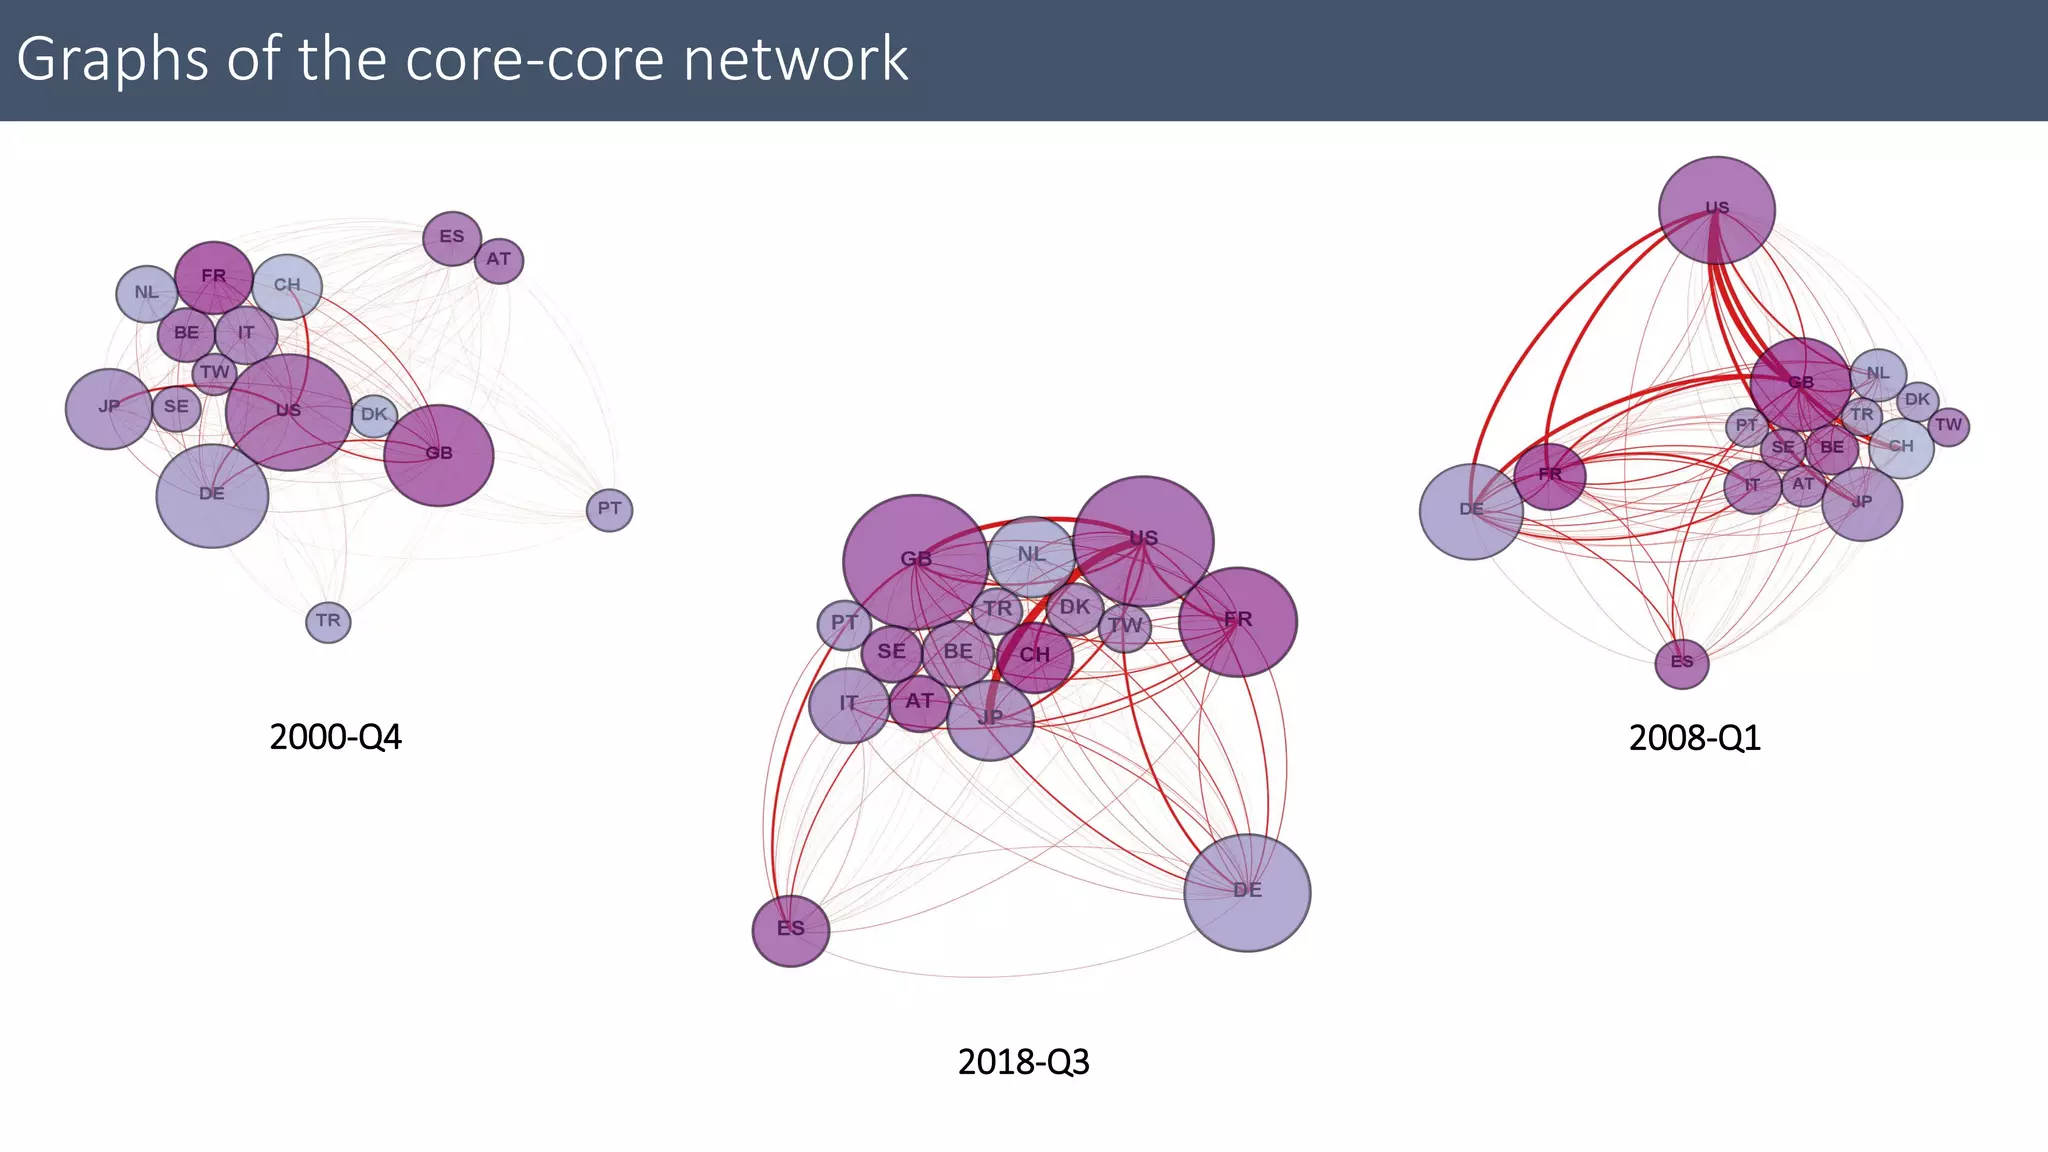
Network Analysis to
assess systemic risk
Supervisor: Chiara Pederzoli
Graduand: Mirko Prazzoli
Matr. N. 777310
Academic Year: 2018/2019
Systemic Risk: An introduction
• «systemic risk is any set of circumstances that threatens the
stability of or public confidence in the financial system» (cit
Billio et al, 2010).
• Recent literature (Minoiu&Reyes 2013 and Bongini et al
2018) has focused on the study of systemic risk with the
application of the Network Analysis.
Network definition
• A network is, in its simplest form, a collection of points joined together
in pairs by lines.
• In the jargon of the field the points are referred to as vertices or nodes
and the lines are referred to as edges.
Networks topologies and their mathematical representation
Consider a simple network with m (binary) edges and n vertices labeled with integers 1,2,
... , n to refer to any vertex unambiguously; then its “adjacency matrix” is a matrix A of nxn
dimension with elements aij:
Whereas, in the case of a directed network, the elements aij are given by:
Finally, in the case of a weighted network, we have an extension of the previous versions
and an “adjacency matrix” W with link weights (wij).
Purpose and definition of the analyzed networks
• The purpose of the current work is to analyze the structural properties of the
global banking network (GBN) in the period between fourth quarter 2000 and
third quarter 2018, with data provided by the Bank for International Settlements
(BIS) for 220 countries.
• In the current analysis, each country in the chosen dataset represents a vertex of
the network and weighted directed edges among vertices indicate positive cross-
border exposures (CBS and IB) of a country banking system to other countries.
• For instance, an edge from country X to country Y represents the aggregate
investment exposure of country X’s banking system in country Y.
• Each quarter observation of our sample period has been modeled as a separate
network, and the analysis is focused on three different type of network.
Three types of network
• The full network: which refers to all available
data.
• The core-periphery network: based on edges
between the core and the periphery.
• The core-core network: which is limited to the 16
countries that make up the core.
Our sample contains 220 countries, of which 16
are advanced economies (about 97.32 percent of
total bank-intermediated flows of all BIS reporting
countries) that report bilateral positions to the BIS
(reporting countries) and 204 are countries vis-à-
vis which positions are reported (non-reporting
countries).
Topological indicators used in the analysis
• Degree: the number of edges connected to a vertex i is called degree of a
vertex in its network.
• Strength: the degree of a vertex weighted for the importance of the
edges.
• In Clustering Coefficient: as the ratio between the number of triangles of
that pattern actually formed by v and the total number of triangles of that
pattern that v can possibly form.
Empirical results
Country rankings: top player in the GBN out degree and strength
Country rankings: binary in-Clustering Coefficient
Country rankings: weighted in-Clustering Coefficient
Average in-Clustering Coefficients of the full and core-periphery networks
Graphs of the core-periphery network
2000-Q4 2008-Q1
2018-Q3
Graphs of the full network
2000-Q4 2008-Q1
2018-Q3
Graphs of the core-core network
2000-Q4 2008-Q1
2018-Q3
INDICATOR INSIGHTS
Average out-indicators of the full network
Average out-indicators of the core-periphery network

Network analysis

  • 1.
    Network Analysis to assesssystemic risk Supervisor: Chiara Pederzoli Graduand: Mirko Prazzoli Matr. N. 777310 Academic Year: 2018/2019
  • 2.
    Systemic Risk: Anintroduction • «systemic risk is any set of circumstances that threatens the stability of or public confidence in the financial system» (cit Billio et al, 2010). • Recent literature (Minoiu&Reyes 2013 and Bongini et al 2018) has focused on the study of systemic risk with the application of the Network Analysis.
  • 3.
    Network definition • Anetwork is, in its simplest form, a collection of points joined together in pairs by lines. • In the jargon of the field the points are referred to as vertices or nodes and the lines are referred to as edges.
  • 4.
    Networks topologies andtheir mathematical representation Consider a simple network with m (binary) edges and n vertices labeled with integers 1,2, ... , n to refer to any vertex unambiguously; then its “adjacency matrix” is a matrix A of nxn dimension with elements aij: Whereas, in the case of a directed network, the elements aij are given by: Finally, in the case of a weighted network, we have an extension of the previous versions and an “adjacency matrix” W with link weights (wij).
  • 5.
    Purpose and definitionof the analyzed networks • The purpose of the current work is to analyze the structural properties of the global banking network (GBN) in the period between fourth quarter 2000 and third quarter 2018, with data provided by the Bank for International Settlements (BIS) for 220 countries. • In the current analysis, each country in the chosen dataset represents a vertex of the network and weighted directed edges among vertices indicate positive cross- border exposures (CBS and IB) of a country banking system to other countries. • For instance, an edge from country X to country Y represents the aggregate investment exposure of country X’s banking system in country Y. • Each quarter observation of our sample period has been modeled as a separate network, and the analysis is focused on three different type of network.
  • 6.
    Three types ofnetwork • The full network: which refers to all available data. • The core-periphery network: based on edges between the core and the periphery. • The core-core network: which is limited to the 16 countries that make up the core. Our sample contains 220 countries, of which 16 are advanced economies (about 97.32 percent of total bank-intermediated flows of all BIS reporting countries) that report bilateral positions to the BIS (reporting countries) and 204 are countries vis-à- vis which positions are reported (non-reporting countries).
  • 7.
    Topological indicators usedin the analysis • Degree: the number of edges connected to a vertex i is called degree of a vertex in its network. • Strength: the degree of a vertex weighted for the importance of the edges. • In Clustering Coefficient: as the ratio between the number of triangles of that pattern actually formed by v and the total number of triangles of that pattern that v can possibly form.
  • 8.
  • 9.
    Country rankings: topplayer in the GBN out degree and strength
  • 10.
    Country rankings: binaryin-Clustering Coefficient
  • 11.
    Country rankings: weightedin-Clustering Coefficient
  • 12.
    Average in-Clustering Coefficientsof the full and core-periphery networks
  • 13.
    Graphs of thecore-periphery network 2000-Q4 2008-Q1 2018-Q3
  • 14.
    Graphs of thefull network 2000-Q4 2008-Q1 2018-Q3
  • 15.
    Graphs of thecore-core network 2000-Q4 2008-Q1 2018-Q3
  • 16.
  • 17.
    Average out-indicators ofthe full network
  • 18.
    Average out-indicators ofthe core-periphery network