Download to read offline


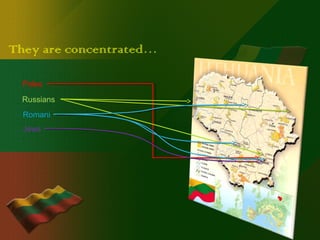


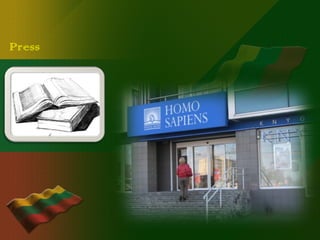
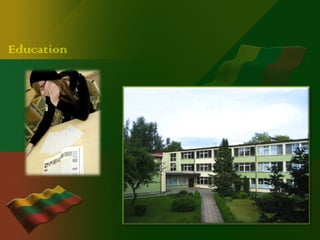
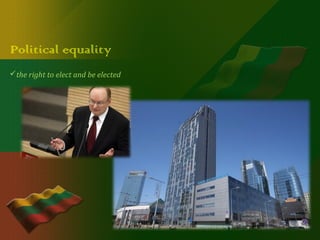


Lithuanians make up 83.1% of Lithuania's population, with Poles being the largest minority at 6%. Other significant minority groups include Russians, Belarusians, Ukrainians, Germans, Jews, Tatars, Latvians, and Roma. The document discusses ethnic composition, rights like freedom of press, education, and political equality for minorities in Lithuania. It also provides some interesting facts and quotes related to nationality and diversity.


![Lithuaniapresentation 100430123448-phpapp01[1]](https://cdn.slidesharecdn.com/ss_thumbnails/lithuaniapresentation-100430123448-phpapp011-101205083824-phpapp01-thumbnail.jpg?width=640&height=640&fit=bounds)


