Download free for 30 days
Sign in
Upload
Language (EN)
Support
Business
Mobile
Social Media
Marketing
Technology
Art & Photos
Career
Design
Education
Presentations & Public Speaking
Government & Nonprofit
Healthcare
Internet
Law
Leadership & Management
Automotive
Engineering
Software
Recruiting & HR
Retail
Sales
Services
Science
Small Business & Entrepreneurship
Food
Environment
Economy & Finance
Data & Analytics
Investor Relations
Sports
Spiritual
News & Politics
Travel
Self Improvement
Real Estate
Entertainment & Humor
Health & Medicine
Devices & Hardware
Lifestyle
Change Language
Language
English
Español
Português
Français
Deutsche
Cancel
Save
EN
Uploaded by
Shinya Sugiyama
10,180 views
MySQL SYSスキーマのご紹介
MySQL5.7.21時点のVIEWをリストアップして概要紹介。 MySQL運用に活用下さい。
Software
◦
Read more
3
Save
Share
Embed
Embed presentation
Download
Downloaded 23 times
1
/ 69
2
/ 69
3
/ 69
4
/ 69
5
/ 69
6
/ 69
7
/ 69
8
/ 69
9
/ 69
10
/ 69
11
/ 69
12
/ 69
13
/ 69
14
/ 69
15
/ 69
16
/ 69
17
/ 69
18
/ 69
19
/ 69
20
/ 69
21
/ 69
22
/ 69
23
/ 69
24
/ 69
25
/ 69
26
/ 69
27
/ 69
28
/ 69
29
/ 69
30
/ 69
31
/ 69
32
/ 69
33
/ 69
34
/ 69
35
/ 69
36
/ 69
37
/ 69
38
/ 69
39
/ 69
40
/ 69
41
/ 69
42
/ 69
43
/ 69
44
/ 69
45
/ 69
46
/ 69
47
/ 69
48
/ 69
49
/ 69
50
/ 69
51
/ 69
52
/ 69
53
/ 69
54
/ 69
55
/ 69
56
/ 69
57
/ 69
58
/ 69
59
/ 69
60
/ 69
61
/ 69
62
/ 69
63
/ 69
64
/ 69
65
/ 69
66
/ 69
67
/ 69
68
/ 69
69
/ 69
More Related Content
PDF
データウェアハウスモデリング入門(ダイジェスト版)(事前公開版)
by
Satoshi Nagayasu
PPT
DataGuard体験記
by
Shinnosuke Akita
PDF
PostgreSQLのリカバリ超入門(もしくはWAL、CHECKPOINT、オンラインバックアップの仕組み)
by
Hironobu Suzuki
PDF
MySQLアーキテクチャ図解講座
by
Mikiya Okuno
PDF
[Oracle DBA & Developer Day 2016] しばちょう先生の特別講義!!ストレージ管理のベストプラクティス ~ASMからExada...
by
オラクルエンジニア通信
PDF
トランザクション処理可能な分散DB 「YugabyteDB」入門(Open Source Conference 2022 Online/Fukuoka 発...
by
NTT DATA Technology & Innovation
PDF
PostgreSQLレプリケーション10周年!徹底紹介!(PostgreSQL Conference Japan 2019講演資料)
by
NTT DATA Technology & Innovation
PDF
MySQL8.0 SYS スキーマ概要
by
Shinya Sugiyama
データウェアハウスモデリング入門(ダイジェスト版)(事前公開版)
by
Satoshi Nagayasu
DataGuard体験記
by
Shinnosuke Akita
PostgreSQLのリカバリ超入門(もしくはWAL、CHECKPOINT、オンラインバックアップの仕組み)
by
Hironobu Suzuki
MySQLアーキテクチャ図解講座
by
Mikiya Okuno
[Oracle DBA & Developer Day 2016] しばちょう先生の特別講義!!ストレージ管理のベストプラクティス ~ASMからExada...
by
オラクルエンジニア通信
トランザクション処理可能な分散DB 「YugabyteDB」入門(Open Source Conference 2022 Online/Fukuoka 発...
by
NTT DATA Technology & Innovation
PostgreSQLレプリケーション10周年!徹底紹介!(PostgreSQL Conference Japan 2019講演資料)
by
NTT DATA Technology & Innovation
MySQL8.0 SYS スキーマ概要
by
Shinya Sugiyama
What's hot
PDF
バッチ処理にバインド変数はもうやめません? ~|バッチ処理の突発遅延を題材にして考えてみる~
by
Ryota Watabe
PDF
PostgreSQLレプリケーション徹底紹介
by
NTT DATA OSS Professional Services
PDF
PostgreSQLによるデータ分析ことはじめ
by
Ohyama Masanori
PPTX
Qlik Replicateでのタスクの定義と管理
by
QlikPresalesJapan
PDF
Oracle GoldenGate アーキテクチャと基本機能
by
オラクルエンジニア通信
PDF
Oracle Data Guard による高可用性
by
Yahoo!デベロッパーネットワーク
PDF
PostgreSQL 15の新機能を徹底解説
by
Masahiko Sawada
PDF
Oracle GoldenGate導入Tips
by
オラクルエンジニア通信
PDF
Inside vacuum - 第一回PostgreSQLプレ勉強会
by
Masahiko Sawada
PDF
Memoizeの仕組み(第41回PostgreSQLアンカンファレンス@オンライン 発表資料)
by
NTT DATA Technology & Innovation
PDF
KafkaとAWS Kinesisの比較
by
Yoshiyasu SAEKI
PDF
レプリケーション遅延の監視について(第40回PostgreSQLアンカンファレンス@オンライン 発表資料)
by
NTT DATA Technology & Innovation
PDF
PostgreSQL13でのpg_basebackupの改善について(第13回PostgreSQLアンカンファレンス@オンライン)
by
NTT DATA Technology & Innovation
PDF
Kuberneteの運用を支えるGitOps
by
shunki fujiwara
PDF
MySQL InnoDB Clusterによる高可用性構成(DB Tech Showcase 2017)
by
Shinya Sugiyama
PDF
Oracle Database / Exadata Cloud 技術情報(Oracle Cloudウェビナーシリーズ: 2020年7月9日)
by
オラクルエンジニア通信
PPTX
スケールアウトするPostgreSQLを目指して!その第一歩!(NTTデータ テクノロジーカンファレンス 2020 発表資料)
by
NTT DATA Technology & Innovation
PDF
あなたの知らないPostgreSQL監視の世界
by
Yoshinori Nakanishi
PDF
Amazon Aurora Deep Dive (db tech showcase 2016)
by
Amazon Web Services Japan
PDF
RocksDB Performance and Reliability Practices
by
Yoshinori Matsunobu
バッチ処理にバインド変数はもうやめません? ~|バッチ処理の突発遅延を題材にして考えてみる~
by
Ryota Watabe
PostgreSQLレプリケーション徹底紹介
by
NTT DATA OSS Professional Services
PostgreSQLによるデータ分析ことはじめ
by
Ohyama Masanori
Qlik Replicateでのタスクの定義と管理
by
QlikPresalesJapan
Oracle GoldenGate アーキテクチャと基本機能
by
オラクルエンジニア通信
Oracle Data Guard による高可用性
by
Yahoo!デベロッパーネットワーク
PostgreSQL 15の新機能を徹底解説
by
Masahiko Sawada
Oracle GoldenGate導入Tips
by
オラクルエンジニア通信
Inside vacuum - 第一回PostgreSQLプレ勉強会
by
Masahiko Sawada
Memoizeの仕組み(第41回PostgreSQLアンカンファレンス@オンライン 発表資料)
by
NTT DATA Technology & Innovation
KafkaとAWS Kinesisの比較
by
Yoshiyasu SAEKI
レプリケーション遅延の監視について(第40回PostgreSQLアンカンファレンス@オンライン 発表資料)
by
NTT DATA Technology & Innovation
PostgreSQL13でのpg_basebackupの改善について(第13回PostgreSQLアンカンファレンス@オンライン)
by
NTT DATA Technology & Innovation
Kuberneteの運用を支えるGitOps
by
shunki fujiwara
MySQL InnoDB Clusterによる高可用性構成(DB Tech Showcase 2017)
by
Shinya Sugiyama
Oracle Database / Exadata Cloud 技術情報(Oracle Cloudウェビナーシリーズ: 2020年7月9日)
by
オラクルエンジニア通信
スケールアウトするPostgreSQLを目指して!その第一歩!(NTTデータ テクノロジーカンファレンス 2020 発表資料)
by
NTT DATA Technology & Innovation
あなたの知らないPostgreSQL監視の世界
by
Yoshinori Nakanishi
Amazon Aurora Deep Dive (db tech showcase 2016)
by
Amazon Web Services Japan
RocksDB Performance and Reliability Practices
by
Yoshinori Matsunobu
Similar to MySQL SYSスキーマのご紹介
ODP
Performance Schema @ MySQL Casual #2
by
Mikiya Okuno
PDF
[db tech showcase Tokyo 2015] D23:MySQLはドキュメントデータベースになり、HTTPもしゃべる - MySQL Lab...
by
Insight Technology, Inc.
PDF
20150131 ChugokuDB-Shimane-MySQL
by
Ryusuke Kajiyama
PDF
States of Dolphin - MySQL最新技術情報2013秋 -
by
yoyamasaki
PDF
[D14] MySQL 5.6時代のパフォーマンスチューニング *db tech showcase 2013 Tokyo
by
yoyamasaki
PDF
[D37]MySQLの真のイノベーションはこれだ!MySQL 5.7と「実験室」 by Ryusuke Kajiyama
by
Insight Technology, Inc.
PDF
MySQL 5.7 & 最新開発状況 @ オープンソースカンファレンス20
by
Ryusuke Kajiyama
PDF
MySQL57 Update@OSC Fukuoka 20151003
by
Shinya Sugiyama
PPT
Maatkit で MySQL チューニング
by
Kensuke Nagae
PDF
MySQL 5.7 トラブルシューティング 性能解析入門編
by
Mikiya Okuno
PDF
第九回中国地方DB勉強会 in 米子 MySQL 5.7+
by
Ryusuke Kajiyama
PDF
MySQL最新情報 ※2015年9月5日「第1回 関西DB勉強会」での発表資料
by
yoyamasaki
PPTX
[OSC 2017 Tokyo/Fall] OSSコンソーシアム DB部会 MySQL 8.0
by
Ryusuke Kajiyama
PPTX
LINEのMySQL運用について 修正版
by
LINE Corporation
PDF
MySQL最新情報
by
yoyamasaki
PDF
MySQLをプロファイる(仮)
by
yoku0825
PDF
20150920 中国地方db勉強会
by
yoyamasaki
PPTX
MySQL Technology Cafe #14 MySQL Shellを使ってもっと楽をしようの会
by
オラクルエンジニア通信
PDF
MySQL 開発最新動向
by
yoyamasaki
PDF
MySQL 5.7が魅せる新しい運用の形
by
yoku0825
Performance Schema @ MySQL Casual #2
by
Mikiya Okuno
[db tech showcase Tokyo 2015] D23:MySQLはドキュメントデータベースになり、HTTPもしゃべる - MySQL Lab...
by
Insight Technology, Inc.
20150131 ChugokuDB-Shimane-MySQL
by
Ryusuke Kajiyama
States of Dolphin - MySQL最新技術情報2013秋 -
by
yoyamasaki
[D14] MySQL 5.6時代のパフォーマンスチューニング *db tech showcase 2013 Tokyo
by
yoyamasaki
[D37]MySQLの真のイノベーションはこれだ!MySQL 5.7と「実験室」 by Ryusuke Kajiyama
by
Insight Technology, Inc.
MySQL 5.7 & 最新開発状況 @ オープンソースカンファレンス20
by
Ryusuke Kajiyama
MySQL57 Update@OSC Fukuoka 20151003
by
Shinya Sugiyama
Maatkit で MySQL チューニング
by
Kensuke Nagae
MySQL 5.7 トラブルシューティング 性能解析入門編
by
Mikiya Okuno
第九回中国地方DB勉強会 in 米子 MySQL 5.7+
by
Ryusuke Kajiyama
MySQL最新情報 ※2015年9月5日「第1回 関西DB勉強会」での発表資料
by
yoyamasaki
[OSC 2017 Tokyo/Fall] OSSコンソーシアム DB部会 MySQL 8.0
by
Ryusuke Kajiyama
LINEのMySQL運用について 修正版
by
LINE Corporation
MySQL最新情報
by
yoyamasaki
MySQLをプロファイる(仮)
by
yoku0825
20150920 中国地方db勉強会
by
yoyamasaki
MySQL Technology Cafe #14 MySQL Shellを使ってもっと楽をしようの会
by
オラクルエンジニア通信
MySQL 開発最新動向
by
yoyamasaki
MySQL 5.7が魅せる新しい運用の形
by
yoku0825
More from Shinya Sugiyama
PDF
MySQLとPostgreSQLの基本的な実行プラン比較
by
Shinya Sugiyama
PDF
MySQLとPostgreSQLの基本的なパラメータ比較
by
Shinya Sugiyama
PDF
MySQLとPostgreSQLの基本的なレプリケーション設定比較
by
Shinya Sugiyama
PDF
MySQLとPostgreSQLの基本的なバックアップ比較
by
Shinya Sugiyama
PDF
MySQLとPostgreSQLにおける基本的なアカウント管理
by
Shinya Sugiyama
PDF
Locondo 20190703@inno db_cluster
by
Shinya Sugiyama
PDF
Locondo 20190215@ec tech_group
by
Shinya Sugiyama
PDF
DB tech showcase_tokyo2018_LOCONDO
by
Shinya Sugiyama
PDF
MySQL Partition Engine
by
Shinya Sugiyama
PDF
Oracle Cloud MySQL Service
by
Shinya Sugiyama
PDF
MySQL8.0 in COSCUP2017
by
Shinya Sugiyama
PDF
MySQLデータ暗号化と暗号鍵のローテーション
by
Shinya Sugiyama
PDF
Power of SQL and NoSQL with MySQL5.7
by
Shinya Sugiyama
PDF
Multi thread slave_performance_on_opc
by
Shinya Sugiyama
PDF
db tech showcase2016 - MySQLドキュメントストア
by
Shinya Sugiyama
PDF
No sql with mysql cluster (MyNA・JPUG合同DB勉強会)
by
Shinya Sugiyama
PDF
MySQL 5.7とレプリケーションにおける改良
by
Shinya Sugiyama
PDF
MySQL 5.7 Technical Update (日本語)
by
Shinya Sugiyama
PDF
MySQL Fabric with OpenStack Nova
by
Shinya Sugiyama
PDF
My sql security (暗号化)
by
Shinya Sugiyama
MySQLとPostgreSQLの基本的な実行プラン比較
by
Shinya Sugiyama
MySQLとPostgreSQLの基本的なパラメータ比較
by
Shinya Sugiyama
MySQLとPostgreSQLの基本的なレプリケーション設定比較
by
Shinya Sugiyama
MySQLとPostgreSQLの基本的なバックアップ比較
by
Shinya Sugiyama
MySQLとPostgreSQLにおける基本的なアカウント管理
by
Shinya Sugiyama
Locondo 20190703@inno db_cluster
by
Shinya Sugiyama
Locondo 20190215@ec tech_group
by
Shinya Sugiyama
DB tech showcase_tokyo2018_LOCONDO
by
Shinya Sugiyama
MySQL Partition Engine
by
Shinya Sugiyama
Oracle Cloud MySQL Service
by
Shinya Sugiyama
MySQL8.0 in COSCUP2017
by
Shinya Sugiyama
MySQLデータ暗号化と暗号鍵のローテーション
by
Shinya Sugiyama
Power of SQL and NoSQL with MySQL5.7
by
Shinya Sugiyama
Multi thread slave_performance_on_opc
by
Shinya Sugiyama
db tech showcase2016 - MySQLドキュメントストア
by
Shinya Sugiyama
No sql with mysql cluster (MyNA・JPUG合同DB勉強会)
by
Shinya Sugiyama
MySQL 5.7とレプリケーションにおける改良
by
Shinya Sugiyama
MySQL 5.7 Technical Update (日本語)
by
Shinya Sugiyama
MySQL Fabric with OpenStack Nova
by
Shinya Sugiyama
My sql security (暗号化)
by
Shinya Sugiyama
MySQL SYSスキーマのご紹介
1.
Copyright © 2016,
Oracle and/or its affiliates. All rights reserved. | MySQL SYS Schema概要 MySQL SYS Schemaによるパフォーマンス監視 updated: 2018/03/09 MySQL Global Business Unit Master Principal Sales Consultant/ Shinya Sugiyama
2.
Copyright © 2017,
Oracle and/or its affiliates. All rights reserved. Safe Harbor Statement 以下の事項は、弊社の一般的な製品の方向性に関する概要を説明するものです。 また、情報提供を唯一の目的とするものであり、いかなる契約にも組み込むことはでき ません。以下の事項は、マテリアルやコード、機能を提供することをコミットメントするも のではない為、購買決定を行う際の判断材料になさらないで下さい。 オラクル製品に関して記載されている機能の開発、リリースおよび時期については、 弊社の裁量により決定されます。 2
3.
Copyright © 2017,
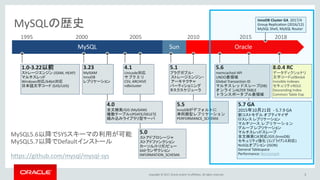
Oracle and/or its affiliates. All rights reserved. 3 MySQLの歴史 4.0 全文検索/GIS (MyISAM) 複数テーブルUPDATE/DELETE 組み込みライブラリ型サーバ OracleMySQL Sun 3.23 MyISAM InnoDB レプリケーション 5.1 プラグガブル・ ストレージエンジン・ アーキテクチャ パーティショニング タスクスケジューラ 5.6 memcached API UNDO表領域 Global Transaction ID マルチスレッドスレーブ(DB) オンラインALTER TABLE トランスポータブル表領域 5.5 InnoDBがデフォルトに 準同期型レプリケーション PERFORMANCE_SCHEMA 1.0-3.22以前 ストレージエンジン (ISAM, HEAP) マルチスレッド Windows対応/64bit対応 日本語文字コード (SJIS/UJIS) 5.0 ストアドプロシージャ ストアドファンクション カーソル/トリガ/ビュー XAトランザクション INFORMATION_SCHEMA 4.1 Unicode対応 サブクエリ CSV, ARCHIVE ndbcluster 1995 2000 2005 2010 2015 5.7 GA 2015年10月21日 - 5.7.9 GA 新コストモデル オプティマイザ ロスレス レプリケーション マルチソース レプリケーション グループ レプリケーション マルチスレッドスレーブ 全文検索CJK対応/GIS (InnoDB) セキュリティ強化 (コンプライアンス対応) NoSQLオプション (JSON) General Tablespace Performance: Benchmark MySQL5.6以降でSYSスキーマの利用が可能 MySQL5.7以降でDefaultインストール https://github.com/mysql/mysql-sys 8.0.4 RC データディクショナリ 文字コードutf8mb4 Invisible Indexes セキュリティROLE Descending Index Common Table Exp InnoDB Cluster GA 2017/4 Group Replication (2016/12) MySQL Shell, MySQL Router 2018
4.
Copyright © 2017,
Oracle and/or its affiliates. All rights reserved. 4 MySQL SYSスキーマ MySQL管理者がMySQLデータベースの使用状況を 把握するのに役立つビュー、関数、プロシジャーの集まり。 root@localhost [sys]> select * from schema_object_overview where db = 'sys'; +-----+---------------+-------+ | db | object_type | count | +-----+---------------+-------+ | sys | TRIGGER | 2 | | sys | FUNCTION | 22 | | sys | PROCEDURE | 26 | | sys | VIEW | 100 | | sys | BASE TABLE | 1 | | sys | INDEX (BTREE) | 1 | +-----+---------------+-------+ 6 rows in set (0.32 sec)
5.
Copyright © 2017,
Oracle and/or its affiliates. All rights reserved. 5 VIEWの種類 statement_* SQL文分析ビュー user_* ユーザ集計ビュー host_* ホスト 集計ビュー io_* ファイルIO 集計ビュー schema_* スキーマ分析ビュー wait_* 「待機」分析ビュー [sys]> show tables like '%statement%'; +-----------------------------------------------+ | Tables_in_sys (%statement%) | +-----------------------------------------------+ | host_summary_by_statement_latency | | host_summary_by_statement_type | | statement_analysis | | statements_with_errors_or_warnings | | statements_with_full_table_scans | | statements_with_runtimes_in_95th_percentile | | statements_with_sorting | | statements_with_temp_tables | | user_summary_by_statement_latency | | user_summary_by_statement_type | | x$host_summary_by_statement_latency | | x$host_summary_by_statement_type | | x$statement_analysis | | x$statements_with_errors_or_warnings | | x$statements_with_full_table_scans | | x$statements_with_runtimes_in_95th_percentile | | x$statements_with_sorting | | x$statements_with_temp_tables | | x$user_summary_by_statement_latency | | x$user_summary_by_statement_type | +-----------------------------------------------+ X$から始まるViewとX$が付かないViewがある X$が付かないViewは、 管理者が分かり易いよう に”ms”, “s”等の単位が付加されている。 +--------------+---------------+--------------+ | host | total_latency | lock_latency | +--------------+---------------+--------------+ | 192.168.56.1 | 5.88 s | 5.32 s | | localhost | 2.55 s | 1.38 s | | background | 0 ps | 0 ps | +--------------+---------------+--------------+
6.
Copyright © 2017,
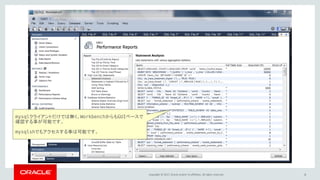
Oracle and/or its affiliates. All rights reserved. 6 mysqlクライアントだけでは無く、WorkbenchからもGUIベースで 確認する事が可能です。 mysqlshでもアクセスする事は可能です。
7.
Copyright © 2017,
Oracle and/or its affiliates. All rights reserved. VIEWS 7
8.
Copyright © 2017,
Oracle and/or its affiliates. All rights reserved. 8 host_summaryおよびx$host_summaryビュー これらのビューは、SQLステートメントのアクティビティ、ファイルI / O、 および接続をホスト別にまとめたものです。 root@localhost [sys]> SELECT * FROM sys.host_summary limit 1¥G *************************** 1. row *************************** host: 192.168.56.1 statements: 550 statement_latency: 6.35 s statement_avg_latency: 11.54 ms table_scans: 195 file_ios: 5335 file_io_latency: 4.18 s current_connections: 2 total_connections: 4 unique_users: 1 current_memory: 0 bytes total_memory_allocated: 0 bytes 1 row in set (0.06 sec) root@localhost [sys]>
9.
Copyright © 2017,
Oracle and/or its affiliates. All rights reserved. 9 host_summary_by_file_ioおよび x$host_summary_by_file_ioビュー これらのビューは、ファイルI / Oをホストごとにまとめたものです。 デフォルトでは、 ファイルI / O全体のレイテンシが降順に並べ替えられて行がソートされます。 root@localhost [sys]> SELECT * FROM sys.host_summary_by_file_io limit 3¥G *************************** 1. row *************************** host: 192.168.56.1 ios: 5335 io_latency: 4.18 s *************************** 2. row *************************** host: background ios: 3798 io_latency: 3.05 s *************************** 3. row *************************** host: localhost ios: 1267 io_latency: 1.29 s 3 rows in set (0.01 sec) root@localhost [sys]>
10.
Copyright © 2017,
Oracle and/or its affiliates. All rights reserved. 10 host_summary_by_file_io_typeと x$host_summary_by_file_io_typeのビュー root@localhost [sys]> SELECT * FROM sys.host_summary_by_file_io_type limit 2¥G *************************** 1. row *************************** host: 192.168.56.1 event_name: wait/io/file/innodb/innodb_data_file total: 1155 total_latency: 2.79 s max_latency: 76.28 ms *************************** 2. row *************************** host: 192.168.56.1 event_name: wait/io/file/sql/FRM total: 2722 total_latency: 1.24 s max_latency: 72.79 ms 2 rows in set (0.02 sec) root@localhost [sys]> これらのビューは、ファイルI/Oをホストとイベントのタイプ別にまとめたものです。 デフォルトでは、行はホストごとにソートされ、合計I/Oレイテンシは降順にソートされます。
11.
Copyright © 2017,
Oracle and/or its affiliates. All rights reserved. 11 host_summary_by_stagesおよび x$host_summary_by_stagesビュー root@localhost [sys]> SELECT * FROM sys.host_summary_by_stages limit 1¥G *************************** 1. row *************************** host: background event_name: stage/innodb/buffer pool load total: 1 total_latency: 200.54 us avg_latency: 200.54 us 1 row in set (0.01 sec) root@localhost [sys]> これらのビューは、ステートメントのステージをホストごとにまとめたものです。 デフォルトでは、行はホストごとにソートされ、合計レイテンシは降順にソートされます。
12.
Copyright © 2017,
Oracle and/or its affiliates. All rights reserved. 12 host_summary_by_statement_latencyおよび x$host_summary_by_statement_latencyビュー root@localhost [sys]> SELECT * FROM sys.host_summary_by_statement_latency limit 1¥G *************************** 1. row *************************** host: 192.168.56.1 total: 554 total_latency: 6.35 s max_latency: 4.75 s lock_latency: 5.54 s rows_sent: 5845 rows_examined: 41788 rows_affected: 0 full_scans: 195 1 row in set (0.03 sec) root@localhost [sys]> これらのビューは、ホストごとにグループ化された全体的なステートメント統計を 要約します。 デフォルトでは、行は合計レイテンシを降順にソートされます。
13.
Copyright © 2017,
Oracle and/or its affiliates. All rights reserved. 13 host_summary_by_statement_typeおよび x$host_summary_by_statement_typeビュー root@localhost [sys]> SELECT * FROM sys.host_summary_by_statement_type limit 1¥G *************************** 1. row *************************** host: 192.168.56.1 statement: select total: 38 total_latency: 5.44 s max_latency: 4.75 s lock_latency: 5.43 s rows_sent: 2904 rows_examined: 8751 rows_affected: 0 full_scans: 26 1 row in set (0.01 sec) root@localhost [sys]> これらのビューは、実行されたステートメントに関する情報を、ホストおよびステートメント タイプ別にグループ化して要約したものです。 デフォルトでは、行はホストごとにソートさ れ、合計レイテンシは降順にソートされます。
14.
Copyright © 2017,
Oracle and/or its affiliates. All rights reserved. 14 innodb_buffer_stats_by_schemaと x$innodb_buffer_stats_by_schemaビュー root@localhost [sys]> SELECT * FROM sys.innodb_buffer_stats_by_schema limit 1¥G *************************** 1. row *************************** object_schema: InnoDB System allocated: 3.06 MiB data: 2.53 MiB pages: 196 pages_hashed: 45 pages_old: 13 rows_cached: 3181 1 row in set (0.13 sec) root@localhost [sys]> これらのビューは、スキーマごとにグループ化された INFORMATION_SCHEMA INNODB_BUFFER_PAGE表の情報を要約します。 デフォルトでは、行はバッファサイズの降順でソートされます。
15.
Copyright © 2017,
Oracle and/or its affiliates. All rights reserved. 15 innodb_buffer_stats_by_tableと x$innodb_buffer_stats_by_tableのビュー root@localhost [sys]> SELECT * FROM sys.innodb_buffer_stats_by_table limit 1¥G *************************** 1. row *************************** object_schema: InnoDB System object_name: SYS_TABLES allocated: 3.14 MiB data: 2.79 MiB pages: 201 pages_hashed: 6 pages_old: 0 rows_cached: 9747 1 row in set (0.15 sec) root@localhost [sys]> これらのビューは、INFORMATION_SCHEMA INNODB_BUFFER_PAGE表の情報を スキーマと表でグループ化して要約したものです。 デフォルトでは、行はバッファサイズの降順でソートされます。
16.
Copyright © 2017,
Oracle and/or its affiliates. All rights reserved. 16 innodb_lock_waitsとx $ innodb_lock_waitsビュー root@localhost [sys]> SELECT * FROM sys.innodb_lock_waits limit 1¥G *************************** 1. row *************************** wait_started: 2018-03-09 13:30:03 wait_age: 00:00:03 wait_age_secs: 3 locked_table: `world`.`Demo_City` locked_index: GEN_CLUST_INDEX <SNIP> waiting_query: update Demo_City set Name = 'Japan2' where ID = 1 waiting_lock_id: 1504133:5522:5:2 waiting_lock_mode: X blocking_trx_id: 1504132 blocking_pid: 9 blocking_query: NULL blocking_lock_id: 1504132:5522:5:2 <SNIP> blocking_trx_rows_modified: 1 sql_kill_blocking_query: KILL QUERY 9 sql_kill_blocking_connection: KILL 9 1 row in set, 3 warnings (0.00 sec) これらのビューは、トランザクションが待機しているInnoDBロックを要約しています。 既定では、行の降順でロックの経過時間がソートされます。
17.
Copyright © 2017,
Oracle and/or its affiliates. All rights reserved. 17 io_by_thread_by_latencyと x$io_by_thread_by_latencyビュー root@localhost [sys]> SELECT * FROM sys.io_by_thread_by_latency limit 1¥G *************************** 1. row *************************** user: admin@192.168.56.1 total: 3723 total_latency: 4.04 s min_latency: 23.68 ns avg_latency: 708.06 us max_latency: 76.28 ms thread_id: 32 processlist_id: 8 1 row in set (0.03 sec) root@localhost [sys]> これらのビューは、スレッドごとにグループ化されたI/O待機時間を表示するためにI/O コンシューマを要約します。デフォルトで、行は合計I/O待ち時間を降順にソートされます。
18.
Copyright © 2017,
Oracle and/or its affiliates. All rights reserved. 18 io_global_by_file_by_bytesおよび x$io_global_by_file_by_bytesビュー root@localhost [sys]> SELECT * FROM sys.io_global_by_file_by_bytes limit 1¥G *************************** 1. row *************************** file: @@basedir/data/ibtmp1 count_read: 0 total_read: 0 bytes avg_read: 0 bytes count_write: 550 total_written: 20.41 MiB avg_write: 37.99 KiB total: 20.41 MiB write_pct: 100.00 1 row in set (0.01 sec) root@localhost [sys]> これらのビューは、グローバルI/Oコンシューマを要約して、I/Oの量をファイルごとに グループ化して表示します。 デフォルトでは、行は合計I/O(読み書きされたバイト数)を 降順にソートされます。
19.
Copyright © 2017,
Oracle and/or its affiliates. All rights reserved. 19 io_global_by_file_by_latencyおよび x$io_global_by_file_by_latencyビュー root@localhost [sys]> SELECT * FROM sys.io_global_by_file_by_latency limit 1¥G *************************** 1. row *************************** file: @@basedir/data/ibdata1 total: 500 total_latency: 1.50 s count_read: 463 read_latency: 1.39 s count_write: 18 write_latency: 95.42 ms count_misc: 19 misc_latency: 16.43 ms 1 row in set (0.01 sec) root@localhost [sys]> これらのビューは、グローバルI/Oコンシューマを要約し、ファイルごとにグループ化され たI/O待機時間を表示します。デフォルトで、行は合計レイテンシを降順にソートされます。
20.
Copyright © 2017,
Oracle and/or its affiliates. All rights reserved. 20 io_global_by_wait_by_bytesおよび x$io_global_by_wait_by_bytesビュー root@localhost [sys]> SELECT * FROM sys.io_global_by_wait_by_bytes limit 1¥G *************************** 1. row *************************** event_name: innodb/innodb_data_file total: 3697 total_latency: 5.39 s min_latency: 0 ps avg_latency: 1.46 ms max_latency: 93.00 ms count_read: 1193 total_read: 20.76 MiB avg_read: 17.82 KiB count_write: 572 total_written: 20.88 MiB avg_written: 37.37 KiB total_requested: 41.63 MiB 1 row in set (0.01 sec) これらのビューは、グローバルI/Oコンシューマを要約して、I/Oの量とI/Oを待機する時間 をイベント別にグループ化して表示します。 デフォルトでは、行は合計I/O(読み書きされ たバイト数)を降順にソートされます。
21.
Copyright © 2017,
Oracle and/or its affiliates. All rights reserved. 21 io_global_by_wait_by_latencyおよび x$io_global_by_wait_by_latencyビュー root@localhost [sys]> SELECT * FROM sys.io_global_by_wait_by_latency limit 1¥G *************************** 1. row *************************** event_name: innodb/innodb_data_file total: 3697 total_latency: 5.39 s avg_latency: 1.46 ms max_latency: 93.00 ms read_latency: 4.68 s write_latency: 210.93 ms misc_latency: 498.60 ms count_read: 1193 total_read: 20.76 MiB avg_read: 17.82 KiB count_write: 572 total_written: 20.88 MiB avg_written: 37.37 KiB これらのビューは、グローバルI/Oコンシューマを要約して、I/Oの量とI/Oを待機する 時間をイベント別にグループ化して表示します。 デフォルトでは、行は合計レイテンシを降順にソートされます。
22.
Copyright © 2017,
Oracle and/or its affiliates. All rights reserved. 22 latest_file_ioおよびx$latest_file_ioビュー root@localhost [sys]> SELECT * FROM sys.latest_file_io limit 1¥G Empty set (0.00 sec) root@localhost [sys]> これらのビューは、ファイルとスレッドによってグループ化されたファイルI/Oアクティビティ を要約します。 デフォルトでは、行は最新のI/Oで最初にソートされます。
23.
Copyright © 2017,
Oracle and/or its affiliates. All rights reserved. 23 memory_by_host_by_current_bytesおよび x$memory_by_host_by_current_bytesビュー root@localhost [sys]> SELECT * FROM sys.memory_by_host_by_current_bytes limit 2¥G *************************** 1. row *************************** host: localhost current_count_used: 172693 current_allocated: 540.44 MiB current_avg_alloc: 3.20 KiB current_max_alloc: 469.06 MiB total_allocated: 46.28 GiB *************************** 2. row *************************** host: background current_count_used: 21 current_allocated: 992 bytes current_avg_alloc: 47 bytes current_max_alloc: 640 bytes total_allocated: 936.38 KiB 2 rows in set (0.03 sec) これらのビューは、ホストごとにグループ化されたメモリー使用量を要約します。 デフォルトでは、行は使用されたメモリ量の降順でソートされます。
24.
Copyright © 2017,
Oracle and/or its affiliates. All rights reserved. 24 memory_by_thread_by_current_bytesおよび x$memory_by_thread_by_current_bytesビュー root@localhost [sys]> SELECT * FROM sys.memory_by_thread_by_current_bytes limit 2¥G *************************** 1. row *************************** thread_id: 28 user: root@localhost current_count_used: 31 current_allocated: 484.84 KiB current_avg_alloc: 15.64 KiB current_max_alloc: 248.42 KiB total_allocated: 7.79 MiB *************************** 2. row *************************** thread_id: 24 user: innodb/dict_stats_thread current_count_used: 21 current_allocated: 992 bytes current_avg_alloc: 47 bytes current_max_alloc: 640 bytes total_allocated: 921.71 KiB これらのビューはスレッドごとにグループ化されたメモリー使用量を要約します。 デフォルトでは、行は使用されたメモリ量の降順でソートされます。
25.
Copyright © 2017,
Oracle and/or its affiliates. All rights reserved. 25 memory_by_user_by_current_bytesおよび x$memory_by_user_by_current_bytesビュー root@localhost [sys]> SELECT * FROM sys.memory_by_user_by_current_bytes limit 2¥G *************************** 1. row *************************** user: root current_count_used: 172694 current_allocated: 540.44 MiB current_avg_alloc: 3.20 KiB current_max_alloc: 469.06 MiB total_allocated: 46.29 GiB *************************** 2. row *************************** user: background current_count_used: 21 current_allocated: 992 bytes current_avg_alloc: 47 bytes current_max_alloc: 640 bytes total_allocated: 947.22 KiB 2 rows in set (0.02 sec) これらのビューは、ユーザーごとにグループ化されたメモリー使用量を要約します。 デフォルトでは、行は使用されたメモリ量の降順でソートされます。
26.
Copyright © 2017,
Oracle and/or its affiliates. All rights reserved. 26 memory_global_by_current_bytesおよび x$memory_global_by_current_bytesビュー root@localhost [sys]> SELECT * FROM sys.memory_global_by_current_bytes limit 2¥G *************************** 1. row *************************** event_name: memory/innodb/lock0lock current_count: 9166 current_alloc: 14.20 MiB current_avg_alloc: 1.59 KiB high_count: 9166 high_alloc: 14.20 MiB high_avg_alloc: 1.59 KiB *************************** 2. row *************************** event_name: memory/performance_schema/table_handles current_count: 1 current_alloc: 9.06 MiB current_avg_alloc: 9.06 MiB high_count: 1 high_alloc: 9.06 MiB high_avg_alloc: 9.06 MiB これらのビューは、割り当てタイプ(イベント別)ごとにグループ化されたメモリー使用量を 要約します。 デフォルトでは、行は使用されたメモリ量の降順でソートされます。
27.
Copyright © 2017,
Oracle and/or its affiliates. All rights reserved. 27 memory_global_totalおよびx$memory_global_totalビュー root@localhost [sys]> SELECT * FROM sys.memory_global_total limit 2¥G *************************** 1. row *************************** total_allocated: 111.71 MiB 1 row in set (0.01 sec) root@localhost [sys]> これらのビューは、サーバー内の合計メモリー使用量を要約します。
28.
Copyright © 2017,
Oracle and/or its affiliates. All rights reserved. 28 メトリックビュー root@localhost [sys]> SELECT * FROM sys.metrics limit 2¥G *************************** 1. row *************************** Variable_name: aborted_clients Variable_value: 2 Type: Global Status Enabled: YES *************************** 2. row *************************** Variable_name: aborted_connects Variable_value: 2 Type: Global Status Enabled: YES 2 rows in set (0.07 sec) root@localhost [sys]> このビューは、MySQLサーバのメトリックをまとめ、変数名、値、タイプ、およびそれらが 有効かどうかを表示します。デフォルトでは、行は変数の型と名前でソートされます。
29.
Copyright © 2017,
Oracle and/or its affiliates. All rights reserved. 29 processlistとx$processlistビュー root@localhost [sys]> SELECT * FROM sys.processlist limit 1¥G *************************** 1. row *************************** thd_id: 1 conn_id: NULL user: sql/main <SNIP> current_memory: 0 bytes last_wait: wait/synch/mutex/sql/LOCK_thread_cache last_wait_latency: 71.41 ns source: connection_handler_per_thread.cc:370 trx_latency: NULL trx_state: NULL trx_autocommit: NULL pid: NULL program_name: NULL これらのビューはプロセスリスト情報を要約します。 SHOW PROCESSLISTステートメントや INFORMATION_SCHEMA PROCESSLISTテーブルより完全な情報を提供し、非ブロック化も しています。デフォルトで、行はプロセス時間の降順と降順の待機時間でソートされます。
30.
Copyright © 2017,
Oracle and/or its affiliates. All rights reserved. 30 ps_check_lost_instrumentationビュー root@localhost [sys]> SELECT * FROM sys. ps_check_lost_instrumentation limit 1¥G *************************** 1. row *************************** variable_name: Performance_schema_rwlock_classes_lost variable_value: 3 1 row in set (0.00 sec) root@localhost [sys]> SELECT * FROM sys. ps_check_lost_instrumentation limit 2¥G *************************** 1. row *************************** variable_name: Performance_schema_rwlock_classes_lost variable_value: 3 1 row in set (0.01 sec) root@localhost [sys]> このビューは、パフォーマンススキーマがすべてのランタイムデータを監視できないか どうかを示すために、失われたパフォーマンススキーマインストゥルメントに関する情報 を返します。
31.
Copyright © 2017,
Oracle and/or its affiliates. All rights reserved. 31 schema_auto_increment_columnsビュー root@localhost [sys]> SELECT * FROM sys.schema_auto_increment_columns limit 1¥G *************************** 1. row *************************** table_schema: AdventureWorks2012 table_name: AWBuildVersion column_name: SystemInformationID data_type: tinyint column_type: tinyint(3) unsigned is_signed: 0 is_unsigned: 1 max_value: 255 auto_increment: 2 auto_increment_ratio: 0.0078 1 row in set (0.30 sec) root@localhost [sys]> このビューは、AUTO_INCREMENT列を持つ表を示し、現在および最大列の値や使用率 (使用率と使用可能な値の比)などの列に関する情報を提供します。 デフォルトでは、行 は降順の使用率と最大の列値によってソートされます。
32.
Copyright © 2017,
Oracle and/or its affiliates. All rights reserved. 32 schema_index_statisticsおよび x$schema_index_statisticsビュー root@localhost [sys]> SELECT * FROM sys.schema_index_statistics limit 1¥G *************************** 1. row *************************** table_schema: world table_name: Demo_Country index_name: PRIMARY rows_selected: 2330000 select_latency: 43.60 s rows_inserted: 0 insert_latency: 0 ps rows_updated: 0 update_latency: 0 ps rows_deleted: 0 delete_latency: 0 ps 1 row in set (0.04 sec) root@localhost [sys]> これらのビューは、索引統計を提供します。 デフォルトでは、索引レイテンシの合計が降順にソートされます。
33.
Copyright © 2017,
Oracle and/or its affiliates. All rights reserved. 33 schema_object_overviewビュー root@localhost [sys]> SELECT * FROM sys.schema_object_overview limit 2¥G *************************** 1. row *************************** db: AdventureWorks2012 object_type: BASE TABLE count: 68 *************************** 2. row *************************** db: AdventureWorks2012 object_type: INDEX (BTREE) count: 272 2 rows in set (0.26 sec) root@localhost [sys]> このビューは、各スキーマ内のオブジェクトのタイプをまとめたものです。 デフォルトでは、行はスキーマとオブジェクトタイプによってソートされます。
34.
Copyright © 2017,
Oracle and/or its affiliates. All rights reserved. 34 schema_redundant_indexesおよび x$schema_flattened_keysビュー root@localhost [sys]> SELECT * FROM sys.schema_redundant_indexes limit 1¥G *************************** 1. row *************************** table_schema: AdventureWorks2012 table_name: Address redundant_index_name: rowguid redundant_index_columns: rowguid redundant_index_non_unique: 0 dominant_index_name: AK_Address_rowguid dominant_index_columns: rowguid dominant_index_non_unique: 0 subpart_exists: 0 sql_drop_index: ALTER TABLE `AdventureWorks2012`.`Address` DROP INDEX `rowguid` 1 row in set (0.36 sec) root@localhost [sys]> schema_redundant_indexesビューには、他の索引を複製するか、 冗長化された索引が表示されます。x$schema_flattened_keysビューは、 schema_redundant_indexesのヘルパービューです。
35.
Copyright © 2017,
Oracle and/or its affiliates. All rights reserved. 35 schema_table_lock_waitsと x$schema_table_lock_waitsビュー root@localhost [sys]> SELECT * FROM sys.schema_table_lock_waits limit 1¥G *************************** 1. row *************************** object_schema: world object_name: Demo_City waiting_thread_id: 40046 waiting_pid: 40022 waiting_account: root@localhost waiting_lock_type: SHARED_WRITE waiting_lock_duration: TRANSACTION waiting_query: update Demo_City set Name = 'Japan2' where ID = 1 waiting_query_secs: 3 <SNIP> blocking_pid: 40023 blocking_account: root@localhost blocking_lock_type: SHARED_READ_ONLY blocking_lock_duration: TRANSACTION sql_kill_blocking_query: KILL QUERY 40023 sql_kill_blocking_connection: KILL 40023 これらのビューは、どのセッションがメタデータのロックを待ってブロックされているのか、 何がブロックされているのかを表示します。
36.
Copyright © 2017,
Oracle and/or its affiliates. All rights reserved. 36 schema_table_statisticsおよび x$schema_table_statisticsビュー root@localhost [sys]> SELECT * FROM sys.schema_table_statistics limit 1¥G *************************** 1. row *************************** table_schema: world table_name: Demo_City total_latency: 4.55 m rows_fetched: 40832639 fetch_latency: 4.55 m <SNIP> io_read: 448.79 KiB io_read_latency: 168.89 ms io_write_requests: 10 io_write: 160.00 KiB io_write_latency: 2.95 ms io_misc_requests: 21 io_misc_latency: 16.46 ms これらのビューは、テーブル統計を要約します。 デフォルトでは、行は合計待機時間(最 大の競合が最初に発生した表)を降順にソートされます。 これらのビューは、x$ps_schema_table_statistics_ioのヘルパービューを表示します。
37.
Copyright © 2017,
Oracle and/or its affiliates. All rights reserved. 37 schema_table_statistics_with_bufferおよび x$schema_table_statistics_with_bufferビュー root@localhost [sys]> SELECT * FROM sys.schema_table_statistics_with_buffer limit 1¥G *************************** 1. row *************************** table_schema: world table_name: Demo_City rows_fetched: 40832639 fetch_latency: 4.55 m rows_inserted: 0 insert_latency: 0 ps <SNIP> io_misc_latency: 16.46 ms innodb_buffer_allocated: 416.00 KiB innodb_buffer_data: 362.88 KiB innodb_buffer_free: 53.12 KiB innodb_buffer_pages: 26 innodb_buffer_pages_hashed: 0 innodb_buffer_pages_old: 0 innodb_buffer_rows_cached: 4104 これらのビューは、InnoDBバッファプール統計を含むテーブル統計を要約しています。 デフォルトでは、行は合計待機時間(最大の競合が最初に発生した表)を降順にソート。
38.
Copyright © 2017,
Oracle and/or its affiliates. All rights reserved. 38 schema_tables_with_full_table_scansおよび x$schema_tables_with_full_table_scansビュー root@localhost [sys]> SELECT * FROM sys.schema_tables_with_full_table_scans limit 2¥G *************************** 1. row *************************** object_schema: world object_name: Demo_City rows_full_scanned: 40832639 latency: 4.55 m *************************** 2. row *************************** object_schema: world object_name: Demo_CountryLanguage rows_full_scanned: 9850000 latency: 1.50 m 2 rows in set (0.04 sec) これらのビューは、フル・テーブル・スキャンでどの表にアクセスしているかを表示します。 デフォルトでは、行は降順にスキャンされた行によってソートされます。
39.
Copyright © 2017,
Oracle and/or its affiliates. All rights reserved. 39 schema_unused_indexesビュー root@localhost [sys]> SELECT * FROM sys.schema_unused_indexes limit 3¥G *************************** 1. row *************************** object_schema: AdventureWorks2012 object_name: Address index_name: IX_Address_AddressLine1_AddressLine2_City_StateProvinceID_Post13 *************************** 2. row *************************** object_schema: AdventureWorks2012 object_name: Address index_name: AK_Address_rowguid *************************** 3. row *************************** object_schema: AdventureWorks2012 object_name: Address index_name: rowguid 3 rows in set (0.04 sec) root@localhost [sys]> これらのビューには、使用されていないことを示すイベントが存在しないインデックスが 表示されます。 デフォルトでは、行はスキーマとテーブルによってソートされます。
40.
Copyright © 2017,
Oracle and/or its affiliates. All rights reserved. 40 The sessionとx$sessionビュー root@localhost [sys]> SELECT * FROM sys.session limit 1¥G *************************** 1. row *************************** thd_id: 10039 conn_id: 10015 user: admin@192.168.56.1 db: NULL command: Sleep <SNIP> source: socket_connection.cc:69 trx_latency: NULL trx_state: NULL trx_autocommit: NULL pid: 9860 program_name: MySQLWorkbench 1 row in set (0.28 sec) root@localhost [sys]> これらのビューはprocesslistとx $ processlistに似ていますが、バックグラウンド・プロセス を除外してユーザー・セッションのみを表示します。
41.
Copyright © 2017,
Oracle and/or its affiliates. All rights reserved. 41 session_ssl_statusビュー root@localhost [sys]> SELECT * FROM sys.session_ssl_status limit 2¥G *************************** 1. row *************************** thread_id: 28 ssl_version: ssl_cipher: ssl_sessions_reused: 0 *************************** 2. row *************************** thread_id: 31 ssl_version: TLSv1.1 ssl_cipher: DHE-RSA-AES256-SHA ssl_sessions_reused: 0 2 rows in set (0.01 sec) root@localhost [sys]> 接続ごとに、このビューにはSSLバージョン、暗号、および再使用されたSSL セッションの数が表示されます。
42.
Copyright © 2017,
Oracle and/or its affiliates. All rights reserved. 42 statement_analysisとx$statement_analysisビュー root@localhost [sys]> SELECT * FROM sys.statement_analysis limit 1¥G *************************** 1. row *************************** query: SELECT LANGUAGE , COUNT ( LANG ... ROUP BY LANGUAGE LIMIT ?, ... db: world full_scan: * exec_count: 10000 err_count: 0 warn_count: 0 total_latency: 13.91 m max_latency: 723.74 ms <SNIP> rows_sorted: 100000 sort_merge_passes: 0 digest: 41d00de8eda848e48552d7282da0e4b6 first_seen: 2018-03-09 13:58:39 last_seen: 2018-03-09 14:01:27 これらのビューは、統計を集計した正規化されたステートメントをリストします。 このコンテンツは、MySQL Enterprise Monitor Query Analysisビューに似ています。 デフォルトでは、行は合計レイテンシを降順にソートされます。
43.
Copyright © 2017,
Oracle and/or its affiliates. All rights reserved. 43 statements_with_errors_or_warningsおよび x$statements_with_errors_or_warningsビュー root@localhost [sys]> SELECT * FROM sys.statements_with_errors_or_warnings limit 1¥G *************************** 1. row *************************** query: SELECT `r` . `trx_wait_started ... k_id` , `bl` . `lock_mode` AS db: sys exec_count: 2 errors: 0 error_pct: 0.0000 warnings: 6 warning_pct: 300.0000 first_seen: 2018-03-09 13:27:43 last_seen: 2018-03-09 13:30:07 digest: c45b5b6253e8459b144890f2fc813688 1 row in set (0.01 sec) root@localhost [sys]> これらのビューは、エラーまたは警告を生成した正規化されたステートメントを表示しま す。 デフォルトでは、行は降順のエラーと警告数によってソートされます。
44.
Copyright © 2017,
Oracle and/or its affiliates. All rights reserved. 44 statements_with_full_table_scansおよび x$statements_with_full_table_scansビュー root@localhost [sys]> SELECT * FROM sys.statements_with_full_table_scans limit 1¥G *************************** 1. row *************************** query: SELECT COUNT (?) AS `cnt` , `r ... _by_digest` GROUP BY `avg_us` db: myosm exec_count: 4 total_latency: 9.47 ms no_index_used_count: 4 no_good_index_used_count: 0 no_index_used_pct: 100 rows_sent: 36 rows_examined: 36 rows_sent_avg: 9 rows_examined_avg: 9 first_seen: 2018-03-09 12:54:54 last_seen: 2018-03-09 12:54:54 digest: c8e66a8fed8ba76991dbc223e5781b6f これらのビューには、フル・テーブル・スキャンを行った正規化された文が表示されます。 デフォルトでは、フルスキャンが完了した時間の割合が降順になり、合計レイテンシが 降順にソートされます。
45.
Copyright © 2017,
Oracle and/or its affiliates. All rights reserved. 45 statements_with_runtimes_in_95th_percentileおよび x$statements_with_runtimes_in_95th_percentileビュー root@localhost [sys]> SELECT * FROM sys.statements_with_runtimes_in_95th_percentile limit 1¥G *************************** 1. row *************************** query: UPDATE `Demo_City` SET NAME = ? WHERE `ID` = ? db: world full_scan: exec_count: 6 err_count: 0 warn_count: 0 total_latency: 1.43 m max_latency: 51.27 s avg_latency: 14.31 s rows_sent: 0 rows_sent_avg: 0 rows_examined: 24474 rows_examined_avg: 4079 first_seen: 2018-03-09 13:30:02 last_seen: 2018-03-09 14:46:47 digest: 2f1b0052c8ecff3f76fb0b2682de295a これらのビューは、ランタイムが95パーセンタイルであるステートメントをリストします。 デフォルトでは、行は平均待ち時間の降順でソートされます。
46.
Copyright © 2017,
Oracle and/or its affiliates. All rights reserved. 46 statements_with_sortingおよび x$statements_with_sortingビュー root@localhost [sys]> SELECT * FROM sys.statements_with_sorting limit 1¥G *************************** 1. row *************************** query: SELECT LANGUAGE , COUNT ( LANG ... ROUP BY LANGUAGE LIMIT ?, ... db: world exec_count: 10000 total_latency: 13.91 m sort_merge_passes: 0 avg_sort_merges: 0 sorts_using_scans: 10000 sort_using_range: 0 rows_sorted: 100000 avg_rows_sorted: 10 first_seen: 2018-03-09 13:58:39 last_seen: 2018-03-09 14:01:27 digest: 41d00de8eda848e48552d7282da0e4b6 1 row in set (0.01 sec) これらのビューは、ソートを実行した正規化されたステートメントをリストします。 デフォルトでは、行は合計レイテンシを降順にソートされます。
47.
Copyright © 2017,
Oracle and/or its affiliates. All rights reserved. 47 statements_with_temp_tablesおよび x$statements_with_temp_tablesビュー root@localhost [sys]> SELECT * FROM sys.statements_with_temp_tables limit 1¥G *************************** 1. row *************************** query: SELECT `information_schema` . ... SELECT `information_schema` . db: sys exec_count: 4 total_latency: 1.03 s memory_tmp_tables: 804 disk_tmp_tables: 144 avg_tmp_tables_per_query: 201 tmp_tables_to_disk_pct: 18 first_seen: 2018-03-09 12:30:37 last_seen: 2018-03-09 14:34:47 digest: 778282a821be7a22a384b0043b1bccdc 1 row in set (0.00 sec) これらのビューには、一時表を使用した正規化された文がリストされます。 デフォルトで は、使用されるディスク上の一時テーブルの数の降順、および使用されるメモリ内の一 時テーブルの降順で行がソートされます。
48.
Copyright © 2017,
Oracle and/or its affiliates. All rights reserved. 48 user_summaryとx$user_summaryのビュー root@localhost [sys]> SELECT * FROM sys.user_summary limit 1¥G *************************** 1. row *************************** user: root statements: 132948 statement_latency: 20.11 m statement_avg_latency: 9.07 ms table_scans: 10118 file_ios: 134514 file_io_latency: 2.26 m current_connections: 3 total_connections: 40012 unique_hosts: 1 current_memory: 556.81 MiB total_memory_allocated: 47.05 GiB 1 row in set (0.07 sec) これらのビューは、ユーザーによってグループ化された文のアクティビティ、ファイルI/O、 および接続を要約します。 デフォルトでは、行は合計レイテンシを降順にソートされます。
49.
Copyright © 2017,
Oracle and/or its affiliates. All rights reserved. 49 user_summary_by_file_ioと x$user_summary_by_file_ioのビュー root@localhost [sys]> SELECT * FROM sys.user_summary_by_file_io limit 3¥G *************************** 1. row *************************** user: root ios: 134522 io_latency: 2.26 m *************************** 2. row *************************** user: background ios: 6649 io_latency: 4.70 s *************************** 3. row *************************** user: admin ios: 5735 io_latency: 4.18 s 3 rows in set (0.02 sec) root@localhost [sys]> これらのビューは、ファイルI / Oをユーザー別にまとめたものです。 デフォルトでは、 ファイルI / O全体のレイテンシが降順に並べ替えられて行がソートされます。
50.
Copyright © 2017,
Oracle and/or its affiliates. All rights reserved. 50 user_summary_by_file_io_typeと x$user_summary_by_file_io_typeのビュー root@localhost [sys]> SELECT * FROM sys.user_summary_by_file_io_type limit 2¥G *************************** 1. row *************************** user: admin event_name: wait/io/file/innodb/innodb_data_file total: 1155 latency: 2.79 s max_latency: 76.28 ms *************************** 2. row *************************** user: admin event_name: wait/io/file/sql/FRM total: 3025 latency: 1.24 s max_latency: 72.79 ms 2 rows in set (0.02 sec) これらのビューは、ファイルI / Oをユーザーとイベントのタイプ別にまとめたものです。 デフォルトでは、行はユーザー別と合計レイテンシの降順でソートされます。
51.
Copyright © 2017,
Oracle and/or its affiliates. All rights reserved. 51 user_summary_by_stagesと x$user_summary_by_stagesビュー root@localhost [sys]> SELECT * FROM sys.user_summary_by_stages limit 2¥G *************************** 1. row *************************** user: admin event_name: stage/sql/updating total: 4 total_latency: 13.13 w avg_latency: 18.53 w *************************** 2. row *************************** user: admin event_name: stage/sql/Sending data total: 3898 total_latency: 5.53 s avg_latency: 1.42 ms 2 rows in set (0.01 sec) これらのビューは、ユーザー別にグループ化されたステージを要約します。 デフォルトでは、行はユーザーごとに並べ替えられ、ステージの合計レイテンシは 降順で並べ替えられます。
52.
Copyright © 2017,
Oracle and/or its affiliates. All rights reserved. 52 user_summary_by_statement_latencyと x$user_summary_by_statement_latencyビュー root@localhost [sys]> SELECT * FROM sys.user_summary_by_statement_latency limit 1¥G *************************** 1. row *************************** user: root total: 133238 total_latency: 20.11 m max_latency: 53.49 s lock_latency: 15.58 m rows_sent: 104639 rows_examined: 75184318 rows_affected: 30006 full_scans: 10125 1 row in set (0.02 sec) これらのビューは、ユーザーごとにグループ化された全体的なステートメント統計を 要約します。 デフォルトでは、行は合計レイテンシを降順にソートされます。
53.
Copyright © 2017,
Oracle and/or its affiliates. All rights reserved. 53 user_summary_by_statement_typeおよび x$user_summary_by_statement_typeビュー root@localhost [sys]> SELECT * FROM sys.user_summary_by_statement_type limit 1¥G *************************** 1. row *************************** user: admin statement: show_status total: 2029 total_latency: 10.01 s max_latency: 90.32 ms lock_latency: 813.05 ms rows_sent: 749254 rows_examined: 1501484 rows_affected: 0 full_scans: 2029 1 row in set (0.01 sec) これらのビューは、実行されたステートメントに関する情報を、ユーザーおよび ステートメントタイプごとにまとめたものです。デフォルトでは、行はユーザー別と 合計レイテンシの降順でソートされます。
54.
Copyright © 2017,
Oracle and/or its affiliates. All rights reserved. 54 versionビュー root@localhost [sys]> SELECT * FROM sys.version limit 1¥G *************************** 1. row *************************** sys_version: 1.5.1 mysql_version: 5.7.21-enterprise-commercial-advanced-log 1 row in set (0.00 sec) root@localhost [sys]> このビューには、現在のsysスキーマとMySQLサーバのバージョンが表示されます。
55.
Copyright © 2017,
Oracle and/or its affiliates. All rights reserved. 55 wait_classes_global_by_avg_latencyおよび x$wait_classes_global_by_avg_latencyビュー root@localhost [sys]> SELECT * FROM sys.wait_classes_global_by_avg_latency limit 2¥G *************************** 1. row *************************** event_class: wait/lock/metadata total: 1 total_latency: 49.19 s min_latency: 49.19 s avg_latency: 49.19 s max_latency: 49.19 s *************************** 2. row *************************** event_class: wait/synch/cond total: 13665 total_latency: 1.77 m min_latency: 0 ps avg_latency: 7.78 ms max_latency: 49.19 s 2 rows in set (0.08 sec) これらのビューは、待機クラス平均待ち時間をイベントクラス別にまとめたものです。 デ フォルトでは、行は平均待ち時間の降順でソートされます。 idleイベントは無視されます。
56.
Copyright © 2017,
Oracle and/or its affiliates. All rights reserved. 56 wait_classes_global_by_latencyおよび x$wait_classes_global_by_latencyビュー root@localhost [sys]> SELECT * FROM sys.wait_classes_global_by_latency limit 2¥G *************************** 1. row *************************** event_class: wait/io/table total: 53042646 total_latency: 6.88 m min_latency: 370 ps avg_latency: 7.78 us max_latency: 21.26 s *************************** 2. row *************************** event_class: wait/io/socket total: 393356 total_latency: 4.55 m min_latency: 0 ps avg_latency: 694.34 us max_latency: 145.51 ms 2 rows in set (0.09 sec) これらのビューは、待機クラスの合計待ち時間をイベントクラス別にまとめたものです。 デフォルトで、行は合計レイテンシを降順にソートされます。idleイベントは無視されます。
57.
Copyright © 2017,
Oracle and/or its affiliates. All rights reserved. 57 waits_by_host_by_latencyと x$waits_by_host_by_latencyのビュー root@localhost [sys]> SELECT * FROM sys.waits_by_host_by_latency limit 2¥G *************************** 1. row *************************** host: 192.168.56.1 event: wait/io/file/innodb/innodb_data_file total: 1155 total_latency: 2.79 s avg_latency: 2.42 ms max_latency: 76.28 ms *************************** 2. row *************************** host: 192.168.56.1 event: wait/io/file/sql/FRM total: 3025 total_latency: 1.24 s avg_latency: 409.64 us max_latency: 72.79 ms これらのビューは、ホストおよびイベントによってグループ化された待機イベントを要約し ます。 デフォルトでは、行はホストごとにソートされ、合計レイテンシは降順にソートされ ます。 idleイベントは無視されます。
58.
Copyright © 2017,
Oracle and/or its affiliates. All rights reserved. 58 waits_by_user_by_latencyと x$waits_by_user_by_latencyのビュー root@localhost [sys]> SELECT * FROM sys.waits_by_user_by_latency limit 2¥G *************************** 1. row *************************** user: admin event: wait/io/file/innodb/innodb_data_file total: 1155 total_latency: 2.79 s avg_latency: 2.42 ms max_latency: 76.28 ms *************************** 2. row *************************** user: admin event: wait/io/file/sql/FRM total: 3025 total_latency: 1.24 s avg_latency: 409.64 us max_latency: 72.79 ms 2 rows in set (0.02 sec) これらのビューは、ユーザーおよびイベントごとにグループ化された待機イベントを要約 します。 デフォルトでは、行はユーザー別と合計レイテンシの降順でソートされます。 idleイベントは無視されます。
59.
Copyright © 2017,
Oracle and/or its affiliates. All rights reserved. 59 waits_global_by_latencyと x$waits_global_by_latencyビュー root@localhost [sys]> SELECT * FROM sys.waits_global_by_latency limit 2¥G *************************** 1. row *************************** events: wait/io/table/sql/handler total: 53042646 total_latency: 6.88 m avg_latency: 7.78 us max_latency: 21.26 s *************************** 2. row *************************** events: wait/io/socket/sql/client_connection total: 363355 total_latency: 4.55 m avg_latency: 750.97 us max_latency: 145.51 ms 2 rows in set (0.06 sec) root@localhost [sys]> これらのビューは、イベントごとにグループ化された待機イベントを要約します。 デフォルトで、行は合計レイテンシを降順にソートされます。idleイベントは無視されます。
60.
Copyright © 2017,
Oracle and/or its affiliates. All rights reserved. ストアドプロシジャー 60
61.
Copyright © 2017,
Oracle and/or its affiliates. All rights reserved. 61 create_synonym_db()プロシージャ root@localhost [sys]> SHOW DATABASES like 'info%'; +--------------------+ | Database (info%) | +--------------------+ | information_schema | +--------------------+ root@localhost [sys]> CALL create_synonym_db('INFORMATION_SCHEMA', 'info'); +-----------------------------------------+ | summary | +-----------------------------------------+ | Created 63 views in the `info` database | +-----------------------------------------+ root@localhost [sys]> SHOW DATABASES like 'info%'; +--------------------+ | Database (info%) | +--------------------+ | information_schema | | info | +--------------------+ スキーマ名を指定すると、元のスキーマ内のすべての表およびビューを参照するビュー を含む同義語スキーマが作成されます。 これは、たとえば、長い名前のスキーマ (INFORMATION_SCHEMAではなくinfoなど)を参照する短い名前を作成できます。
62.
Copyright © 2017,
Oracle and/or its affiliates. All rights reserved. 62 diagnostics()プロシージャ [admin@GA01 ~]$ mysql -u root -ppassword -e "CALL sys.diagnostics(10,5,'current')“ <SNIP> Delta host_summary_by_stages host event_name total total_latency avg_latency 192.168.56.1 stage/sql/Sending data 4 5.85 ms 1.46 ms 192.168.56.1 stage/sql/freeing items 2 1.96 ms 981.06 us 192.168.56.1 stage/sql/starting 4 745.09 us 186.27 us 192.168.56.1 stage/sql/init 2 261.54 us 130.77 us 192.168.56.1 stage/sql/Opening tables 2 58.09 us 29.04 us 192.168.56.1 stage/sql/query end 2 53.44 us 26.72 us <SNIP> 診断の目的で、現在のサーバー状態のレポートを作成します。 call sys.diagnostics(最大実行時間,間隔秒 ,'current') デフォルトはそれぞれ60, 30, currentとなっており,30秒ごとに最大で60秒,つまり2回の出力を行う。 #current: 現在有効な計器とコンシューマーからのみデータの採取を行う #medium: いくつかの計器とコンシューマーを有効にして、データの採取を行う #full: すべての計器とコンシューマーを有効にして、データの採取を行う
63.
Copyright © 2017,
Oracle and/or its affiliates. All rights reserved. 63 ps_trace_statement_digest()プロシージャ root@localhost [sys]> CALL ps_trace_statement_digest('41d00de8eda848e48552d7282da0e4b6', 10, 0.1, TRUE, TRUE); +-------------------+ | summary | +-------------------+ | Disabled 1 thread | +-------------------+ 1 row in set (0.01 sec) <SNIP> +------------+-----------+-----------+-----------+---------------+---------------+------------+------------+ | executions | exec_time | lock_time | rows_sent | rows_affected | rows_examined | tmp_tables | full_scans | +------------+-----------+-----------+-----------+---------------+---------------+------------+------------+ | 294 | 44.41 s | 44.37 s | 2940 | 0 | 2204118 | 588 | 294 | +------------+-----------+-----------+-----------+---------------+---------------+------------+------------+ 1 row in set (9.67 sec) 特定ステートメントダイジェストの全てのパフォーマンススキーマインストゥルメンテーショ ンをトレースします。パフォーマンス・スキーマのevents_statements_summary_by_digest 表内で関心のある文を見つけた場合は、このプロシージャーのDIGEST列MD5値を指定 し、ポーリングの期間と間隔を指定します。 結果は、その期間のダイジェストのパフォー マンススキーマ内で追跡されたすべての統計情報のレポートです。
64.
Copyright © 2017,
Oracle and/or its affiliates. All rights reserved. 64 ps_trace_thread()プロシージャ root@localhost [sys]> CALL ps_trace_thread(25, CONCAT('/usr/local/mysql/mysql-files/stack-', REPLACE(NOW(), ' ', '-'), '.dot'), NULL, NULL, TRUE, TRUE, TRUE); +--------------------+ | summary | +--------------------+ | Disabled 0 threads | +--------------------+ 1 row in set (0.01 sec) +---------------------------------------------+ | Info | +---------------------------------------------+ | Data collection starting for THREAD_ID = 25 | +---------------------------------------------+ 1 row in set (0.03 sec) +-----------------------------------------------------------------------------------+ | Info | +-----------------------------------------------------------------------------------+ | Stack trace written to /usr/local/mysql/mysql-files/stack-2018-03-09-16:32:17.dot | +-----------------------------------------------------------------------------------+ 計測されたスレッドのすべてのパフォーマンススキーマデータをDOT形式のグラフファイ ル(DOTグラフ記述言語用)にダンプします。 プロシージャから返される各結果セットは、 完全なグラフに使用する必要があります。
65.
Copyright © 2017,
Oracle and/or its affiliates. All rights reserved. 65 ps_truncate_all_tables() プロシジャー すべてのパフォーマンス・スキーマのサマリー表をTruncateして、集計されたすべての 計測をスナップショットとしてリセットします。 いくつのテーブルが切り捨てられたかを示す結果セットを生成します。 任意のクエリーのパフォーマンスを確認する直前に実行すると、容易にパフォーマンスを 確認する事が可能。 mysql> CALL sys.ps_truncate_all_tables(FALSE); +---------------------+ | summary | +---------------------+ | Truncated 44 tables | +---------------------+ 1 row in set (0.03 sec) FALSEの代わりに、TRUEにすると結果セットのみで無く各TRUNCATE実行コマンドが表示される。
66.
Copyright © 2017,
Oracle and/or its affiliates. All rights reserved. 66 参照 26.4.3 sys Schema Views https://dev.mysql.com/doc/refman/5.7/en/sys-schema-views.html GITHUB https://github.com/mysql/mysql-sys VIEWに関しては、MySQL5.7.21の状態の全てのVIEWをリストアップしてあります。 但し、プロシジャーに関しては通常の運用で利用しないようなプロシジャーもある為、 全てを網羅していません。必要に応じて確認下さい。
67.
Copyright © 2017,
Oracle and/or its affiliates. All rights reserved. 67 APPENDIX より簡単に工数をかけずに、継続的にMySQLのパフォーマンスを確認したい 場合は、MySQL Enterprises Monitorを検討下さい。 https://www.mysql.com/jp/products/enterprise/monitor.html https://www.mysql.com/jp/products/enterprise/monitor-features.html
68.
Copyright © 2017,
Oracle and/or its affiliates. All rights reserved. 68
Download


![Copyright © 2017, Oracle and/or its affiliates. All rights reserved. 4
MySQL SYSスキーマ
MySQL管理者がMySQLデータベースの使用状況を
把握するのに役立つビュー、関数、プロシジャーの集まり。
root@localhost [sys]> select * from schema_object_overview where db = 'sys';
+-----+---------------+-------+
| db | object_type | count |
+-----+---------------+-------+
| sys | TRIGGER | 2 |
| sys | FUNCTION | 22 |
| sys | PROCEDURE | 26 |
| sys | VIEW | 100 |
| sys | BASE TABLE | 1 |
| sys | INDEX (BTREE) | 1 |
+-----+---------------+-------+
6 rows in set (0.32 sec)](https://image.slidesharecdn.com/mysqlsysschema-180310230645/85/MySQL-SYS-4-320.jpg)
![Copyright © 2017, Oracle and/or its affiliates. All rights reserved. 5
VIEWの種類
statement_* SQL文分析ビュー
user_* ユーザ集計ビュー
host_* ホスト 集計ビュー
io_* ファイルIO 集計ビュー
schema_* スキーマ分析ビュー
wait_* 「待機」分析ビュー
[sys]> show tables like '%statement%';
+-----------------------------------------------+
| Tables_in_sys (%statement%) |
+-----------------------------------------------+
| host_summary_by_statement_latency |
| host_summary_by_statement_type |
| statement_analysis |
| statements_with_errors_or_warnings |
| statements_with_full_table_scans |
| statements_with_runtimes_in_95th_percentile |
| statements_with_sorting |
| statements_with_temp_tables |
| user_summary_by_statement_latency |
| user_summary_by_statement_type |
| x$host_summary_by_statement_latency |
| x$host_summary_by_statement_type |
| x$statement_analysis |
| x$statements_with_errors_or_warnings |
| x$statements_with_full_table_scans |
| x$statements_with_runtimes_in_95th_percentile |
| x$statements_with_sorting |
| x$statements_with_temp_tables |
| x$user_summary_by_statement_latency |
| x$user_summary_by_statement_type |
+-----------------------------------------------+
X$から始まるViewとX$が付かないViewがある
X$が付かないViewは、 管理者が分かり易いよう
に”ms”, “s”等の単位が付加されている。
+--------------+---------------+--------------+
| host | total_latency | lock_latency |
+--------------+---------------+--------------+
| 192.168.56.1 | 5.88 s | 5.32 s |
| localhost | 2.55 s | 1.38 s |
| background | 0 ps | 0 ps |
+--------------+---------------+--------------+](https://image.slidesharecdn.com/mysqlsysschema-180310230645/85/MySQL-SYS-5-320.jpg)

![Copyright © 2017, Oracle and/or its affiliates. All rights reserved. 8
host_summaryおよびx$host_summaryビュー
これらのビューは、SQLステートメントのアクティビティ、ファイルI / O、
および接続をホスト別にまとめたものです。
root@localhost [sys]> SELECT * FROM sys.host_summary limit 1¥G
*************************** 1. row ***************************
host: 192.168.56.1
statements: 550
statement_latency: 6.35 s
statement_avg_latency: 11.54 ms
table_scans: 195
file_ios: 5335
file_io_latency: 4.18 s
current_connections: 2
total_connections: 4
unique_users: 1
current_memory: 0 bytes
total_memory_allocated: 0 bytes
1 row in set (0.06 sec)
root@localhost [sys]>](https://image.slidesharecdn.com/mysqlsysschema-180310230645/85/MySQL-SYS-8-320.jpg)
![Copyright © 2017, Oracle and/or its affiliates. All rights reserved. 9
host_summary_by_file_ioおよび
x$host_summary_by_file_ioビュー
これらのビューは、ファイルI / Oをホストごとにまとめたものです。 デフォルトでは、
ファイルI / O全体のレイテンシが降順に並べ替えられて行がソートされます。
root@localhost [sys]> SELECT * FROM sys.host_summary_by_file_io limit 3¥G
*************************** 1. row ***************************
host: 192.168.56.1
ios: 5335
io_latency: 4.18 s
*************************** 2. row ***************************
host: background
ios: 3798
io_latency: 3.05 s
*************************** 3. row ***************************
host: localhost
ios: 1267
io_latency: 1.29 s
3 rows in set (0.01 sec)
root@localhost [sys]>](https://image.slidesharecdn.com/mysqlsysschema-180310230645/85/MySQL-SYS-9-320.jpg)
![Copyright © 2017, Oracle and/or its affiliates. All rights reserved. 10
host_summary_by_file_io_typeと
x$host_summary_by_file_io_typeのビュー
root@localhost [sys]> SELECT * FROM sys.host_summary_by_file_io_type limit 2¥G
*************************** 1. row ***************************
host: 192.168.56.1
event_name: wait/io/file/innodb/innodb_data_file
total: 1155
total_latency: 2.79 s
max_latency: 76.28 ms
*************************** 2. row ***************************
host: 192.168.56.1
event_name: wait/io/file/sql/FRM
total: 2722
total_latency: 1.24 s
max_latency: 72.79 ms
2 rows in set (0.02 sec)
root@localhost [sys]>
これらのビューは、ファイルI/Oをホストとイベントのタイプ別にまとめたものです。
デフォルトでは、行はホストごとにソートされ、合計I/Oレイテンシは降順にソートされます。](https://image.slidesharecdn.com/mysqlsysschema-180310230645/85/MySQL-SYS-10-320.jpg)
![Copyright © 2017, Oracle and/or its affiliates. All rights reserved. 11
host_summary_by_stagesおよび
x$host_summary_by_stagesビュー
root@localhost [sys]> SELECT * FROM sys.host_summary_by_stages limit 1¥G
*************************** 1. row ***************************
host: background
event_name: stage/innodb/buffer pool load
total: 1
total_latency: 200.54 us
avg_latency: 200.54 us
1 row in set (0.01 sec)
root@localhost [sys]>
これらのビューは、ステートメントのステージをホストごとにまとめたものです。
デフォルトでは、行はホストごとにソートされ、合計レイテンシは降順にソートされます。](https://image.slidesharecdn.com/mysqlsysschema-180310230645/85/MySQL-SYS-11-320.jpg)
![Copyright © 2017, Oracle and/or its affiliates. All rights reserved. 12
host_summary_by_statement_latencyおよび
x$host_summary_by_statement_latencyビュー
root@localhost [sys]> SELECT * FROM sys.host_summary_by_statement_latency limit 1¥G
*************************** 1. row ***************************
host: 192.168.56.1
total: 554
total_latency: 6.35 s
max_latency: 4.75 s
lock_latency: 5.54 s
rows_sent: 5845
rows_examined: 41788
rows_affected: 0
full_scans: 195
1 row in set (0.03 sec)
root@localhost [sys]>
これらのビューは、ホストごとにグループ化された全体的なステートメント統計を
要約します。 デフォルトでは、行は合計レイテンシを降順にソートされます。](https://image.slidesharecdn.com/mysqlsysschema-180310230645/85/MySQL-SYS-12-320.jpg)
![Copyright © 2017, Oracle and/or its affiliates. All rights reserved. 13
host_summary_by_statement_typeおよび
x$host_summary_by_statement_typeビュー
root@localhost [sys]> SELECT * FROM sys.host_summary_by_statement_type limit 1¥G
*************************** 1. row ***************************
host: 192.168.56.1
statement: select
total: 38
total_latency: 5.44 s
max_latency: 4.75 s
lock_latency: 5.43 s
rows_sent: 2904
rows_examined: 8751
rows_affected: 0
full_scans: 26
1 row in set (0.01 sec)
root@localhost [sys]>
これらのビューは、実行されたステートメントに関する情報を、ホストおよびステートメント
タイプ別にグループ化して要約したものです。 デフォルトでは、行はホストごとにソートさ
れ、合計レイテンシは降順にソートされます。](https://image.slidesharecdn.com/mysqlsysschema-180310230645/85/MySQL-SYS-13-320.jpg)
![Copyright © 2017, Oracle and/or its affiliates. All rights reserved. 14
innodb_buffer_stats_by_schemaと
x$innodb_buffer_stats_by_schemaビュー
root@localhost [sys]> SELECT * FROM sys.innodb_buffer_stats_by_schema limit 1¥G
*************************** 1. row ***************************
object_schema: InnoDB System
allocated: 3.06 MiB
data: 2.53 MiB
pages: 196
pages_hashed: 45
pages_old: 13
rows_cached: 3181
1 row in set (0.13 sec)
root@localhost [sys]>
これらのビューは、スキーマごとにグループ化された
INFORMATION_SCHEMA INNODB_BUFFER_PAGE表の情報を要約します。
デフォルトでは、行はバッファサイズの降順でソートされます。](https://image.slidesharecdn.com/mysqlsysschema-180310230645/85/MySQL-SYS-14-320.jpg)
![Copyright © 2017, Oracle and/or its affiliates. All rights reserved. 15
innodb_buffer_stats_by_tableと
x$innodb_buffer_stats_by_tableのビュー
root@localhost [sys]> SELECT * FROM sys.innodb_buffer_stats_by_table limit 1¥G
*************************** 1. row ***************************
object_schema: InnoDB System
object_name: SYS_TABLES
allocated: 3.14 MiB
data: 2.79 MiB
pages: 201
pages_hashed: 6
pages_old: 0
rows_cached: 9747
1 row in set (0.15 sec)
root@localhost [sys]>
これらのビューは、INFORMATION_SCHEMA INNODB_BUFFER_PAGE表の情報を
スキーマと表でグループ化して要約したものです。
デフォルトでは、行はバッファサイズの降順でソートされます。](https://image.slidesharecdn.com/mysqlsysschema-180310230645/85/MySQL-SYS-15-320.jpg)
![Copyright © 2017, Oracle and/or its affiliates. All rights reserved. 16
innodb_lock_waitsとx $ innodb_lock_waitsビュー
root@localhost [sys]> SELECT * FROM sys.innodb_lock_waits limit 1¥G
*************************** 1. row ***************************
wait_started: 2018-03-09 13:30:03
wait_age: 00:00:03
wait_age_secs: 3
locked_table: `world`.`Demo_City`
locked_index: GEN_CLUST_INDEX
<SNIP>
waiting_query: update Demo_City set Name = 'Japan2' where ID = 1
waiting_lock_id: 1504133:5522:5:2
waiting_lock_mode: X
blocking_trx_id: 1504132
blocking_pid: 9
blocking_query: NULL
blocking_lock_id: 1504132:5522:5:2
<SNIP>
blocking_trx_rows_modified: 1
sql_kill_blocking_query: KILL QUERY 9
sql_kill_blocking_connection: KILL 9
1 row in set, 3 warnings (0.00 sec)
これらのビューは、トランザクションが待機しているInnoDBロックを要約しています。
既定では、行の降順でロックの経過時間がソートされます。](https://image.slidesharecdn.com/mysqlsysschema-180310230645/85/MySQL-SYS-16-320.jpg)
![Copyright © 2017, Oracle and/or its affiliates. All rights reserved. 17
io_by_thread_by_latencyと
x$io_by_thread_by_latencyビュー
root@localhost [sys]> SELECT * FROM sys.io_by_thread_by_latency limit 1¥G
*************************** 1. row ***************************
user: admin@192.168.56.1
total: 3723
total_latency: 4.04 s
min_latency: 23.68 ns
avg_latency: 708.06 us
max_latency: 76.28 ms
thread_id: 32
processlist_id: 8
1 row in set (0.03 sec)
root@localhost [sys]>
これらのビューは、スレッドごとにグループ化されたI/O待機時間を表示するためにI/O
コンシューマを要約します。デフォルトで、行は合計I/O待ち時間を降順にソートされます。](https://image.slidesharecdn.com/mysqlsysschema-180310230645/85/MySQL-SYS-17-320.jpg)
![Copyright © 2017, Oracle and/or its affiliates. All rights reserved. 18
io_global_by_file_by_bytesおよび
x$io_global_by_file_by_bytesビュー
root@localhost [sys]> SELECT * FROM sys.io_global_by_file_by_bytes limit 1¥G
*************************** 1. row ***************************
file: @@basedir/data/ibtmp1
count_read: 0
total_read: 0 bytes
avg_read: 0 bytes
count_write: 550
total_written: 20.41 MiB
avg_write: 37.99 KiB
total: 20.41 MiB
write_pct: 100.00
1 row in set (0.01 sec)
root@localhost [sys]>
これらのビューは、グローバルI/Oコンシューマを要約して、I/Oの量をファイルごとに
グループ化して表示します。 デフォルトでは、行は合計I/O(読み書きされたバイト数)を
降順にソートされます。](https://image.slidesharecdn.com/mysqlsysschema-180310230645/85/MySQL-SYS-18-320.jpg)
![Copyright © 2017, Oracle and/or its affiliates. All rights reserved. 19
io_global_by_file_by_latencyおよび
x$io_global_by_file_by_latencyビュー
root@localhost [sys]> SELECT * FROM sys.io_global_by_file_by_latency limit 1¥G
*************************** 1. row ***************************
file: @@basedir/data/ibdata1
total: 500
total_latency: 1.50 s
count_read: 463
read_latency: 1.39 s
count_write: 18
write_latency: 95.42 ms
count_misc: 19
misc_latency: 16.43 ms
1 row in set (0.01 sec)
root@localhost [sys]>
これらのビューは、グローバルI/Oコンシューマを要約し、ファイルごとにグループ化され
たI/O待機時間を表示します。デフォルトで、行は合計レイテンシを降順にソートされます。](https://image.slidesharecdn.com/mysqlsysschema-180310230645/85/MySQL-SYS-19-320.jpg)
![Copyright © 2017, Oracle and/or its affiliates. All rights reserved. 20
io_global_by_wait_by_bytesおよび
x$io_global_by_wait_by_bytesビュー
root@localhost [sys]> SELECT * FROM sys.io_global_by_wait_by_bytes limit 1¥G
*************************** 1. row ***************************
event_name: innodb/innodb_data_file
total: 3697
total_latency: 5.39 s
min_latency: 0 ps
avg_latency: 1.46 ms
max_latency: 93.00 ms
count_read: 1193
total_read: 20.76 MiB
avg_read: 17.82 KiB
count_write: 572
total_written: 20.88 MiB
avg_written: 37.37 KiB
total_requested: 41.63 MiB
1 row in set (0.01 sec)
これらのビューは、グローバルI/Oコンシューマを要約して、I/Oの量とI/Oを待機する時間
をイベント別にグループ化して表示します。 デフォルトでは、行は合計I/O(読み書きされ
たバイト数)を降順にソートされます。](https://image.slidesharecdn.com/mysqlsysschema-180310230645/85/MySQL-SYS-20-320.jpg)
![Copyright © 2017, Oracle and/or its affiliates. All rights reserved. 21
io_global_by_wait_by_latencyおよび
x$io_global_by_wait_by_latencyビュー
root@localhost [sys]> SELECT * FROM sys.io_global_by_wait_by_latency limit 1¥G
*************************** 1. row ***************************
event_name: innodb/innodb_data_file
total: 3697
total_latency: 5.39 s
avg_latency: 1.46 ms
max_latency: 93.00 ms
read_latency: 4.68 s
write_latency: 210.93 ms
misc_latency: 498.60 ms
count_read: 1193
total_read: 20.76 MiB
avg_read: 17.82 KiB
count_write: 572
total_written: 20.88 MiB
avg_written: 37.37 KiB
これらのビューは、グローバルI/Oコンシューマを要約して、I/Oの量とI/Oを待機する
時間をイベント別にグループ化して表示します。
デフォルトでは、行は合計レイテンシを降順にソートされます。](https://image.slidesharecdn.com/mysqlsysschema-180310230645/85/MySQL-SYS-21-320.jpg)
![Copyright © 2017, Oracle and/or its affiliates. All rights reserved. 22
latest_file_ioおよびx$latest_file_ioビュー
root@localhost [sys]> SELECT * FROM sys.latest_file_io limit 1¥G
Empty set (0.00 sec)
root@localhost [sys]>
これらのビューは、ファイルとスレッドによってグループ化されたファイルI/Oアクティビティ
を要約します。 デフォルトでは、行は最新のI/Oで最初にソートされます。](https://image.slidesharecdn.com/mysqlsysschema-180310230645/85/MySQL-SYS-22-320.jpg)
![Copyright © 2017, Oracle and/or its affiliates. All rights reserved. 23
memory_by_host_by_current_bytesおよび
x$memory_by_host_by_current_bytesビュー
root@localhost [sys]> SELECT * FROM sys.memory_by_host_by_current_bytes limit 2¥G
*************************** 1. row ***************************
host: localhost
current_count_used: 172693
current_allocated: 540.44 MiB
current_avg_alloc: 3.20 KiB
current_max_alloc: 469.06 MiB
total_allocated: 46.28 GiB
*************************** 2. row ***************************
host: background
current_count_used: 21
current_allocated: 992 bytes
current_avg_alloc: 47 bytes
current_max_alloc: 640 bytes
total_allocated: 936.38 KiB
2 rows in set (0.03 sec)
これらのビューは、ホストごとにグループ化されたメモリー使用量を要約します。
デフォルトでは、行は使用されたメモリ量の降順でソートされます。](https://image.slidesharecdn.com/mysqlsysschema-180310230645/85/MySQL-SYS-23-320.jpg)
![Copyright © 2017, Oracle and/or its affiliates. All rights reserved. 24
memory_by_thread_by_current_bytesおよび
x$memory_by_thread_by_current_bytesビュー
root@localhost [sys]> SELECT * FROM sys.memory_by_thread_by_current_bytes limit 2¥G
*************************** 1. row ***************************
thread_id: 28
user: root@localhost
current_count_used: 31
current_allocated: 484.84 KiB
current_avg_alloc: 15.64 KiB
current_max_alloc: 248.42 KiB
total_allocated: 7.79 MiB
*************************** 2. row ***************************
thread_id: 24
user: innodb/dict_stats_thread
current_count_used: 21
current_allocated: 992 bytes
current_avg_alloc: 47 bytes
current_max_alloc: 640 bytes
total_allocated: 921.71 KiB
これらのビューはスレッドごとにグループ化されたメモリー使用量を要約します。
デフォルトでは、行は使用されたメモリ量の降順でソートされます。](https://image.slidesharecdn.com/mysqlsysschema-180310230645/85/MySQL-SYS-24-320.jpg)
![Copyright © 2017, Oracle and/or its affiliates. All rights reserved. 25
memory_by_user_by_current_bytesおよび
x$memory_by_user_by_current_bytesビュー
root@localhost [sys]> SELECT * FROM sys.memory_by_user_by_current_bytes limit 2¥G
*************************** 1. row ***************************
user: root
current_count_used: 172694
current_allocated: 540.44 MiB
current_avg_alloc: 3.20 KiB
current_max_alloc: 469.06 MiB
total_allocated: 46.29 GiB
*************************** 2. row ***************************
user: background
current_count_used: 21
current_allocated: 992 bytes
current_avg_alloc: 47 bytes
current_max_alloc: 640 bytes
total_allocated: 947.22 KiB
2 rows in set (0.02 sec)
これらのビューは、ユーザーごとにグループ化されたメモリー使用量を要約します。
デフォルトでは、行は使用されたメモリ量の降順でソートされます。](https://image.slidesharecdn.com/mysqlsysschema-180310230645/85/MySQL-SYS-25-320.jpg)
![Copyright © 2017, Oracle and/or its affiliates. All rights reserved. 26
memory_global_by_current_bytesおよび
x$memory_global_by_current_bytesビュー
root@localhost [sys]> SELECT * FROM sys.memory_global_by_current_bytes limit 2¥G
*************************** 1. row ***************************
event_name: memory/innodb/lock0lock
current_count: 9166
current_alloc: 14.20 MiB
current_avg_alloc: 1.59 KiB
high_count: 9166
high_alloc: 14.20 MiB
high_avg_alloc: 1.59 KiB
*************************** 2. row ***************************
event_name: memory/performance_schema/table_handles
current_count: 1
current_alloc: 9.06 MiB
current_avg_alloc: 9.06 MiB
high_count: 1
high_alloc: 9.06 MiB
high_avg_alloc: 9.06 MiB
これらのビューは、割り当てタイプ(イベント別)ごとにグループ化されたメモリー使用量を
要約します。 デフォルトでは、行は使用されたメモリ量の降順でソートされます。](https://image.slidesharecdn.com/mysqlsysschema-180310230645/85/MySQL-SYS-26-320.jpg)
![Copyright © 2017, Oracle and/or its affiliates. All rights reserved. 27
memory_global_totalおよびx$memory_global_totalビュー
root@localhost [sys]> SELECT * FROM sys.memory_global_total limit 2¥G
*************************** 1. row ***************************
total_allocated: 111.71 MiB
1 row in set (0.01 sec)
root@localhost [sys]>
これらのビューは、サーバー内の合計メモリー使用量を要約します。](https://image.slidesharecdn.com/mysqlsysschema-180310230645/85/MySQL-SYS-27-320.jpg)
![Copyright © 2017, Oracle and/or its affiliates. All rights reserved. 28
メトリックビュー
root@localhost [sys]> SELECT * FROM sys.metrics limit 2¥G
*************************** 1. row ***************************
Variable_name: aborted_clients
Variable_value: 2
Type: Global Status
Enabled: YES
*************************** 2. row ***************************
Variable_name: aborted_connects
Variable_value: 2
Type: Global Status
Enabled: YES
2 rows in set (0.07 sec)
root@localhost [sys]>
このビューは、MySQLサーバのメトリックをまとめ、変数名、値、タイプ、およびそれらが
有効かどうかを表示します。デフォルトでは、行は変数の型と名前でソートされます。](https://image.slidesharecdn.com/mysqlsysschema-180310230645/85/MySQL-SYS-28-320.jpg)
![Copyright © 2017, Oracle and/or its affiliates. All rights reserved. 29
processlistとx$processlistビュー
root@localhost [sys]> SELECT * FROM sys.processlist limit 1¥G
*************************** 1. row ***************************
thd_id: 1
conn_id: NULL
user: sql/main
<SNIP>
current_memory: 0 bytes
last_wait: wait/synch/mutex/sql/LOCK_thread_cache
last_wait_latency: 71.41 ns
source: connection_handler_per_thread.cc:370
trx_latency: NULL
trx_state: NULL
trx_autocommit: NULL
pid: NULL
program_name: NULL
これらのビューはプロセスリスト情報を要約します。 SHOW PROCESSLISTステートメントや
INFORMATION_SCHEMA PROCESSLISTテーブルより完全な情報を提供し、非ブロック化も
しています。デフォルトで、行はプロセス時間の降順と降順の待機時間でソートされます。](https://image.slidesharecdn.com/mysqlsysschema-180310230645/85/MySQL-SYS-29-320.jpg)
![Copyright © 2017, Oracle and/or its affiliates. All rights reserved. 30
ps_check_lost_instrumentationビュー
root@localhost [sys]> SELECT * FROM sys. ps_check_lost_instrumentation limit 1¥G
*************************** 1. row ***************************
variable_name: Performance_schema_rwlock_classes_lost
variable_value: 3
1 row in set (0.00 sec)
root@localhost [sys]> SELECT * FROM sys. ps_check_lost_instrumentation limit 2¥G
*************************** 1. row ***************************
variable_name: Performance_schema_rwlock_classes_lost
variable_value: 3
1 row in set (0.01 sec)
root@localhost [sys]>
このビューは、パフォーマンススキーマがすべてのランタイムデータを監視できないか
どうかを示すために、失われたパフォーマンススキーマインストゥルメントに関する情報
を返します。](https://image.slidesharecdn.com/mysqlsysschema-180310230645/85/MySQL-SYS-30-320.jpg)
![Copyright © 2017, Oracle and/or its affiliates. All rights reserved. 31
schema_auto_increment_columnsビュー
root@localhost [sys]> SELECT * FROM sys.schema_auto_increment_columns limit 1¥G
*************************** 1. row ***************************
table_schema: AdventureWorks2012
table_name: AWBuildVersion
column_name: SystemInformationID
data_type: tinyint
column_type: tinyint(3) unsigned
is_signed: 0
is_unsigned: 1
max_value: 255
auto_increment: 2
auto_increment_ratio: 0.0078
1 row in set (0.30 sec)
root@localhost [sys]>
このビューは、AUTO_INCREMENT列を持つ表を示し、現在および最大列の値や使用率
(使用率と使用可能な値の比)などの列に関する情報を提供します。 デフォルトでは、行
は降順の使用率と最大の列値によってソートされます。](https://image.slidesharecdn.com/mysqlsysschema-180310230645/85/MySQL-SYS-31-320.jpg)
![Copyright © 2017, Oracle and/or its affiliates. All rights reserved. 32
schema_index_statisticsおよび
x$schema_index_statisticsビュー
root@localhost [sys]> SELECT * FROM sys.schema_index_statistics limit 1¥G
*************************** 1. row ***************************
table_schema: world
table_name: Demo_Country
index_name: PRIMARY
rows_selected: 2330000
select_latency: 43.60 s
rows_inserted: 0
insert_latency: 0 ps
rows_updated: 0
update_latency: 0 ps
rows_deleted: 0
delete_latency: 0 ps
1 row in set (0.04 sec)
root@localhost [sys]>
これらのビューは、索引統計を提供します。
デフォルトでは、索引レイテンシの合計が降順にソートされます。](https://image.slidesharecdn.com/mysqlsysschema-180310230645/85/MySQL-SYS-32-320.jpg)
![Copyright © 2017, Oracle and/or its affiliates. All rights reserved. 33
schema_object_overviewビュー
root@localhost [sys]> SELECT * FROM sys.schema_object_overview limit 2¥G
*************************** 1. row ***************************
db: AdventureWorks2012
object_type: BASE TABLE
count: 68
*************************** 2. row ***************************
db: AdventureWorks2012
object_type: INDEX (BTREE)
count: 272
2 rows in set (0.26 sec)
root@localhost [sys]>
このビューは、各スキーマ内のオブジェクトのタイプをまとめたものです。
デフォルトでは、行はスキーマとオブジェクトタイプによってソートされます。](https://image.slidesharecdn.com/mysqlsysschema-180310230645/85/MySQL-SYS-33-320.jpg)
![Copyright © 2017, Oracle and/or its affiliates. All rights reserved. 34
schema_redundant_indexesおよび
x$schema_flattened_keysビュー
root@localhost [sys]> SELECT * FROM sys.schema_redundant_indexes limit 1¥G
*************************** 1. row ***************************
table_schema: AdventureWorks2012
table_name: Address
redundant_index_name: rowguid
redundant_index_columns: rowguid
redundant_index_non_unique: 0
dominant_index_name: AK_Address_rowguid
dominant_index_columns: rowguid
dominant_index_non_unique: 0
subpart_exists: 0
sql_drop_index: ALTER TABLE `AdventureWorks2012`.`Address` DROP INDEX `rowguid`
1 row in set (0.36 sec)
root@localhost [sys]>
schema_redundant_indexesビューには、他の索引を複製するか、
冗長化された索引が表示されます。x$schema_flattened_keysビューは、
schema_redundant_indexesのヘルパービューです。](https://image.slidesharecdn.com/mysqlsysschema-180310230645/85/MySQL-SYS-34-320.jpg)
![Copyright © 2017, Oracle and/or its affiliates. All rights reserved. 35
schema_table_lock_waitsと
x$schema_table_lock_waitsビュー
root@localhost [sys]> SELECT * FROM sys.schema_table_lock_waits limit 1¥G
*************************** 1. row ***************************
object_schema: world
object_name: Demo_City
waiting_thread_id: 40046
waiting_pid: 40022
waiting_account: root@localhost
waiting_lock_type: SHARED_WRITE
waiting_lock_duration: TRANSACTION
waiting_query: update Demo_City set Name = 'Japan2' where ID = 1
waiting_query_secs: 3
<SNIP>
blocking_pid: 40023
blocking_account: root@localhost
blocking_lock_type: SHARED_READ_ONLY
blocking_lock_duration: TRANSACTION
sql_kill_blocking_query: KILL QUERY 40023
sql_kill_blocking_connection: KILL 40023
これらのビューは、どのセッションがメタデータのロックを待ってブロックされているのか、
何がブロックされているのかを表示します。](https://image.slidesharecdn.com/mysqlsysschema-180310230645/85/MySQL-SYS-35-320.jpg)
![Copyright © 2017, Oracle and/or its affiliates. All rights reserved. 36
schema_table_statisticsおよび
x$schema_table_statisticsビュー
root@localhost [sys]> SELECT * FROM sys.schema_table_statistics limit 1¥G
*************************** 1. row ***************************
table_schema: world
table_name: Demo_City
total_latency: 4.55 m
rows_fetched: 40832639
fetch_latency: 4.55 m
<SNIP>
io_read: 448.79 KiB
io_read_latency: 168.89 ms
io_write_requests: 10
io_write: 160.00 KiB
io_write_latency: 2.95 ms
io_misc_requests: 21
io_misc_latency: 16.46 ms
これらのビューは、テーブル統計を要約します。 デフォルトでは、行は合計待機時間(最
大の競合が最初に発生した表)を降順にソートされます。
これらのビューは、x$ps_schema_table_statistics_ioのヘルパービューを表示します。](https://image.slidesharecdn.com/mysqlsysschema-180310230645/85/MySQL-SYS-36-320.jpg)
![Copyright © 2017, Oracle and/or its affiliates. All rights reserved. 37
schema_table_statistics_with_bufferおよび
x$schema_table_statistics_with_bufferビュー
root@localhost [sys]> SELECT * FROM sys.schema_table_statistics_with_buffer limit 1¥G
*************************** 1. row ***************************
table_schema: world
table_name: Demo_City
rows_fetched: 40832639
fetch_latency: 4.55 m
rows_inserted: 0
insert_latency: 0 ps
<SNIP>
io_misc_latency: 16.46 ms
innodb_buffer_allocated: 416.00 KiB
innodb_buffer_data: 362.88 KiB
innodb_buffer_free: 53.12 KiB
innodb_buffer_pages: 26
innodb_buffer_pages_hashed: 0
innodb_buffer_pages_old: 0
innodb_buffer_rows_cached: 4104
これらのビューは、InnoDBバッファプール統計を含むテーブル統計を要約しています。
デフォルトでは、行は合計待機時間(最大の競合が最初に発生した表)を降順にソート。](https://image.slidesharecdn.com/mysqlsysschema-180310230645/85/MySQL-SYS-37-320.jpg)
![Copyright © 2017, Oracle and/or its affiliates. All rights reserved. 38
schema_tables_with_full_table_scansおよび
x$schema_tables_with_full_table_scansビュー
root@localhost [sys]> SELECT * FROM sys.schema_tables_with_full_table_scans limit 2¥G
*************************** 1. row ***************************
object_schema: world
object_name: Demo_City
rows_full_scanned: 40832639
latency: 4.55 m
*************************** 2. row ***************************
object_schema: world
object_name: Demo_CountryLanguage
rows_full_scanned: 9850000
latency: 1.50 m
2 rows in set (0.04 sec)
これらのビューは、フル・テーブル・スキャンでどの表にアクセスしているかを表示します。
デフォルトでは、行は降順にスキャンされた行によってソートされます。](https://image.slidesharecdn.com/mysqlsysschema-180310230645/85/MySQL-SYS-38-320.jpg)
![Copyright © 2017, Oracle and/or its affiliates. All rights reserved. 39
schema_unused_indexesビュー
root@localhost [sys]> SELECT * FROM sys.schema_unused_indexes limit 3¥G
*************************** 1. row ***************************
object_schema: AdventureWorks2012
object_name: Address
index_name: IX_Address_AddressLine1_AddressLine2_City_StateProvinceID_Post13
*************************** 2. row ***************************
object_schema: AdventureWorks2012
object_name: Address
index_name: AK_Address_rowguid
*************************** 3. row ***************************
object_schema: AdventureWorks2012
object_name: Address
index_name: rowguid
3 rows in set (0.04 sec)
root@localhost [sys]>
これらのビューには、使用されていないことを示すイベントが存在しないインデックスが
表示されます。 デフォルトでは、行はスキーマとテーブルによってソートされます。](https://image.slidesharecdn.com/mysqlsysschema-180310230645/85/MySQL-SYS-39-320.jpg)
![Copyright © 2017, Oracle and/or its affiliates. All rights reserved. 40
The sessionとx$sessionビュー
root@localhost [sys]> SELECT * FROM sys.session limit 1¥G
*************************** 1. row ***************************
thd_id: 10039
conn_id: 10015
user: admin@192.168.56.1
db: NULL
command: Sleep
<SNIP>
source: socket_connection.cc:69
trx_latency: NULL
trx_state: NULL
trx_autocommit: NULL
pid: 9860
program_name: MySQLWorkbench
1 row in set (0.28 sec)
root@localhost [sys]>
これらのビューはprocesslistとx $ processlistに似ていますが、バックグラウンド・プロセス
を除外してユーザー・セッションのみを表示します。](https://image.slidesharecdn.com/mysqlsysschema-180310230645/85/MySQL-SYS-40-320.jpg)
![Copyright © 2017, Oracle and/or its affiliates. All rights reserved. 41
session_ssl_statusビュー
root@localhost [sys]> SELECT * FROM sys.session_ssl_status limit 2¥G
*************************** 1. row ***************************
thread_id: 28
ssl_version:
ssl_cipher:
ssl_sessions_reused: 0
*************************** 2. row ***************************
thread_id: 31
ssl_version: TLSv1.1
ssl_cipher: DHE-RSA-AES256-SHA
ssl_sessions_reused: 0
2 rows in set (0.01 sec)
root@localhost [sys]>
接続ごとに、このビューにはSSLバージョン、暗号、および再使用されたSSL
セッションの数が表示されます。](https://image.slidesharecdn.com/mysqlsysschema-180310230645/85/MySQL-SYS-41-320.jpg)
![Copyright © 2017, Oracle and/or its affiliates. All rights reserved. 42
statement_analysisとx$statement_analysisビュー
root@localhost [sys]> SELECT * FROM sys.statement_analysis limit 1¥G
*************************** 1. row ***************************
query: SELECT LANGUAGE , COUNT ( LANG ... ROUP BY LANGUAGE LIMIT ?, ...
db: world
full_scan: *
exec_count: 10000
err_count: 0
warn_count: 0
total_latency: 13.91 m
max_latency: 723.74 ms
<SNIP>
rows_sorted: 100000
sort_merge_passes: 0
digest: 41d00de8eda848e48552d7282da0e4b6
first_seen: 2018-03-09 13:58:39
last_seen: 2018-03-09 14:01:27
これらのビューは、統計を集計した正規化されたステートメントをリストします。
このコンテンツは、MySQL Enterprise Monitor Query Analysisビューに似ています。
デフォルトでは、行は合計レイテンシを降順にソートされます。](https://image.slidesharecdn.com/mysqlsysschema-180310230645/85/MySQL-SYS-42-320.jpg)
![Copyright © 2017, Oracle and/or its affiliates. All rights reserved. 43
statements_with_errors_or_warningsおよび
x$statements_with_errors_or_warningsビュー
root@localhost [sys]> SELECT * FROM sys.statements_with_errors_or_warnings limit 1¥G
*************************** 1. row ***************************
query: SELECT `r` . `trx_wait_started ... k_id` , `bl` . `lock_mode` AS
db: sys
exec_count: 2
errors: 0
error_pct: 0.0000
warnings: 6
warning_pct: 300.0000
first_seen: 2018-03-09 13:27:43
last_seen: 2018-03-09 13:30:07
digest: c45b5b6253e8459b144890f2fc813688
1 row in set (0.01 sec)
root@localhost [sys]>
これらのビューは、エラーまたは警告を生成した正規化されたステートメントを表示しま
す。 デフォルトでは、行は降順のエラーと警告数によってソートされます。](https://image.slidesharecdn.com/mysqlsysschema-180310230645/85/MySQL-SYS-43-320.jpg)
![Copyright © 2017, Oracle and/or its affiliates. All rights reserved. 44
statements_with_full_table_scansおよび
x$statements_with_full_table_scansビュー
root@localhost [sys]> SELECT * FROM sys.statements_with_full_table_scans limit 1¥G
*************************** 1. row ***************************
query: SELECT COUNT (?) AS `cnt` , `r ... _by_digest` GROUP BY `avg_us`
db: myosm
exec_count: 4
total_latency: 9.47 ms
no_index_used_count: 4
no_good_index_used_count: 0
no_index_used_pct: 100
rows_sent: 36
rows_examined: 36
rows_sent_avg: 9
rows_examined_avg: 9
first_seen: 2018-03-09 12:54:54
last_seen: 2018-03-09 12:54:54
digest: c8e66a8fed8ba76991dbc223e5781b6f
これらのビューには、フル・テーブル・スキャンを行った正規化された文が表示されます。
デフォルトでは、フルスキャンが完了した時間の割合が降順になり、合計レイテンシが
降順にソートされます。](https://image.slidesharecdn.com/mysqlsysschema-180310230645/85/MySQL-SYS-44-320.jpg)
![Copyright © 2017, Oracle and/or its affiliates. All rights reserved. 45
statements_with_runtimes_in_95th_percentileおよび
x$statements_with_runtimes_in_95th_percentileビュー
root@localhost [sys]> SELECT * FROM sys.statements_with_runtimes_in_95th_percentile limit 1¥G
*************************** 1. row ***************************
query: UPDATE `Demo_City` SET NAME = ? WHERE `ID` = ?
db: world
full_scan:
exec_count: 6
err_count: 0
warn_count: 0
total_latency: 1.43 m
max_latency: 51.27 s
avg_latency: 14.31 s
rows_sent: 0
rows_sent_avg: 0
rows_examined: 24474
rows_examined_avg: 4079
first_seen: 2018-03-09 13:30:02
last_seen: 2018-03-09 14:46:47
digest: 2f1b0052c8ecff3f76fb0b2682de295a
これらのビューは、ランタイムが95パーセンタイルであるステートメントをリストします。
デフォルトでは、行は平均待ち時間の降順でソートされます。](https://image.slidesharecdn.com/mysqlsysschema-180310230645/85/MySQL-SYS-45-320.jpg)
![Copyright © 2017, Oracle and/or its affiliates. All rights reserved. 46
statements_with_sortingおよび
x$statements_with_sortingビュー
root@localhost [sys]> SELECT * FROM sys.statements_with_sorting limit 1¥G
*************************** 1. row ***************************
query: SELECT LANGUAGE , COUNT ( LANG ... ROUP BY LANGUAGE LIMIT ?, ...
db: world
exec_count: 10000
total_latency: 13.91 m
sort_merge_passes: 0
avg_sort_merges: 0
sorts_using_scans: 10000
sort_using_range: 0
rows_sorted: 100000
avg_rows_sorted: 10
first_seen: 2018-03-09 13:58:39
last_seen: 2018-03-09 14:01:27
digest: 41d00de8eda848e48552d7282da0e4b6
1 row in set (0.01 sec)
これらのビューは、ソートを実行した正規化されたステートメントをリストします。
デフォルトでは、行は合計レイテンシを降順にソートされます。](https://image.slidesharecdn.com/mysqlsysschema-180310230645/85/MySQL-SYS-46-320.jpg)
![Copyright © 2017, Oracle and/or its affiliates. All rights reserved. 47
statements_with_temp_tablesおよび
x$statements_with_temp_tablesビュー
root@localhost [sys]> SELECT * FROM sys.statements_with_temp_tables limit 1¥G
*************************** 1. row ***************************
query: SELECT `information_schema` . ... SELECT `information_schema` .
db: sys
exec_count: 4
total_latency: 1.03 s
memory_tmp_tables: 804
disk_tmp_tables: 144
avg_tmp_tables_per_query: 201
tmp_tables_to_disk_pct: 18
first_seen: 2018-03-09 12:30:37
last_seen: 2018-03-09 14:34:47
digest: 778282a821be7a22a384b0043b1bccdc
1 row in set (0.00 sec)
これらのビューには、一時表を使用した正規化された文がリストされます。 デフォルトで
は、使用されるディスク上の一時テーブルの数の降順、および使用されるメモリ内の一
時テーブルの降順で行がソートされます。](https://image.slidesharecdn.com/mysqlsysschema-180310230645/85/MySQL-SYS-47-320.jpg)
![Copyright © 2017, Oracle and/or its affiliates. All rights reserved. 48
user_summaryとx$user_summaryのビュー
root@localhost [sys]> SELECT * FROM sys.user_summary limit 1¥G
*************************** 1. row ***************************
user: root
statements: 132948
statement_latency: 20.11 m
statement_avg_latency: 9.07 ms
table_scans: 10118
file_ios: 134514
file_io_latency: 2.26 m
current_connections: 3
total_connections: 40012
unique_hosts: 1
current_memory: 556.81 MiB
total_memory_allocated: 47.05 GiB
1 row in set (0.07 sec)
これらのビューは、ユーザーによってグループ化された文のアクティビティ、ファイルI/O、
および接続を要約します。 デフォルトでは、行は合計レイテンシを降順にソートされます。](https://image.slidesharecdn.com/mysqlsysschema-180310230645/85/MySQL-SYS-48-320.jpg)
![Copyright © 2017, Oracle and/or its affiliates. All rights reserved. 49
user_summary_by_file_ioと
x$user_summary_by_file_ioのビュー
root@localhost [sys]> SELECT * FROM sys.user_summary_by_file_io limit 3¥G
*************************** 1. row ***************************
user: root
ios: 134522
io_latency: 2.26 m
*************************** 2. row ***************************
user: background
ios: 6649
io_latency: 4.70 s
*************************** 3. row ***************************
user: admin
ios: 5735
io_latency: 4.18 s
3 rows in set (0.02 sec)
root@localhost [sys]>
これらのビューは、ファイルI / Oをユーザー別にまとめたものです。 デフォルトでは、
ファイルI / O全体のレイテンシが降順に並べ替えられて行がソートされます。](https://image.slidesharecdn.com/mysqlsysschema-180310230645/85/MySQL-SYS-49-320.jpg)
![Copyright © 2017, Oracle and/or its affiliates. All rights reserved. 50
user_summary_by_file_io_typeと
x$user_summary_by_file_io_typeのビュー
root@localhost [sys]> SELECT * FROM sys.user_summary_by_file_io_type limit 2¥G
*************************** 1. row ***************************
user: admin
event_name: wait/io/file/innodb/innodb_data_file
total: 1155
latency: 2.79 s
max_latency: 76.28 ms
*************************** 2. row ***************************
user: admin
event_name: wait/io/file/sql/FRM
total: 3025
latency: 1.24 s
max_latency: 72.79 ms
2 rows in set (0.02 sec)
これらのビューは、ファイルI / Oをユーザーとイベントのタイプ別にまとめたものです。
デフォルトでは、行はユーザー別と合計レイテンシの降順でソートされます。](https://image.slidesharecdn.com/mysqlsysschema-180310230645/85/MySQL-SYS-50-320.jpg)
![Copyright © 2017, Oracle and/or its affiliates. All rights reserved. 51
user_summary_by_stagesと
x$user_summary_by_stagesビュー
root@localhost [sys]> SELECT * FROM sys.user_summary_by_stages limit 2¥G
*************************** 1. row ***************************
user: admin
event_name: stage/sql/updating
total: 4
total_latency: 13.13 w
avg_latency: 18.53 w
*************************** 2. row ***************************
user: admin
event_name: stage/sql/Sending data
total: 3898
total_latency: 5.53 s
avg_latency: 1.42 ms
2 rows in set (0.01 sec)
これらのビューは、ユーザー別にグループ化されたステージを要約します。
デフォルトでは、行はユーザーごとに並べ替えられ、ステージの合計レイテンシは
降順で並べ替えられます。](https://image.slidesharecdn.com/mysqlsysschema-180310230645/85/MySQL-SYS-51-320.jpg)
![Copyright © 2017, Oracle and/or its affiliates. All rights reserved. 52
user_summary_by_statement_latencyと
x$user_summary_by_statement_latencyビュー
root@localhost [sys]> SELECT * FROM sys.user_summary_by_statement_latency limit 1¥G
*************************** 1. row ***************************
user: root
total: 133238
total_latency: 20.11 m
max_latency: 53.49 s
lock_latency: 15.58 m
rows_sent: 104639
rows_examined: 75184318
rows_affected: 30006
full_scans: 10125
1 row in set (0.02 sec)
これらのビューは、ユーザーごとにグループ化された全体的なステートメント統計を
要約します。 デフォルトでは、行は合計レイテンシを降順にソートされます。](https://image.slidesharecdn.com/mysqlsysschema-180310230645/85/MySQL-SYS-52-320.jpg)
![Copyright © 2017, Oracle and/or its affiliates. All rights reserved. 53
user_summary_by_statement_typeおよび
x$user_summary_by_statement_typeビュー
root@localhost [sys]> SELECT * FROM sys.user_summary_by_statement_type limit 1¥G
*************************** 1. row ***************************
user: admin
statement: show_status
total: 2029
total_latency: 10.01 s
max_latency: 90.32 ms
lock_latency: 813.05 ms
rows_sent: 749254
rows_examined: 1501484
rows_affected: 0
full_scans: 2029
1 row in set (0.01 sec)
これらのビューは、実行されたステートメントに関する情報を、ユーザーおよび
ステートメントタイプごとにまとめたものです。デフォルトでは、行はユーザー別と
合計レイテンシの降順でソートされます。](https://image.slidesharecdn.com/mysqlsysschema-180310230645/85/MySQL-SYS-53-320.jpg)
![Copyright © 2017, Oracle and/or its affiliates. All rights reserved. 54
versionビュー
root@localhost [sys]> SELECT * FROM sys.version limit 1¥G
*************************** 1. row ***************************
sys_version: 1.5.1
mysql_version: 5.7.21-enterprise-commercial-advanced-log
1 row in set (0.00 sec)
root@localhost [sys]>
このビューには、現在のsysスキーマとMySQLサーバのバージョンが表示されます。](https://image.slidesharecdn.com/mysqlsysschema-180310230645/85/MySQL-SYS-54-320.jpg)
![Copyright © 2017, Oracle and/or its affiliates. All rights reserved. 55
wait_classes_global_by_avg_latencyおよび
x$wait_classes_global_by_avg_latencyビュー
root@localhost [sys]> SELECT * FROM sys.wait_classes_global_by_avg_latency limit 2¥G
*************************** 1. row ***************************
event_class: wait/lock/metadata
total: 1
total_latency: 49.19 s
min_latency: 49.19 s
avg_latency: 49.19 s
max_latency: 49.19 s
*************************** 2. row ***************************
event_class: wait/synch/cond
total: 13665
total_latency: 1.77 m
min_latency: 0 ps
avg_latency: 7.78 ms
max_latency: 49.19 s
2 rows in set (0.08 sec)
これらのビューは、待機クラス平均待ち時間をイベントクラス別にまとめたものです。 デ
フォルトでは、行は平均待ち時間の降順でソートされます。 idleイベントは無視されます。](https://image.slidesharecdn.com/mysqlsysschema-180310230645/85/MySQL-SYS-55-320.jpg)
![Copyright © 2017, Oracle and/or its affiliates. All rights reserved. 56
wait_classes_global_by_latencyおよび
x$wait_classes_global_by_latencyビュー
root@localhost [sys]> SELECT * FROM sys.wait_classes_global_by_latency limit 2¥G
*************************** 1. row ***************************
event_class: wait/io/table
total: 53042646
total_latency: 6.88 m
min_latency: 370 ps
avg_latency: 7.78 us
max_latency: 21.26 s
*************************** 2. row ***************************
event_class: wait/io/socket
total: 393356
total_latency: 4.55 m
min_latency: 0 ps
avg_latency: 694.34 us
max_latency: 145.51 ms
2 rows in set (0.09 sec)
これらのビューは、待機クラスの合計待ち時間をイベントクラス別にまとめたものです。
デフォルトで、行は合計レイテンシを降順にソートされます。idleイベントは無視されます。](https://image.slidesharecdn.com/mysqlsysschema-180310230645/85/MySQL-SYS-56-320.jpg)
![Copyright © 2017, Oracle and/or its affiliates. All rights reserved. 57
waits_by_host_by_latencyと
x$waits_by_host_by_latencyのビュー
root@localhost [sys]> SELECT * FROM sys.waits_by_host_by_latency limit 2¥G
*************************** 1. row ***************************
host: 192.168.56.1
event: wait/io/file/innodb/innodb_data_file
total: 1155
total_latency: 2.79 s
avg_latency: 2.42 ms
max_latency: 76.28 ms
*************************** 2. row ***************************
host: 192.168.56.1
event: wait/io/file/sql/FRM
total: 3025
total_latency: 1.24 s
avg_latency: 409.64 us
max_latency: 72.79 ms
これらのビューは、ホストおよびイベントによってグループ化された待機イベントを要約し
ます。 デフォルトでは、行はホストごとにソートされ、合計レイテンシは降順にソートされ
ます。 idleイベントは無視されます。](https://image.slidesharecdn.com/mysqlsysschema-180310230645/85/MySQL-SYS-57-320.jpg)
![Copyright © 2017, Oracle and/or its affiliates. All rights reserved. 58
waits_by_user_by_latencyと
x$waits_by_user_by_latencyのビュー
root@localhost [sys]> SELECT * FROM sys.waits_by_user_by_latency limit 2¥G
*************************** 1. row ***************************
user: admin
event: wait/io/file/innodb/innodb_data_file
total: 1155
total_latency: 2.79 s
avg_latency: 2.42 ms
max_latency: 76.28 ms
*************************** 2. row ***************************
user: admin
event: wait/io/file/sql/FRM
total: 3025
total_latency: 1.24 s
avg_latency: 409.64 us
max_latency: 72.79 ms
2 rows in set (0.02 sec)
これらのビューは、ユーザーおよびイベントごとにグループ化された待機イベントを要約
します。 デフォルトでは、行はユーザー別と合計レイテンシの降順でソートされます。
idleイベントは無視されます。](https://image.slidesharecdn.com/mysqlsysschema-180310230645/85/MySQL-SYS-58-320.jpg)
![Copyright © 2017, Oracle and/or its affiliates. All rights reserved. 59
waits_global_by_latencyと
x$waits_global_by_latencyビュー
root@localhost [sys]> SELECT * FROM sys.waits_global_by_latency limit 2¥G
*************************** 1. row ***************************
events: wait/io/table/sql/handler
total: 53042646
total_latency: 6.88 m
avg_latency: 7.78 us
max_latency: 21.26 s
*************************** 2. row ***************************
events: wait/io/socket/sql/client_connection
total: 363355
total_latency: 4.55 m
avg_latency: 750.97 us
max_latency: 145.51 ms
2 rows in set (0.06 sec)
root@localhost [sys]>
これらのビューは、イベントごとにグループ化された待機イベントを要約します。
デフォルトで、行は合計レイテンシを降順にソートされます。idleイベントは無視されます。](https://image.slidesharecdn.com/mysqlsysschema-180310230645/85/MySQL-SYS-59-320.jpg)

![Copyright © 2017, Oracle and/or its affiliates. All rights reserved. 61
create_synonym_db()プロシージャ
root@localhost [sys]> SHOW DATABASES like 'info%';
+--------------------+
| Database (info%) |
+--------------------+
| information_schema |
+--------------------+
root@localhost [sys]> CALL create_synonym_db('INFORMATION_SCHEMA', 'info');
+-----------------------------------------+
| summary |
+-----------------------------------------+
| Created 63 views in the `info` database |
+-----------------------------------------+
root@localhost [sys]> SHOW DATABASES like 'info%';
+--------------------+
| Database (info%) |
+--------------------+
| information_schema |
| info |
+--------------------+
スキーマ名を指定すると、元のスキーマ内のすべての表およびビューを参照するビュー
を含む同義語スキーマが作成されます。 これは、たとえば、長い名前のスキーマ
(INFORMATION_SCHEMAではなくinfoなど)を参照する短い名前を作成できます。](https://image.slidesharecdn.com/mysqlsysschema-180310230645/85/MySQL-SYS-61-320.jpg)
![Copyright © 2017, Oracle and/or its affiliates. All rights reserved. 62
diagnostics()プロシージャ
[admin@GA01 ~]$ mysql -u root -ppassword -e "CALL sys.diagnostics(10,5,'current')“
<SNIP>
Delta host_summary_by_stages
host event_name total total_latency avg_latency
192.168.56.1 stage/sql/Sending data 4 5.85 ms 1.46 ms
192.168.56.1 stage/sql/freeing items 2 1.96 ms 981.06 us
192.168.56.1 stage/sql/starting 4 745.09 us 186.27 us
192.168.56.1 stage/sql/init 2 261.54 us 130.77 us
192.168.56.1 stage/sql/Opening tables 2 58.09 us 29.04 us
192.168.56.1 stage/sql/query end 2 53.44 us 26.72 us
<SNIP>
診断の目的で、現在のサーバー状態のレポートを作成します。
call sys.diagnostics(最大実行時間,間隔秒 ,'current')
デフォルトはそれぞれ60, 30, currentとなっており,30秒ごとに最大で60秒,つまり2回の出力を行う。
#current: 現在有効な計器とコンシューマーからのみデータの採取を行う
#medium: いくつかの計器とコンシューマーを有効にして、データの採取を行う
#full: すべての計器とコンシューマーを有効にして、データの採取を行う](https://image.slidesharecdn.com/mysqlsysschema-180310230645/85/MySQL-SYS-62-320.jpg)
![Copyright © 2017, Oracle and/or its affiliates. All rights reserved. 63
ps_trace_statement_digest()プロシージャ
root@localhost [sys]> CALL ps_trace_statement_digest('41d00de8eda848e48552d7282da0e4b6', 10, 0.1, TRUE, TRUE);
+-------------------+
| summary |
+-------------------+
| Disabled 1 thread |
+-------------------+
1 row in set (0.01 sec)
<SNIP>
+------------+-----------+-----------+-----------+---------------+---------------+------------+------------+
| executions | exec_time | lock_time | rows_sent | rows_affected | rows_examined | tmp_tables | full_scans |
+------------+-----------+-----------+-----------+---------------+---------------+------------+------------+
| 294 | 44.41 s | 44.37 s | 2940 | 0 | 2204118 | 588 | 294 |
+------------+-----------+-----------+-----------+---------------+---------------+------------+------------+
1 row in set (9.67 sec)
特定ステートメントダイジェストの全てのパフォーマンススキーマインストゥルメンテーショ
ンをトレースします。パフォーマンス・スキーマのevents_statements_summary_by_digest
表内で関心のある文を見つけた場合は、このプロシージャーのDIGEST列MD5値を指定
し、ポーリングの期間と間隔を指定します。 結果は、その期間のダイジェストのパフォー
マンススキーマ内で追跡されたすべての統計情報のレポートです。](https://image.slidesharecdn.com/mysqlsysschema-180310230645/85/MySQL-SYS-63-320.jpg)
![Copyright © 2017, Oracle and/or its affiliates. All rights reserved. 64
ps_trace_thread()プロシージャ
root@localhost [sys]> CALL ps_trace_thread(25, CONCAT('/usr/local/mysql/mysql-files/stack-', REPLACE(NOW(), ' ', '-'), '.dot'), NULL, NULL, TRUE, TRUE, TRUE);
+--------------------+
| summary |
+--------------------+
| Disabled 0 threads |
+--------------------+
1 row in set (0.01 sec)
+---------------------------------------------+
| Info |
+---------------------------------------------+
| Data collection starting for THREAD_ID = 25 |
+---------------------------------------------+
1 row in set (0.03 sec)
+-----------------------------------------------------------------------------------+
| Info |
+-----------------------------------------------------------------------------------+
| Stack trace written to /usr/local/mysql/mysql-files/stack-2018-03-09-16:32:17.dot |
+-----------------------------------------------------------------------------------+
計測されたスレッドのすべてのパフォーマンススキーマデータをDOT形式のグラフファイ
ル(DOTグラフ記述言語用)にダンプします。 プロシージャから返される各結果セットは、
完全なグラフに使用する必要があります。](https://image.slidesharecdn.com/mysqlsysschema-180310230645/85/MySQL-SYS-64-320.jpg)
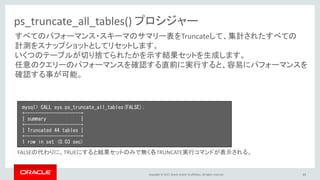


![[Oracle DBA & Developer Day 2016] しばちょう先生の特別講義!!ストレージ管理のベストプラクティス ~ASMからExada...](https://cdn.slidesharecdn.com/ss_thumbnails/mktgdd2-3stragemanagementfordl2-200702092359-thumbnail.jpg?width=640&height=640&fit=bounds)


![[db tech showcase Tokyo 2015] D23:MySQLはドキュメントデータベースになり、HTTPもしゃべる - MySQL Lab...](https://cdn.slidesharecdn.com/ss_thumbnails/dbts-tokyo-2015d23mysqloracle-mysqlgbu-150619101210-lva1-app6891-thumbnail.jpg?width=640&height=640&fit=bounds)


![[D14] MySQL 5.6時代のパフォーマンスチューニング *db tech showcase 2013 Tokyo](https://cdn.slidesharecdn.com/ss_thumbnails/20131110tuningonmysql5-131117180858-phpapp02-thumbnail.jpg?width=640&height=640&fit=bounds)
![[D37]MySQLの真のイノベーションはこれだ!MySQL 5.7と「実験室」 by Ryusuke Kajiyama](https://cdn.slidesharecdn.com/ss_thumbnails/20131115dbtechshowcasemysql57-131119201938-phpapp01-thumbnail.jpg?width=640&height=640&fit=bounds)


![[OSC 2017 Tokyo/Fall] OSSコンソーシアム DB部会 MySQL 8.0](https://cdn.slidesharecdn.com/ss_thumbnails/20170909osc-osscons-mysql8-170918232718-thumbnail.jpg?width=640&height=640&fit=bounds)


