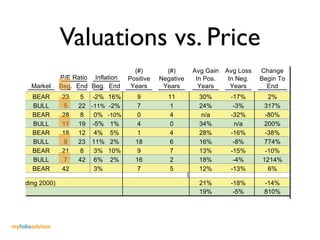
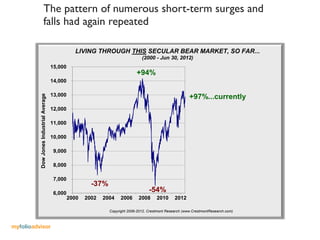
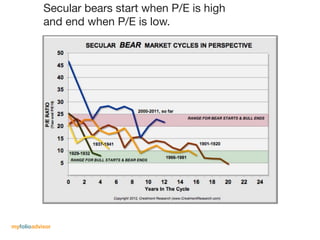
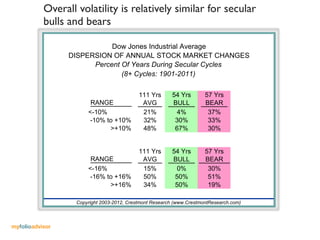
myfolioadvisor.com


 Successful Investing in Bear Markets
myfolioadvisor.com

Investment returns should be measured for consistency.

  Protecting investment assets from market losses is
          crucial to long-term performance.
Different Skills for
                 Different Markets


           “It’s not what you own, it’s how you own it.”

myfolioadvisor
myfolioadvisor
SECULAR BULL & BEAR MARKETS PROFILE: 2011
                                                  (#)                                                           (#)            (#)              (%)            (%)             Max             Max          Avg Gain       Avg Loss         Change
                  Market Cycle                   Total                       P/E Ratio Inflation              Positive       Negative         Positive       Negative        Pos. Yrs       Neg. Yrs         In Pos.        In Neg.         Begin To
               From         To                   Years          Market       Beg. End Beg. End                 Years          Years            Years          Years          In Row          In Row           Years          Years            End
               1901              1920               20          BEAR           23      5 -2% 16%                    9              11           45%             55%               2               3            30%            -17%             2%
               1921              1928                8          BULL            5     22 -11% -2%                   7               1           88%             13%               5               1            24%             -3%            317%
               1929              1932                4          BEAR           28      8  0% -10%                   0               4            0%            100%               0               4             n/a           -32%            -80%
               1933              1936                4          BULL           11     19 -5% 1%                     4               0          100%              0%               4               0            34%              n/a           200%
               1937              1941                5          BEAR           18     12 4% 5%                      1               4           20%             80%               1               3            28%            -16%            -38%
               1942              1965               24          BULL            9     23 11% 2%                    18               6           75%             25%               4               1            16%             -8%            774%
               1966              1981               16          BEAR           21      8  3% 10%                    9               7           56%             44%               3               2            13%            -15%            -10%
               1982              1999               18          BULL            7     42 6% 2%                     16               2           89%             11%               9               1            18%             -4%           1214%
               2000              ????                           BEAR           42         3%                        7               5           58%             42%               3               3            12%            -13%             6%

           WEIGHTED AVERAGE BEAR (excluding 2000)                                                                                               42%             58%               2.1            2.7           21%            -18%            -14%
           WEIGHTED AVERAGE BULL                                                                                                                83%             17%               5.8            0.9           19%             -5%            810%
           Notes: The index and returns reflect the Dow Jones Industrial Average at year-end from Dow Jones & Company. The P/E ratio is based upon the S&P 500 as developed and presented by Robert Shiller (Yale; Irrational Exuberance). Bull & Bear
           Market classifications are based upon Crestmont's assessment of cycles using peak and trough P/E ratios, inflation trends, and other analysis. The presentation does not include dividends, taxes, inflation adjustments, or transaction costs.


           RETURN PATTERN (Red = down year; Green = up year; #% = annual change in the index; starting and ending DJIA index is presented on the ends of the rows)
           1901–1920: BEAR             71      -9%       0% -24% 42% 38% -2% -38% 47% 15% -18% 0%                                       8% -10% -31% 82% -4% -22% 11% 30% -33%                                                                      72
                   P/E Ratio                    23       22    18      16      19     19      13       13     15        14    14        14   12      11      11      12      9         6     7         5
                   CPI: Inflation              -2%       6%    1%      0%      1%     3%      6%      -4%     8%        4%   -8%        7%   3%      1%      1%      8%     17%       18%   15%       16%

           1921–1928: BULL             72     13% 22% -3% 26% 30%                     0%     29% 48%                                                                                                                                               300
                   P/E Ratio                    5        8      8       8      10     12       16      22
                   CPI: Inflation             -11%     -6%     2%      0%      2%     1%      -2%     -2%

           1929–1932: BEAR            300     -17% -34% -53% -23%                                                                                                                                                                                   60
                   P/E Ratio                   28       21     15       8
                   CPI: Inflation              0%      -2%    -9%     -10%

           1933–1936: BULL             60     67%        4%   39% 25%                                                                                                                                                                              180
                   P/E Ratio                    11       12    13      19
                   CPI: Inflation              -5%       3%    2%      1%

           1937–1941: BEAR            180     -33% 28% -3% -13% -15%                                                                                                                                                                               111
                   P/E Ratio                   18       14     16      15      12
                   CPI: Inflation              4%      -2%    -1%      1%      5%

           1942–1965: BULL            111      8%     14% 12% 27% -8%                 2%      -2% 13% 18% 14%                8%      -4% 44% 21%             2% -13% 34% 16% -9% 19% -11% 17% 15% 11%                                              969
                   P/E Ratio                    9        11    11      13      14      11     11       10     11        12    12        12   14      18      18      16      15       18    17        20    19      20      23     23
                   CPI: Inflation              11%       6%    2%      2%      8%     14%     8%      -1%     1%        8%    2%        1%   1%      0%      1%      3%      3%       1%    2%        1%    1%      1%      1%     2%

           1966–1981: BEAR            969     -19% 15%         4% -15% 5%             6%     15% -17% -28% 38% 18% -17% -3%                          4%     15% -9%                                                                                875
                   P/E Ratio                   21        22    21      19      15     17      18      16      11        10    12        10    9      9       9       8
                   CPI: Inflation              3%        3%    4%      5%      6%     4%      3%      6%     11%        9%    6%        7%   8%     11%     13%     10%

           1982–1999: BULL            875     20% 20% -4% 28% 23%                     2%     12% 27% -4% 20%                 4%     14%      2%     33% 26% 23% 16% 25%                                                                           11497
                   P/E Ratio                    7        10     9      11      13     16      14      17      16        18    20        21   20      23      26      31      36       42
                   CPI: Inflation              6%        3%    4%      4%      2%     4%      4%      5%      5%        4%    3%        3%   3%      3%      3%      2%      2%       2%

           2000–????: BEAR          11497      -6% -7% -17% 25%               3%      -1% 16%         6% -34% 19% 11%                   6%
                   P/E Ratio                   42        32    26      24      26     26      26      27      21        17    21        22
                   CPI: Inflation              3%        3%    2%      2%      3%     3%      3%      3%      4%        0%    2%        3%

                                                                            Copyright 2003-2012, Crestmont Research (www.CrestmontResearch.com)


myfolioadvisor
How Long?
                         (#)                                     (#)        (#)
         Market Cycle   Total            P/E Ratio Inflation   Positive   Negative   Positive
      From         To   Years   Market   Beg. End Beg. End      Years      Years
       1901      1920    20     BEAR     23    5 -2% 16%          9         11
       1921      1928     8     BULL      5   22 -11% -2%         7          1
       1929      1932     4     BEAR     28    8  0% -10%         0          4
       1933      1936     4     BULL     11   19 -5% 1%           4          0
       1937      1941     5     BEAR     18   12 4% 5%            1          4
       1942      1965    24     BULL      9   23 11% 2%          18          6
       1966      1981    16     BEAR     21    8  3% 10%          9          7
       1982      1999    18     BULL      7   42 6% 2%           16          2
       2000      ????    ?      BEAR     42       3%              7          5


myfolioadvisor
Valuations vs. Price
                                                            (#)            Max
                                                                           (#)          Avg Gain       Avg Loss        Change
                          P/E Ratio Inflation             Positive      Negative
                                                                        Neg. Yrs        Positive
                                                                                         In Pos.        In Neg.        Begin To
             Market       Beg. End Beg. End                Years         In Row
                                                                         Years            Years          Years           End
             BEAR          23       5 -2% 16%                 9             11             30%            -17%            2%
             BULL           5      22 -11% -2%                7              1             24%             -3%           317%
             BEAR          28       8  0% -10%                0              4              n/a           -32%           -80%
             BULL          11      19 -5% 1%                  4              0             34%              n/a          200%
             BEAR          18      12 4% 5%                   1              4             28%            -16%           -38%
             BULL           9      23 11% 2%                 18              6             16%             -8%           774%
             BEAR          21       8  3% 10%                 9              7             13%            -15%           -10%
             BULL           7      42 6% 2%                  16              2             18%             -4%          1214%
             BEAR          42          3%                     7              5             12%            -13%            6%

AR (excluding 2000)                                                          2.7           21%            -18%           -14%
                                                                             0.9           19%             -5%           810%
     Jones Industrial Average at year-end from Dow Jones & Company. The P/E ratio is based (Yale; Irrational Exuberance). Bull & Bear
                                                                              Robert Shiller


    myfolioadvisor
P/E Bull Begins
   P/E Bear Begins

myfolioadvisor                         P/E Present
myfolioadvisor
Volatility and frequent large rallies are the norm
           and not the exception in secular bear markets


myfolioadvisor
The pattern of numerous short-term surges and
                         falls had again repeated

                                                    LIVING THROUGH THIS SECULAR BEAR MARKET, SO FAR...
                                                                                   (2000 - Jun 30, 2012)
                                         15,000
                                                                                +94%
                                         14,000

                                         13,000                                                              +97%...currently
          Dow Jones Industrial Average


                                         12,000

                                         11,000

                                         10,000

                                          9,000

                                          8,000

                                          7,000
                                                           -37%
                                          6,000
                                                                                       -54%
                                                  2000   2002   2004    2006     2008      2010      2012

                                                                  Copyright 2006-2012, Crestmont Research (www.CrestmontResearch.com)


myfolioadvisor
myfolioadvisor
Secular bulls start when P/E is low and end when
           P/E is high


myfolioadvisor
Secular bears start when P/E is high
           and end when P/E is low.


myfolioadvisor
Overall volatility is relatively similar for secular
           bulls and bears

                            Dow Jones Industrial Average
                 DISPERSION OF ANNUAL STOCK MARKET CHANGES
                       Percent Of Years During Secular Cycles
                               (8+ Cycles: 1901-2011)

                                            111 Yrs       54 Yrs       57 Yrs
                        RANGE                AVG          BULL         BEAR
                       <-10%                 21%           4%           37%
                        -10% to +10%         32%           30%          33%
                              >+10%          48%           67%          30%


                                            111 Yrs       54 Yrs       57 Yrs
                        RANGE                AVG          BULL         BEAR
                       <-16%                 15%           0%           30%
                        -16% to +16%         50%           50%          51%
                              >+16%          34%           50%          19%

                   Copyright 2003-2012, Crestmont Research (www.CrestmontResearch.com)


myfolioadvisor
myfolioadvisor
myfolioadvisor

myfolioadvisor.com bear markets

  • 1.
  • 2.
    myfolioadvisor.com Investment returns shouldbe measured for consistency. Protecting investment assets from market losses is crucial to long-term performance.
  • 3.
    Different Skills for Different Markets “It’s not what you own, it’s how you own it.” myfolioadvisor
  • 4.
  • 5.
    SECULAR BULL &BEAR MARKETS PROFILE: 2011 (#) (#) (#) (%) (%) Max Max Avg Gain Avg Loss Change Market Cycle Total P/E Ratio Inflation Positive Negative Positive Negative Pos. Yrs Neg. Yrs In Pos. In Neg. Begin To From To Years Market Beg. End Beg. End Years Years Years Years In Row In Row Years Years End 1901 1920 20 BEAR 23 5 -2% 16% 9 11 45% 55% 2 3 30% -17% 2% 1921 1928 8 BULL 5 22 -11% -2% 7 1 88% 13% 5 1 24% -3% 317% 1929 1932 4 BEAR 28 8 0% -10% 0 4 0% 100% 0 4 n/a -32% -80% 1933 1936 4 BULL 11 19 -5% 1% 4 0 100% 0% 4 0 34% n/a 200% 1937 1941 5 BEAR 18 12 4% 5% 1 4 20% 80% 1 3 28% -16% -38% 1942 1965 24 BULL 9 23 11% 2% 18 6 75% 25% 4 1 16% -8% 774% 1966 1981 16 BEAR 21 8 3% 10% 9 7 56% 44% 3 2 13% -15% -10% 1982 1999 18 BULL 7 42 6% 2% 16 2 89% 11% 9 1 18% -4% 1214% 2000 ???? BEAR 42 3% 7 5 58% 42% 3 3 12% -13% 6% WEIGHTED AVERAGE BEAR (excluding 2000) 42% 58% 2.1 2.7 21% -18% -14% WEIGHTED AVERAGE BULL 83% 17% 5.8 0.9 19% -5% 810% Notes: The index and returns reflect the Dow Jones Industrial Average at year-end from Dow Jones & Company. The P/E ratio is based upon the S&P 500 as developed and presented by Robert Shiller (Yale; Irrational Exuberance). Bull & Bear Market classifications are based upon Crestmont's assessment of cycles using peak and trough P/E ratios, inflation trends, and other analysis. The presentation does not include dividends, taxes, inflation adjustments, or transaction costs. RETURN PATTERN (Red = down year; Green = up year; #% = annual change in the index; starting and ending DJIA index is presented on the ends of the rows) 1901–1920: BEAR 71 -9% 0% -24% 42% 38% -2% -38% 47% 15% -18% 0% 8% -10% -31% 82% -4% -22% 11% 30% -33% 72 P/E Ratio 23 22 18 16 19 19 13 13 15 14 14 14 12 11 11 12 9 6 7 5 CPI: Inflation -2% 6% 1% 0% 1% 3% 6% -4% 8% 4% -8% 7% 3% 1% 1% 8% 17% 18% 15% 16% 1921–1928: BULL 72 13% 22% -3% 26% 30% 0% 29% 48% 300 P/E Ratio 5 8 8 8 10 12 16 22 CPI: Inflation -11% -6% 2% 0% 2% 1% -2% -2% 1929–1932: BEAR 300 -17% -34% -53% -23% 60 P/E Ratio 28 21 15 8 CPI: Inflation 0% -2% -9% -10% 1933–1936: BULL 60 67% 4% 39% 25% 180 P/E Ratio 11 12 13 19 CPI: Inflation -5% 3% 2% 1% 1937–1941: BEAR 180 -33% 28% -3% -13% -15% 111 P/E Ratio 18 14 16 15 12 CPI: Inflation 4% -2% -1% 1% 5% 1942–1965: BULL 111 8% 14% 12% 27% -8% 2% -2% 13% 18% 14% 8% -4% 44% 21% 2% -13% 34% 16% -9% 19% -11% 17% 15% 11% 969 P/E Ratio 9 11 11 13 14 11 11 10 11 12 12 12 14 18 18 16 15 18 17 20 19 20 23 23 CPI: Inflation 11% 6% 2% 2% 8% 14% 8% -1% 1% 8% 2% 1% 1% 0% 1% 3% 3% 1% 2% 1% 1% 1% 1% 2% 1966–1981: BEAR 969 -19% 15% 4% -15% 5% 6% 15% -17% -28% 38% 18% -17% -3% 4% 15% -9% 875 P/E Ratio 21 22 21 19 15 17 18 16 11 10 12 10 9 9 9 8 CPI: Inflation 3% 3% 4% 5% 6% 4% 3% 6% 11% 9% 6% 7% 8% 11% 13% 10% 1982–1999: BULL 875 20% 20% -4% 28% 23% 2% 12% 27% -4% 20% 4% 14% 2% 33% 26% 23% 16% 25% 11497 P/E Ratio 7 10 9 11 13 16 14 17 16 18 20 21 20 23 26 31 36 42 CPI: Inflation 6% 3% 4% 4% 2% 4% 4% 5% 5% 4% 3% 3% 3% 3% 3% 2% 2% 2% 2000–????: BEAR 11497 -6% -7% -17% 25% 3% -1% 16% 6% -34% 19% 11% 6% P/E Ratio 42 32 26 24 26 26 26 27 21 17 21 22 CPI: Inflation 3% 3% 2% 2% 3% 3% 3% 3% 4% 0% 2% 3% Copyright 2003-2012, Crestmont Research (www.CrestmontResearch.com) myfolioadvisor
  • 6.
    How Long? (#) (#) (#) Market Cycle Total P/E Ratio Inflation Positive Negative Positive From To Years Market Beg. End Beg. End Years Years 1901 1920 20 BEAR 23 5 -2% 16% 9 11 1921 1928 8 BULL 5 22 -11% -2% 7 1 1929 1932 4 BEAR 28 8 0% -10% 0 4 1933 1936 4 BULL 11 19 -5% 1% 4 0 1937 1941 5 BEAR 18 12 4% 5% 1 4 1942 1965 24 BULL 9 23 11% 2% 18 6 1966 1981 16 BEAR 21 8 3% 10% 9 7 1982 1999 18 BULL 7 42 6% 2% 16 2 2000 ???? ? BEAR 42 3% 7 5 myfolioadvisor
  • 7.
    Valuations vs. Price (#) Max (#) Avg Gain Avg Loss Change P/E Ratio Inflation Positive Negative Neg. Yrs Positive In Pos. In Neg. Begin To Market Beg. End Beg. End Years In Row Years Years Years End BEAR 23 5 -2% 16% 9 11 30% -17% 2% BULL 5 22 -11% -2% 7 1 24% -3% 317% BEAR 28 8 0% -10% 0 4 n/a -32% -80% BULL 11 19 -5% 1% 4 0 34% n/a 200% BEAR 18 12 4% 5% 1 4 28% -16% -38% BULL 9 23 11% 2% 18 6 16% -8% 774% BEAR 21 8 3% 10% 9 7 13% -15% -10% BULL 7 42 6% 2% 16 2 18% -4% 1214% BEAR 42 3% 7 5 12% -13% 6% AR (excluding 2000) 2.7 21% -18% -14% 0.9 19% -5% 810% Jones Industrial Average at year-end from Dow Jones & Company. The P/E ratio is based (Yale; Irrational Exuberance). Bull & Bear Robert Shiller myfolioadvisor
  • 8.
    P/E Bull Begins P/E Bear Begins myfolioadvisor P/E Present
  • 9.
  • 10.
    Volatility and frequentlarge rallies are the norm and not the exception in secular bear markets myfolioadvisor
  • 11.
    The pattern ofnumerous short-term surges and falls had again repeated LIVING THROUGH THIS SECULAR BEAR MARKET, SO FAR... (2000 - Jun 30, 2012) 15,000 +94% 14,000 13,000 +97%...currently Dow Jones Industrial Average 12,000 11,000 10,000 9,000 8,000 7,000 -37% 6,000 -54% 2000 2002 2004 2006 2008 2010 2012 Copyright 2006-2012, Crestmont Research (www.CrestmontResearch.com) myfolioadvisor
  • 12.
  • 13.
    Secular bulls startwhen P/E is low and end when P/E is high myfolioadvisor
  • 14.
    Secular bears startwhen P/E is high and end when P/E is low. myfolioadvisor
  • 15.
    Overall volatility isrelatively similar for secular bulls and bears Dow Jones Industrial Average DISPERSION OF ANNUAL STOCK MARKET CHANGES Percent Of Years During Secular Cycles (8+ Cycles: 1901-2011) 111 Yrs 54 Yrs 57 Yrs RANGE AVG BULL BEAR <-10% 21% 4% 37% -10% to +10% 32% 30% 33% >+10% 48% 67% 30% 111 Yrs 54 Yrs 57 Yrs RANGE AVG BULL BEAR <-16% 15% 0% 30% -16% to +16% 50% 50% 51% >+16% 34% 50% 19% Copyright 2003-2012, Crestmont Research (www.CrestmontResearch.com) myfolioadvisor
  • 16.
  • 17.

Editor's Notes

  • #2 \n
  • #3 \n
  • #4 In secular bear market periods, successful stock market investing requires a far different (and sometimes opposite) set of skills and techniques than what is required in bull markets\n
  • #5 where are we?\n
  • #6 For a good overview of the past nine years and this secular bear market, here&apos;s an update to Table 5.6 in Bull&apos;s Eye Investing. When we wrote the chapters in 2003, the charts and graphs were current through year-end 2002. At the time, P/E was a lofty 26 &amp;#x2013;though it had come down significantly from bubble levels in the 40s. To reduce the distortions to P/E caused by the earnings cycle, earnings (E) were normalized using the approach popularized by Robert Shiller at Yale (which uses earnings over a ten-year period). The resulting P/E is often called the cyclically adjusted P/E, or P/E 10. There are several points to emphasize in the chart above. This secular bear (so far!) has been relatively calm compared to historical secular bears. The typical bear has more negative years than positive years (only 42% positive), yet this cycle so far has had more positive years (58% positive). The gain and loss years have been more muted, with gains and losses averaging around two-thirds of normal levels.\nCertainly this secular bear has not been calm as we have experienced it in real time, but the relative calmness compared to past cycles may be an indicator of what lies ahead before the bear retires.\n\n
  • #7 \n
  • #8 \n
  • #9 \nit is more useful to analyze stocks during secular bear markets in terms of value than in terms of price... These cycles generally take a generation to work their way through the investor public, have significant magnitudes of becoming undervalued and overvalued, and have significant implications for the way that investors should approach each of these periods.\nSo far, this secular bear has not made much progress through the fundamental process that a secular bear must undergo.\nvolatility and frequent large rallies are the norm and not the exception, thus giving the astute investor some terrific opportunities.\n\n
  • #10 When P/E ratios are rising, the saying that a &quot;rising tide lifts all boats&quot; has been historically true. When P/Es are dropping, stock market investing is tricky; index investing is an experiment in futility. \nOur discussion of a coming secular bear market almost ten years ago was not hypothetical forecasting, but rather it was a discussion about the fundamental factors that drive stock market returns. Even though it is challenging to predict the market over months and quarters or even a few years, we believe the data shows that the stock market is quite predictable over some longer periods. Those periods are the secular stock market cycles of above-average bulls and below-average bears.\n
  • #11 Here&apos;s the previous secular bear (1966-1981) as an example. Yes, the 54% decline by 2009 was greater than the 45% in 1974, but the pattern of numerous short-term surges and falls had again repeated.\n
  • #12 The pattern and process have not been very different from what we expected in 2003. As we wrote in Bull&apos;s Eye Investing, &quot;... volatility and frequent large rallies are the norm and not the exception&quot; in secular bear markets.\n
  • #13 \n
  • #14 Are We There Yet?\nHere are two new charts from Crestmont Research that explain how we got here and just how much farther we have to go. The charts reflect the normalized P/E ratio for the S&amp;P 500 Index for all secular bull and secular bear cycles since 1900. The lines on the charts show the price/earnings ratio (P/E) over the life of each secular cycle.\nFirst, note that secular bulls start when P/E is low and end when P/E is high. Look at the secular bull of the 1980s and 1990s. It is as though that secular bull ran its course through the mid-1990s, then P/E more than doubled again. The already high P/E ascended to the bubblesphere.\n\nThe stock market&apos;s gyrations and underlying earnings growth over the past nine years have driven P/E from the mid-twenties to the low twenties, but the market has yet to experience the full process of valuation declines in the face of an adverse inflation rate trending into deflation or high inflation.\n\n
  • #15 \n
  • #16 the stock market is much more volatile than most people realize. Rather than use confusing and boring statistics, we took more of a layman&apos;s approach. We highlighted that the market moves up or down more than 10% annually in almost 70% of the years. It moves more than 16% in either direction in half of all years. So what has happened so far in the present cycle?\nCrestmont has updated that volatility analysis through 2011, and it now reveals new insights by breaking out separate details for bulls and bears. It is striking that overall volatility is relatively similar for secular bulls and bears. Note the frequency inside the 10% and 16% ranges. In both secular bulls and bears, nearly 30% and 50% of the years fall inside the respective ranges. The difference is that bulls predominantly have upside years, while bears have more downside years.\nThe results so far for this secular bear have been a bit different. First, there have been more inside years &amp;#x2013; another indication that the first part of this secular bear has been a bit tamer than usual. Second, notwithstanding the crisis plunge into 2009, the downside years have been under-represented. Why?\n\n
  • #17 \n
  • #18 \n