SlideShare a Scribd company logo
1 of 1
Download to read offline
P T Pa n i n S e k u r i t a s , T b k .
                                                                                                                6 S e p te m be r 2 0 1 1
                                                                                                                Net Asset Value:
             D ISCR ETION ARY F U ND                                                                            1 0 ,3 1 5 B i o

             PANS B AND U NG                                                                                    N A V / U ni t :
                                                                                                                3 ,8 2 7 .5 0 0 3
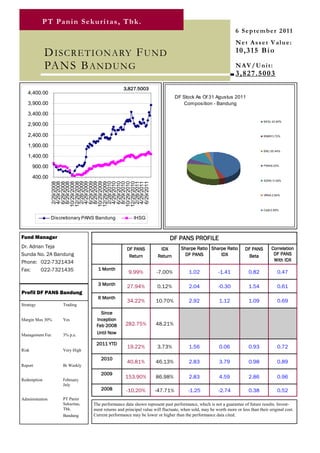
                                                  3,827.5003
   4,400.00
                                                                               DF Stock As Of 31 Agustus 2011
   3,900.00                                                                       Composition - Bandung

   3,400.00
                                                                                                                                BKSL 42.90%
   2,900.00

   2,400.00                                                                                                                     BNBR 3.72%


   1,900.00
                                                                                                                                BNLI 30.44%
   1,400.00
       900.00                                                                                                                   PNIN 6.03%


       400.00
                                                                                                                                SDRA 11.39%
                  2/29/2008
                  4/29/2008
                  6/29/2008
                  8/29/2008
                 10/29/2008
                 12/29/2008
                  2/28/2009
                  4/29/2009
                  6/29/2009
                  8/29/2009
                 10/29/2009
                 12/29/2009
                  2/28/2010
                  4/29/2010
                  6/29/2010
                  8/29/2010
                 10/29/2010
                 12/29/2010
                  2/28/2011
                  4/29/2011
                  6/29/2011


                                                                                                                                VRNA 2.84%


                                                                                                                                Cash 2.69%

                 Discretionary PANS Bandung             IHSG


Fund Manager                                                                DF PANS PROFILE
Dr. Adrian Teja                                     DF PANS           IDX         Sharpe Ratio Sharpe Ratio           DF PANS        Correlation
Sunda No. 2A Bandung                                 Return          Return         DF PANS        IDX                 Beta           DF PANS
Phone: 022-7321434                                                                                                                    With IDX

Fax:     022-7321435                1 Month
                                                     9.99%           -7.00%           1.02             -1.41            0.82            0.47

                                    3 Month         27.94%           0.12%            2.04             -0.30            1.54            0.61
Profil DF PANS Bandung
                                    6 Month
                                                    34.22%          10.70%            2.92             1.12             1.09            0.69
Strategy             Trading
                                     Since
Margin Max 30%       Yes           Inception
                                   Feb 2008        282.75%          48.21%

Management Fee       3% p.a.       Until Now

                                   2011 YTD
                                                    19.22%           3.73%            1.56             0.06             0.93            0.72
Risk                 Very High

                                      2010
                                                    40.81%          46.13%            2.83             3.79             0.98            0.89
Report               Bi Weekly
                                      2009
                                                   153.90%          86.98%            2.83             4.59             2.86            0.96
Redemption           February
                     July
                                      2008          -10.20%         -47.71%           -1.25            -2.74            0.38            0.52
Administration       PT Panin
                     Sekuritas,   The performance data shown represent past performance, which is not a guarantee of future results. Invest-
                     Tbk.         ment returns and principal value will fluctuate, when sold, may be worth more or less than their original cost.
                     Bandung      Current performance may be lower or higher than the performance data cited.

More Related Content

What's hot

Real Estate Magnolia | Market Report Nov. 2012
Real Estate Magnolia | Market Report Nov. 2012Real Estate Magnolia | Market Report Nov. 2012
Real Estate Magnolia | Market Report Nov. 2012Tanya Lavoie Bugbee
 
Magnolia TX 77354 | Real Estate Home Sales Report
Magnolia TX 77354 | Real Estate Home Sales ReportMagnolia TX 77354 | Real Estate Home Sales Report
Magnolia TX 77354 | Real Estate Home Sales ReportKen Brand
 
Stora Enso CMD - Presentation by Ulla Paajanen-Sainio, Head of Investor Relat...
Stora Enso CMD - Presentation by Ulla Paajanen-Sainio, Head of Investor Relat...Stora Enso CMD - Presentation by Ulla Paajanen-Sainio, Head of Investor Relat...
Stora Enso CMD - Presentation by Ulla Paajanen-Sainio, Head of Investor Relat...Stora Enso
 
Magnolia Real Estate Report 2012
Magnolia Real Estate Report 2012Magnolia Real Estate Report 2012
Magnolia Real Estate Report 2012Tanya Lavoie Bugbee
 
unum group 01 08_Non-GAAP
unum group   01 08_Non-GAAPunum group   01 08_Non-GAAP
unum group 01 08_Non-GAAPfinance26
 
gannett 2003ar
gannett 2003argannett 2003ar
gannett 2003arfinance30
 
Real Estate Market and Home Sales Report for Magnolia TX | December 2013
Real Estate Market and Home Sales Report for Magnolia TX | December 2013Real Estate Market and Home Sales Report for Magnolia TX | December 2013
Real Estate Market and Home Sales Report for Magnolia TX | December 2013Ken Brand
 
Multi office 200 cards per year
Multi office 200 cards per yearMulti office 200 cards per year
Multi office 200 cards per yearClear Line
 
anheuser-busch 2006AR_FinancialHighlights
anheuser-busch 2006AR_FinancialHighlightsanheuser-busch 2006AR_FinancialHighlights
anheuser-busch 2006AR_FinancialHighlightsfinance15
 
capital one Annual Report1997
capital one  Annual Report1997capital one  Annual Report1997
capital one Annual Report1997finance13
 
omnicom group Q4 2007 Investor Presentation
omnicom group  Q4 2007 Investor Presentationomnicom group  Q4 2007 Investor Presentation
omnicom group Q4 2007 Investor Presentationfinance22
 
omnicom group Q4 2007 Earnings Release
omnicom group  Q4 2007 Earnings Releaseomnicom group  Q4 2007 Earnings Release
omnicom group Q4 2007 Earnings Releasefinance22
 
4 q07 results presentation
4 q07 results presentation4 q07 results presentation
4 q07 results presentationCSURIWEB
 

What's hot (14)

Real Estate Magnolia | Market Report Nov. 2012
Real Estate Magnolia | Market Report Nov. 2012Real Estate Magnolia | Market Report Nov. 2012
Real Estate Magnolia | Market Report Nov. 2012
 
Magnolia TX 77354 | Real Estate Home Sales Report
Magnolia TX 77354 | Real Estate Home Sales ReportMagnolia TX 77354 | Real Estate Home Sales Report
Magnolia TX 77354 | Real Estate Home Sales Report
 
Stora Enso CMD - Presentation by Ulla Paajanen-Sainio, Head of Investor Relat...
Stora Enso CMD - Presentation by Ulla Paajanen-Sainio, Head of Investor Relat...Stora Enso CMD - Presentation by Ulla Paajanen-Sainio, Head of Investor Relat...
Stora Enso CMD - Presentation by Ulla Paajanen-Sainio, Head of Investor Relat...
 
Magnolia Real Estate Report 2012
Magnolia Real Estate Report 2012Magnolia Real Estate Report 2012
Magnolia Real Estate Report 2012
 
unum group 01 08_Non-GAAP
unum group   01 08_Non-GAAPunum group   01 08_Non-GAAP
unum group 01 08_Non-GAAP
 
Win presentation
Win presentationWin presentation
Win presentation
 
gannett 2003ar
gannett 2003argannett 2003ar
gannett 2003ar
 
Real Estate Market and Home Sales Report for Magnolia TX | December 2013
Real Estate Market and Home Sales Report for Magnolia TX | December 2013Real Estate Market and Home Sales Report for Magnolia TX | December 2013
Real Estate Market and Home Sales Report for Magnolia TX | December 2013
 
Multi office 200 cards per year
Multi office 200 cards per yearMulti office 200 cards per year
Multi office 200 cards per year
 
anheuser-busch 2006AR_FinancialHighlights
anheuser-busch 2006AR_FinancialHighlightsanheuser-busch 2006AR_FinancialHighlights
anheuser-busch 2006AR_FinancialHighlights
 
capital one Annual Report1997
capital one  Annual Report1997capital one  Annual Report1997
capital one Annual Report1997
 
omnicom group Q4 2007 Investor Presentation
omnicom group  Q4 2007 Investor Presentationomnicom group  Q4 2007 Investor Presentation
omnicom group Q4 2007 Investor Presentation
 
omnicom group Q4 2007 Earnings Release
omnicom group  Q4 2007 Earnings Releaseomnicom group  Q4 2007 Earnings Release
omnicom group Q4 2007 Earnings Release
 
4 q07 results presentation
4 q07 results presentation4 q07 results presentation
4 q07 results presentation
 

Similar to My Discretionary Fund

My Discretionary Fund 30 April 2012
My Discretionary Fund 30 April 2012My Discretionary Fund 30 April 2012
My Discretionary Fund 30 April 2012Adrian Teja
 
Df Report Per 31 Agustus 2009
Df Report Per 31 Agustus 2009Df Report Per 31 Agustus 2009
Df Report Per 31 Agustus 2009Adrian Teja
 
Df Pans Bandung Report 1 Juni 2009
Df Pans Bandung Report 1 Juni 2009Df Pans Bandung Report 1 Juni 2009
Df Pans Bandung Report 1 Juni 2009Adrian Teja
 
Df Report 10 Juli 2009
Df Report 10 Juli 2009Df Report 10 Juli 2009
Df Report 10 Juli 2009Adrian Teja
 
Df Report 26 Juni 2009
Df Report 26 Juni 2009Df Report 26 Juni 2009
Df Report 26 Juni 2009Adrian Teja
 
Df Report 15 Juni 2009
Df Report 15 Juni 2009Df Report 15 Juni 2009
Df Report 15 Juni 2009Adrian Teja
 
DF Report As Of 30 September 2010
DF Report As Of 30 September 2010DF Report As Of 30 September 2010
DF Report As Of 30 September 2010Adrian Teja
 
DF Report 02 August 2010
DF Report 02 August 2010DF Report 02 August 2010
DF Report 02 August 2010Adrian Teja
 
Palm Springs Area Listings Sold By Calendar Quarter (Through March 2010)
Palm Springs Area Listings Sold By Calendar Quarter (Through March 2010)Palm Springs Area Listings Sold By Calendar Quarter (Through March 2010)
Palm Springs Area Listings Sold By Calendar Quarter (Through March 2010)SDM: Music Venture
 
DF Report 30 Juni 2010
DF Report 30 Juni 2010DF Report 30 Juni 2010
DF Report 30 Juni 2010Adrian Teja
 
Banco Sabadell FY10 Results
Banco Sabadell FY10 ResultsBanco Sabadell FY10 Results
Banco Sabadell FY10 ResultsBanco Sabadell
 
Wheres the-money-in-local-media
Wheres the-money-in-local-mediaWheres the-money-in-local-media
Wheres the-money-in-local-mediaMediative
 

Similar to My Discretionary Fund (20)

My Discretionary Fund 30 April 2012
My Discretionary Fund 30 April 2012My Discretionary Fund 30 April 2012
My Discretionary Fund 30 April 2012
 
Df Report Per 31 Agustus 2009
Df Report Per 31 Agustus 2009Df Report Per 31 Agustus 2009
Df Report Per 31 Agustus 2009
 
Df Pans Bandung Report 1 Juni 2009
Df Pans Bandung Report 1 Juni 2009Df Pans Bandung Report 1 Juni 2009
Df Pans Bandung Report 1 Juni 2009
 
Df Report 10 Juli 2009
Df Report 10 Juli 2009Df Report 10 Juli 2009
Df Report 10 Juli 2009
 
Df Report 26 Juni 2009
Df Report 26 Juni 2009Df Report 26 Juni 2009
Df Report 26 Juni 2009
 
Df Report 15 Juni 2009
Df Report 15 Juni 2009Df Report 15 Juni 2009
Df Report 15 Juni 2009
 
DF Report As Of 30 September 2010
DF Report As Of 30 September 2010DF Report As Of 30 September 2010
DF Report As Of 30 September 2010
 
DF Report 02 August 2010
DF Report 02 August 2010DF Report 02 August 2010
DF Report 02 August 2010
 
K bank daily feb 8
K bank daily feb 8K bank daily feb 8
K bank daily feb 8
 
Palm Springs Area Listings Sold By Calendar Quarter (Through March 2010)
Palm Springs Area Listings Sold By Calendar Quarter (Through March 2010)Palm Springs Area Listings Sold By Calendar Quarter (Through March 2010)
Palm Springs Area Listings Sold By Calendar Quarter (Through March 2010)
 
K bank daily feb 7
K bank daily feb 7K bank daily feb 7
K bank daily feb 7
 
DF Report 30 Juni 2010
DF Report 30 Juni 2010DF Report 30 Juni 2010
DF Report 30 Juni 2010
 
K bank daily feb 2
K bank daily feb 2K bank daily feb 2
K bank daily feb 2
 
Kbank daily jan 26
Kbank daily jan 26Kbank daily jan 26
Kbank daily jan 26
 
Equity Schemes Performance Snapshot
Equity Schemes Performance SnapshotEquity Schemes Performance Snapshot
Equity Schemes Performance Snapshot
 
Kbank daily jan 28
Kbank daily jan 28Kbank daily jan 28
Kbank daily jan 28
 
Banco Sabadell FY10 Results
Banco Sabadell FY10 ResultsBanco Sabadell FY10 Results
Banco Sabadell FY10 Results
 
K bank daily mar 7
K bank daily mar 7K bank daily mar 7
K bank daily mar 7
 
Wheres the-money-in-local-media
Wheres the-money-in-local-mediaWheres the-money-in-local-media
Wheres the-money-in-local-media
 
Q1 2009 Earning Report of Starhill Global Real
Q1 2009 Earning Report of Starhill Global RealQ1 2009 Earning Report of Starhill Global Real
Q1 2009 Earning Report of Starhill Global Real
 

More from Adrian Teja

Indonesia economic and investment outlook 2018
Indonesia economic and investment outlook 2018Indonesia economic and investment outlook 2018
Indonesia economic and investment outlook 2018Adrian Teja
 
My Discretionary Fund 16 March 2012
My Discretionary Fund 16 March 2012My Discretionary Fund 16 March 2012
My Discretionary Fund 16 March 2012Adrian Teja
 
MY DF Performance 13 January 2012
MY DF Performance 13 January 2012MY DF Performance 13 January 2012
MY DF Performance 13 January 2012Adrian Teja
 
Analisis Saham Sentul City (BKSL) 05 Januari 2012
Analisis Saham Sentul City (BKSL) 05 Januari 2012Analisis Saham Sentul City (BKSL) 05 Januari 2012
Analisis Saham Sentul City (BKSL) 05 Januari 2012Adrian Teja
 
Investment Opportunity In Indonesia 12 November 2011
Investment Opportunity In Indonesia 12 November 2011Investment Opportunity In Indonesia 12 November 2011
Investment Opportunity In Indonesia 12 November 2011Adrian Teja
 
CAT CDO Indonesia Konferensi Bisnis Hijau Prasetiya Mulya 30 November 2011
CAT CDO Indonesia Konferensi Bisnis Hijau Prasetiya Mulya 30 November 2011CAT CDO Indonesia Konferensi Bisnis Hijau Prasetiya Mulya 30 November 2011
CAT CDO Indonesia Konferensi Bisnis Hijau Prasetiya Mulya 30 November 2011Adrian Teja
 
DF Report Final 30 November 2010
DF Report Final 30 November 2010DF Report Final 30 November 2010
DF Report Final 30 November 2010Adrian Teja
 
Df Report 14 Juni 2010
Df Report 14 Juni 2010Df Report 14 Juni 2010
Df Report 14 Juni 2010Adrian Teja
 
Df Report 26 April 2010
Df Report 26 April 2010Df Report 26 April 2010
Df Report 26 April 2010Adrian Teja
 
Df Report 25 Maret 2010
Df Report 25 Maret 2010Df Report 25 Maret 2010
Df Report 25 Maret 2010Adrian Teja
 
Df Report Per 17 Nov 2009
Df Report Per 17 Nov 2009Df Report Per 17 Nov 2009
Df Report Per 17 Nov 2009Adrian Teja
 
Df Report Per 19 Oktober 2009
Df Report Per 19 Oktober 2009Df Report Per 19 Oktober 2009
Df Report Per 19 Oktober 2009Adrian Teja
 
Df Report Per 19 Agustus 2009
Df Report Per 19 Agustus 2009Df Report Per 19 Agustus 2009
Df Report Per 19 Agustus 2009Adrian Teja
 

More from Adrian Teja (14)

Indonesia economic and investment outlook 2018
Indonesia economic and investment outlook 2018Indonesia economic and investment outlook 2018
Indonesia economic and investment outlook 2018
 
My Discretionary Fund 16 March 2012
My Discretionary Fund 16 March 2012My Discretionary Fund 16 March 2012
My Discretionary Fund 16 March 2012
 
MY DF Performance 13 January 2012
MY DF Performance 13 January 2012MY DF Performance 13 January 2012
MY DF Performance 13 January 2012
 
Analisis Saham Sentul City (BKSL) 05 Januari 2012
Analisis Saham Sentul City (BKSL) 05 Januari 2012Analisis Saham Sentul City (BKSL) 05 Januari 2012
Analisis Saham Sentul City (BKSL) 05 Januari 2012
 
My DF
My DFMy DF
My DF
 
Investment Opportunity In Indonesia 12 November 2011
Investment Opportunity In Indonesia 12 November 2011Investment Opportunity In Indonesia 12 November 2011
Investment Opportunity In Indonesia 12 November 2011
 
CAT CDO Indonesia Konferensi Bisnis Hijau Prasetiya Mulya 30 November 2011
CAT CDO Indonesia Konferensi Bisnis Hijau Prasetiya Mulya 30 November 2011CAT CDO Indonesia Konferensi Bisnis Hijau Prasetiya Mulya 30 November 2011
CAT CDO Indonesia Konferensi Bisnis Hijau Prasetiya Mulya 30 November 2011
 
DF Report Final 30 November 2010
DF Report Final 30 November 2010DF Report Final 30 November 2010
DF Report Final 30 November 2010
 
Df Report 14 Juni 2010
Df Report 14 Juni 2010Df Report 14 Juni 2010
Df Report 14 Juni 2010
 
Df Report 26 April 2010
Df Report 26 April 2010Df Report 26 April 2010
Df Report 26 April 2010
 
Df Report 25 Maret 2010
Df Report 25 Maret 2010Df Report 25 Maret 2010
Df Report 25 Maret 2010
 
Df Report Per 17 Nov 2009
Df Report Per 17 Nov 2009Df Report Per 17 Nov 2009
Df Report Per 17 Nov 2009
 
Df Report Per 19 Oktober 2009
Df Report Per 19 Oktober 2009Df Report Per 19 Oktober 2009
Df Report Per 19 Oktober 2009
 
Df Report Per 19 Agustus 2009
Df Report Per 19 Agustus 2009Df Report Per 19 Agustus 2009
Df Report Per 19 Agustus 2009
 

My Discretionary Fund

  • 1. P T Pa n i n S e k u r i t a s , T b k . 6 S e p te m be r 2 0 1 1 Net Asset Value: D ISCR ETION ARY F U ND 1 0 ,3 1 5 B i o PANS B AND U NG N A V / U ni t : 3 ,8 2 7 .5 0 0 3 3,827.5003 4,400.00 DF Stock As Of 31 Agustus 2011 3,900.00 Composition - Bandung 3,400.00 BKSL 42.90% 2,900.00 2,400.00 BNBR 3.72% 1,900.00 BNLI 30.44% 1,400.00 900.00 PNIN 6.03% 400.00 SDRA 11.39% 2/29/2008 4/29/2008 6/29/2008 8/29/2008 10/29/2008 12/29/2008 2/28/2009 4/29/2009 6/29/2009 8/29/2009 10/29/2009 12/29/2009 2/28/2010 4/29/2010 6/29/2010 8/29/2010 10/29/2010 12/29/2010 2/28/2011 4/29/2011 6/29/2011 VRNA 2.84% Cash 2.69% Discretionary PANS Bandung IHSG Fund Manager DF PANS PROFILE Dr. Adrian Teja DF PANS IDX Sharpe Ratio Sharpe Ratio DF PANS Correlation Sunda No. 2A Bandung Return Return DF PANS IDX Beta DF PANS Phone: 022-7321434 With IDX Fax: 022-7321435 1 Month 9.99% -7.00% 1.02 -1.41 0.82 0.47 3 Month 27.94% 0.12% 2.04 -0.30 1.54 0.61 Profil DF PANS Bandung 6 Month 34.22% 10.70% 2.92 1.12 1.09 0.69 Strategy Trading Since Margin Max 30% Yes Inception Feb 2008 282.75% 48.21% Management Fee 3% p.a. Until Now 2011 YTD 19.22% 3.73% 1.56 0.06 0.93 0.72 Risk Very High 2010 40.81% 46.13% 2.83 3.79 0.98 0.89 Report Bi Weekly 2009 153.90% 86.98% 2.83 4.59 2.86 0.96 Redemption February July 2008 -10.20% -47.71% -1.25 -2.74 0.38 0.52 Administration PT Panin Sekuritas, The performance data shown represent past performance, which is not a guarantee of future results. Invest- Tbk. ment returns and principal value will fluctuate, when sold, may be worth more or less than their original cost. Bandung Current performance may be lower or higher than the performance data cited.