Multifamily Migration: Who Is Moving Where?
•
0 likes•31 views

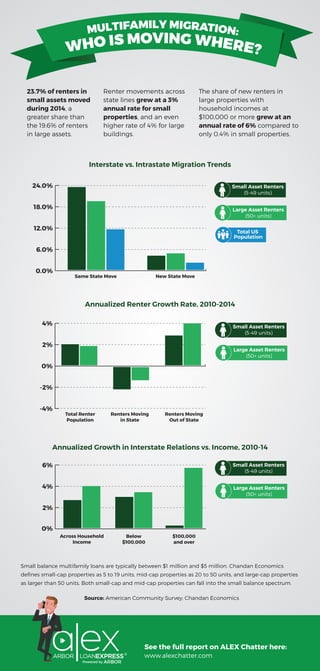
Ivan Kaufman's infographic discussing and showing data collected regarding; interstate vs. intrastate migration trends, annualized renter growth rate, and annualized growth rate in interstate relations vs. income.
Recommended

Recommended
More Related Content
Similar to Multifamily Migration: Who Is Moving Where?
Similar to Multifamily Migration: Who Is Moving Where? (20)
More from Ivan Kaufman
More from Ivan Kaufman (20)
Recently uploaded
Recently uploaded (20)
Multifamily Migration: Who Is Moving Where?
- 1. MULTIFAMILY MIGRATION: WHO IS MOVING WHERE? 23.7% of renters in small assets moved during 2014, a greater share than the 19.6% of renters in large assets. Renter movements across state lines grew at a 3% annual rate for small properties, and an even higher rate of 4% for large buildings. The share of new renters in large properties with household incomes at $100,000 or more grew at an annual rate of 6% compared to only 0.4% in small properties. Interstate vs. Intrastate Migration Trends 0.0% 6.0% 12.0% 18.0% 24.0% Same State Move New State Move Small Asset Renters (5-49 units) Large Asset Renters (50+ units) Total US Population Annualized Renter Growth Rate, 2010-2014 -4% -2% 0% 2% 4% Total Renter Population Renters Moving in State Renters Moving Out of State Small Asset Renters (5-49 units) Large Asset Renters (50+ units) Annualized Growth in Interstate Relations vs. Income, 2010-14 Across Household Income Below $100,000 $100,000 and over 0% 2% 4% 6% Small Asset Renters (5-49 units) Large Asset Renters (50+ units) Small balance multifamily loans are typically between $1 million and $5 million. Chandan Economics defines small-cap properties as 5 to 19 units, mid-cap properties as 20 to 50 units, and large-cap properties as larger than 50 units. Both small-cap and mid-cap properties can fall into the small balance spectrum. Source: American Community Survey; Chandan Economics See the full report on ALEX Chatter here: www.alexchatter.com