SlideShare a Scribd company logo
A subsidiary of Sambodhi Research & Communications Pvt. Ltd.
Sambodhi
Research & Management Institute
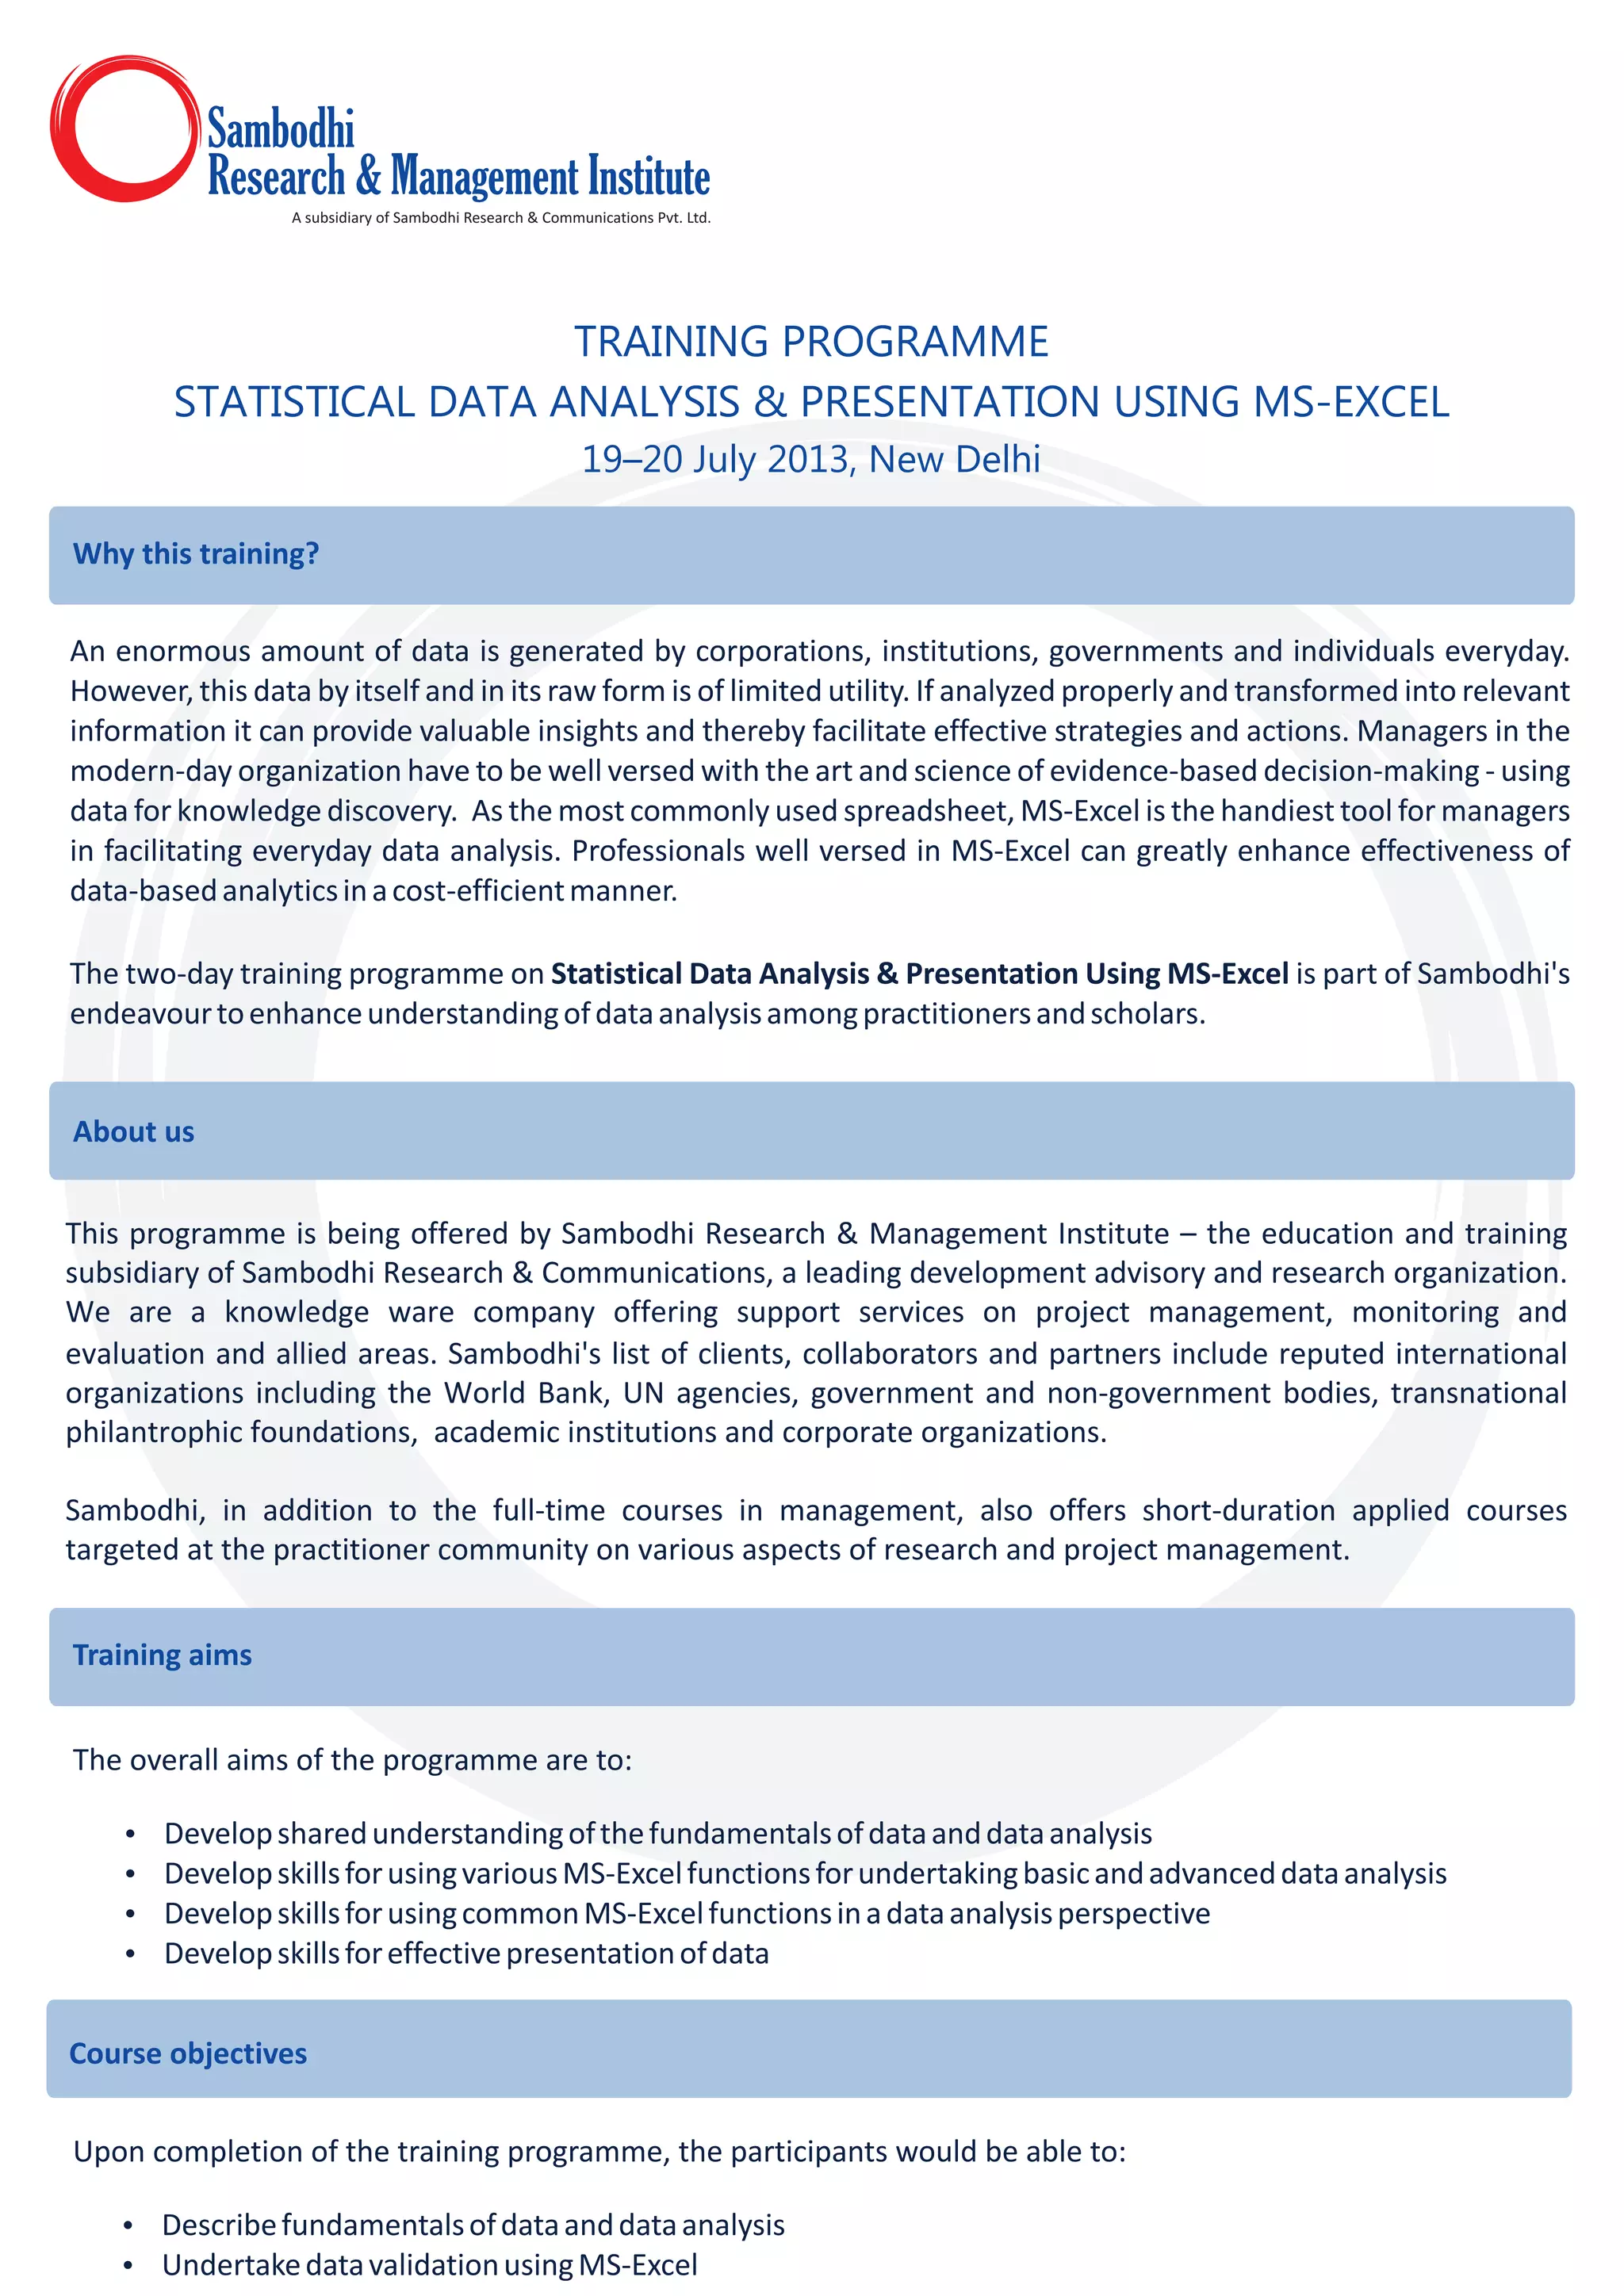
An enormous amount of data is generated by corporations, institutions, governments and individuals everyday.
However, this data by itself and in its raw form is of limited utility. If analyzed properly and transformed into relevant
information it can provide valuable insights and thereby facilitate effective strategies and actions. Managers in the
modern-day organization have to be well versed with the art and science of evidence-based decision-making - using
data for knowledge discovery. As the most commonly used spreadsheet, MS-Excel is the handiest tool for managers
in facilitating everyday data analysis. Professionals well versed in MS-Excel can greatly enhance effectiveness of
data-basedanalyticsinacost-efficientmanner.
The two-day training programme on Statistical Data Analysis & Presentation Using MS-Excel is part of Sambodhi's
endeavourtoenhanceunderstandingofdataanalysisamongpractitionersandscholars.
This programme is being offered by Sambodhi Research & Management Institute – the education and training
subsidiary of Sambodhi Research & Communications, a leading development advisory and research organization.
We are a knowledge ware company offering support services on project management, monitoring and
evaluation and allied areas. Sambodhi's list of clients, collaborators and partners include reputed international
organizations including the World Bank, UN agencies, government and non-government bodies, transnational
philantrophic foundations, academic institutions and corporate organizations.
Sambodhi, in addition to the full-time courses in management, also offers short-duration applied courses
targeted at the practitioner community on various aspects of research and project management.
The overall aims of the programme are to:
?Developsharedunderstandingofthefundamentalsofdataanddataanalysis
?DevelopskillsforusingvariousMS-Excelfunctionsforundertakingbasicandadvanceddataanalysis
?DevelopskillsforusingcommonMS-Excelfunctionsinadataanalysisperspective
?Developskillsforeffectivepresentationofdata
Why this training?
About us
Training aims
TRAINING PROGRAMME
STATISTICAL DATA ANALYSIS & PRESENTATION USING MS-EXCEL
19–20 July 2013, New Delhi
Course objectives
Upon completion of the training programme, the participants would be able to:
?Describefundamentalsofdataanddataanalysis
?UndertakedatavalidationusingMS-Excel
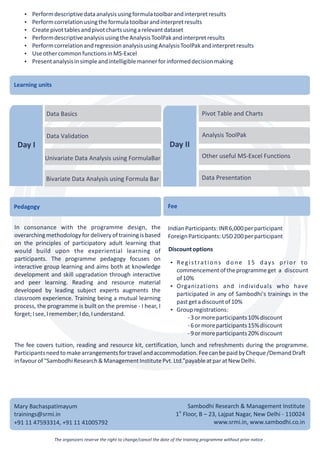
Learning units
Day I
Data Basics
Data Validation
Univariate Data Analysis using FormulaBar
Bivariate Data Analysis using Formula Bar
Day II
Pivot Table and Charts
Analysis ToolPak
Other useful MS-Excel Functions
Data Presentation
IndianParticipants:INR6,000perparticipant
ForeignParticipants:USD200perparticipant
Discountoptions
?Registrations done 15 days prior to
commencementoftheprogrammeget a discount
of10%
?Organizations and individuals who have
participated in any of Sambodhi's trainings in the
pastgetadiscountof10%
?Groupregistrations:
-3ormoreparticipants10%discount
-6ormoreparticipants15%discount
-9ormoreparticipants20%discount
Fee
Mary Bachaspatimayum
trainings@srmi.in
+91 11 47593314, +91 11 41005792
The organizers reserve the right to change/cancel the date of the training programme without prior notice .
Sambodhi Research & Management Institute
st
1 Floor, B – 23, Lajpat Nagar, New Delhi - 110024
www.srmi.in, www.sambodhi.co.in
The fee covers tuition, reading and resource kit, certification, lunch and refreshments during the programme.
Participantsneedtomakearrangementsfortravelandaccommodation.FeecanbepaidbyCheque/DemandDraft
infavourof“SambodhiResearch&ManagementInstitutePvt.Ltd.”payableatparatNewDelhi.
In consonance with the programme design, the
overarching methodology for delivery of training is based
on the principles of participatory adult learning that
would build upon the experiential learning of
participants. The programme pedagogy focuses on
interactive group learning and aims both at knowledge
development and skill upgradation through interactive
and peer learning. Reading and resource material
developed by leading subject experts augments the
classroom experience. Training being a mutual learning
process, the programme is built on the premise - I hear, I
forget;Isee,Iremember;Ido,Iunderstand.
Pedagogy
?Performdescriptivedataanalysisusingformulatoolbarandinterpretresults
?Performcorrelationusingtheformulatoolbarandinterpretresults
?Createpivottablesandpivotchartsusingarelevantdataset
?PerformdescriptiveanalysisusingtheAnalysisToolPakandinterpretresults
?PerformcorrelationandregressionanalysisusingAnalysisToolPakandinterpretresults
?UseothercommonfunctionsinMS-Excel
?Presentanalysisinsimpleandintelligiblemannerforinformeddecisionmaking

More Related Content

What's hot

Shiban SQ_Resume
Shiban SQ_ResumeShiban SQ_Resume
Shiban SQ_Resume
Shiban SQ
 
Ryan Gore Résumé
Ryan Gore RésuméRyan Gore Résumé
Ryan Gore Résumé
Ryan Gore
 

What's hot (13)

Shiban SQ_Resume
Shiban SQ_ResumeShiban SQ_Resume
Shiban SQ_Resume
 
Resume
ResumeResume
Resume
 
Data Analyst vs Data Engineer vs Data Scientist | Data Analytics Masters Prog...
Data Analyst vs Data Engineer vs Data Scientist | Data Analytics Masters Prog...Data Analyst vs Data Engineer vs Data Scientist | Data Analytics Masters Prog...
Data Analyst vs Data Engineer vs Data Scientist | Data Analytics Masters Prog...
 
Data Science Salon: Culture, Data Engineering and Hamburger Stands: Thoughts ...
Data Science Salon: Culture, Data Engineering and Hamburger Stands: Thoughts ...Data Science Salon: Culture, Data Engineering and Hamburger Stands: Thoughts ...
Data Science Salon: Culture, Data Engineering and Hamburger Stands: Thoughts ...
 
Data Science Salon: Applying Machine Learning to Modernize Business Processes
Data Science Salon: Applying Machine Learning to Modernize Business ProcessesData Science Salon: Applying Machine Learning to Modernize Business Processes
Data Science Salon: Applying Machine Learning to Modernize Business Processes
 
Resume
ResumeResume
Resume
 
Qualitative data analysis part 1-theoretical understanding
Qualitative data analysis part 1-theoretical understandingQualitative data analysis part 1-theoretical understanding
Qualitative data analysis part 1-theoretical understanding
 
Data Science And Analytics Information Part 5
Data Science And Analytics Information Part 5Data Science And Analytics Information Part 5
Data Science And Analytics Information Part 5
 
Varun_A_Dixit
Varun_A_DixitVarun_A_Dixit
Varun_A_Dixit
 
Dallas datascienceconference jasongeng-v3
Dallas datascienceconference jasongeng-v3Dallas datascienceconference jasongeng-v3
Dallas datascienceconference jasongeng-v3
 
Ryan Gore Résumé
Ryan Gore RésuméRyan Gore Résumé
Ryan Gore Résumé
 
Data science
Data science Data science
Data science
 
Sumit kumar
Sumit kumarSumit kumar
Sumit kumar
 

Similar to Ms excel training flyer 19 - 20 july

Puneet Jain - Resume
Puneet Jain - ResumePuneet Jain - Resume
Puneet Jain - Resume
Puneet Jain
 

Similar to Ms excel training flyer 19 - 20 july (20)

Power bi training institute in kerala
Power bi training institute in keralaPower bi training institute in kerala
Power bi training institute in kerala
 
Tableau training institute in kerala
Tableau training institute in keralaTableau training institute in kerala
Tableau training institute in kerala
 
Data analytics course with placement
Data analytics course with placementData analytics course with placement
Data analytics course with placement
 
Power bi training institute in kochi
Power bi training institute in kochiPower bi training institute in kochi
Power bi training institute in kochi
 
Business analytics course in kochi
Business analytics course in kochiBusiness analytics course in kochi
Business analytics course in kochi
 
Business analytics institute with placement
Business analytics institute with placementBusiness analytics institute with placement
Business analytics institute with placement
 
Data analytics institute with placement
Data analytics institute with placementData analytics institute with placement
Data analytics institute with placement
 
No 1 Data analytics institute with placement
No 1 Data analytics institute with placementNo 1 Data analytics institute with placement
No 1 Data analytics institute with placement
 
Business analytics course with placement
Business analytics course with placementBusiness analytics course with placement
Business analytics course with placement
 
Analytics courses in kochi
Analytics courses in kochiAnalytics courses in kochi
Analytics courses in kochi
 
Data analytics course in kochi
Data analytics course in kochiData analytics course in kochi
Data analytics course in kochi
 
Business analytics training in kochi
Business analytics training in kochiBusiness analytics training in kochi
Business analytics training in kochi
 
Business intelligence training in kochi
Business intelligence training in kochiBusiness intelligence training in kochi
Business intelligence training in kochi
 
Tableau training institute in kochi
Tableau training institute in kochiTableau training institute in kochi
Tableau training institute in kochi
 
No 1 Business analytics institute with placement
No 1 Business analytics institute with placementNo 1 Business analytics institute with placement
No 1 Business analytics institute with placement
 
sixthdimensionlearning.com
sixthdimensionlearning.comsixthdimensionlearning.com
sixthdimensionlearning.com
 
Puneet Jain - Resume
Puneet Jain - ResumePuneet Jain - Resume
Puneet Jain - Resume
 
edelgado 2016NU1Final
edelgado 2016NU1Finaledelgado 2016NU1Final
edelgado 2016NU1Final
 
Business analytics training
Business analytics trainingBusiness analytics training
Business analytics training
 
Data Analytics Course in Janakpuri.pptx
Data Analytics Course in Janakpuri.pptxData Analytics Course in Janakpuri.pptx
Data Analytics Course in Janakpuri.pptx
 

Ms excel training flyer 19 - 20 july

  • 1. A subsidiary of Sambodhi Research & Communications Pvt. Ltd. Sambodhi Research & Management Institute An enormous amount of data is generated by corporations, institutions, governments and individuals everyday. However, this data by itself and in its raw form is of limited utility. If analyzed properly and transformed into relevant information it can provide valuable insights and thereby facilitate effective strategies and actions. Managers in the modern-day organization have to be well versed with the art and science of evidence-based decision-making - using data for knowledge discovery. As the most commonly used spreadsheet, MS-Excel is the handiest tool for managers in facilitating everyday data analysis. Professionals well versed in MS-Excel can greatly enhance effectiveness of data-basedanalyticsinacost-efficientmanner. The two-day training programme on Statistical Data Analysis & Presentation Using MS-Excel is part of Sambodhi's endeavourtoenhanceunderstandingofdataanalysisamongpractitionersandscholars. This programme is being offered by Sambodhi Research & Management Institute – the education and training subsidiary of Sambodhi Research & Communications, a leading development advisory and research organization. We are a knowledge ware company offering support services on project management, monitoring and evaluation and allied areas. Sambodhi's list of clients, collaborators and partners include reputed international organizations including the World Bank, UN agencies, government and non-government bodies, transnational philantrophic foundations, academic institutions and corporate organizations. Sambodhi, in addition to the full-time courses in management, also offers short-duration applied courses targeted at the practitioner community on various aspects of research and project management. The overall aims of the programme are to: ?Developsharedunderstandingofthefundamentalsofdataanddataanalysis ?DevelopskillsforusingvariousMS-Excelfunctionsforundertakingbasicandadvanceddataanalysis ?DevelopskillsforusingcommonMS-Excelfunctionsinadataanalysisperspective ?Developskillsforeffectivepresentationofdata Why this training? About us Training aims TRAINING PROGRAMME STATISTICAL DATA ANALYSIS & PRESENTATION USING MS-EXCEL 19–20 July 2013, New Delhi Course objectives Upon completion of the training programme, the participants would be able to: ?Describefundamentalsofdataanddataanalysis ?UndertakedatavalidationusingMS-Excel
  • 2. Learning units Day I Data Basics Data Validation Univariate Data Analysis using FormulaBar Bivariate Data Analysis using Formula Bar Day II Pivot Table and Charts Analysis ToolPak Other useful MS-Excel Functions Data Presentation IndianParticipants:INR6,000perparticipant ForeignParticipants:USD200perparticipant Discountoptions ?Registrations done 15 days prior to commencementoftheprogrammeget a discount of10% ?Organizations and individuals who have participated in any of Sambodhi's trainings in the pastgetadiscountof10% ?Groupregistrations: -3ormoreparticipants10%discount -6ormoreparticipants15%discount -9ormoreparticipants20%discount Fee Mary Bachaspatimayum trainings@srmi.in +91 11 47593314, +91 11 41005792 The organizers reserve the right to change/cancel the date of the training programme without prior notice . Sambodhi Research & Management Institute st 1 Floor, B – 23, Lajpat Nagar, New Delhi - 110024 www.srmi.in, www.sambodhi.co.in The fee covers tuition, reading and resource kit, certification, lunch and refreshments during the programme. Participantsneedtomakearrangementsfortravelandaccommodation.FeecanbepaidbyCheque/DemandDraft infavourof“SambodhiResearch&ManagementInstitutePvt.Ltd.”payableatparatNewDelhi. In consonance with the programme design, the overarching methodology for delivery of training is based on the principles of participatory adult learning that would build upon the experiential learning of participants. The programme pedagogy focuses on interactive group learning and aims both at knowledge development and skill upgradation through interactive and peer learning. Reading and resource material developed by leading subject experts augments the classroom experience. Training being a mutual learning process, the programme is built on the premise - I hear, I forget;Isee,Iremember;Ido,Iunderstand. Pedagogy ?Performdescriptivedataanalysisusingformulatoolbarandinterpretresults ?Performcorrelationusingtheformulatoolbarandinterpretresults ?Createpivottablesandpivotchartsusingarelevantdataset ?PerformdescriptiveanalysisusingtheAnalysisToolPakandinterpretresults ?PerformcorrelationandregressionanalysisusingAnalysisToolPakandinterpretresults ?UseothercommonfunctionsinMS-Excel ?Presentanalysisinsimpleandintelligiblemannerforinformeddecisionmaking