More Related Content
Similar to Manpower Employment Outlook Survey - Q3 2013 (20)
Manpower Employment Outlook Survey - Q3 2013
- 1. 0%
4%
8%
12%
16%
-4%
Q3
2013
Q3
2012
Q3
2011
Q3
2010
Q3
2009
Q3
2008
OutlookPercentage
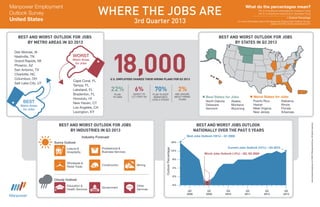
BEST AND WORST OUTLOOK FOR JOBS
BY STATES IN Q3 2013
www.manpowergroup.com©2013ManpowerGroup.Allrightsreserved.
North Dakota
Delaware
Vermont
Alaska
Montana
Wyoming
Best States for Jobs
Puerto Rico
Hawaii
West Virginia
New Jersey
Alabama
Illinois
Florida
Arkansas
Worst States for Jobs
BEST AND WORST OUTLOOK FOR JOBS
BY INDUSTRIES IN Q3 2013
Industry Forecast
Cloudy Outlook
Construction
Sunny Outlook
Wholesale &
Retail Trade
Leisure &
Hospitality
Professional &
Business Services
BEST AND WORST JOBS OUTLOOK
NATIONALLY OVER THE PAST 5 YEARS
Best Jobs Outlook (16%) – Q1 2008
Worst Jobs Outlook (-2%) – Q2, Q3 2009
Current Jobs Outlook (12%) – Q3 2013
WHERE THE JOBS ARE
3rd Quarter 2013
What do the percentages mean?
The % of employers anticipating an increase in hiring
– the % of employers expecting to decrease hiring
= Outlook Percentage
For more information about the Manpower Employment Outlook Survey,
please visit http://press.manpower.com
Manpower Employment
Outlook Survey
United States
BEST AND WORST OUTLOOK FOR JOBS
BY METRO AREAS IN Q3 2013
Des Moines, IA
Nashville, TN
Grand Rapids, MI
Phoenix, AZ
San Antonio, TX
Charlotte, NC
Columbus, OH
Salt Lake City, UT
Cape Coral, FL
Tampa, FL
Lakeland, FL
Bradenton, FL
Honolulu, HI
New Haven, CT
Los Angeles, CA
Lexington, KY
Government
Education &
Health Services
Other
Services
70%
PLAN TO KEEP
WORKFORCE
LEVELS STEADY
6%
EXPECT TO
LET STAFF GO
22%
PLAN
TO HIRE
2%
ARE UNSURE
ABOUT HIRING
PLANS
18,000U.S. EMPLOYERS SHARED THEIR HIRING PLANS FOR Q3 2013
Mining