Download to read offline

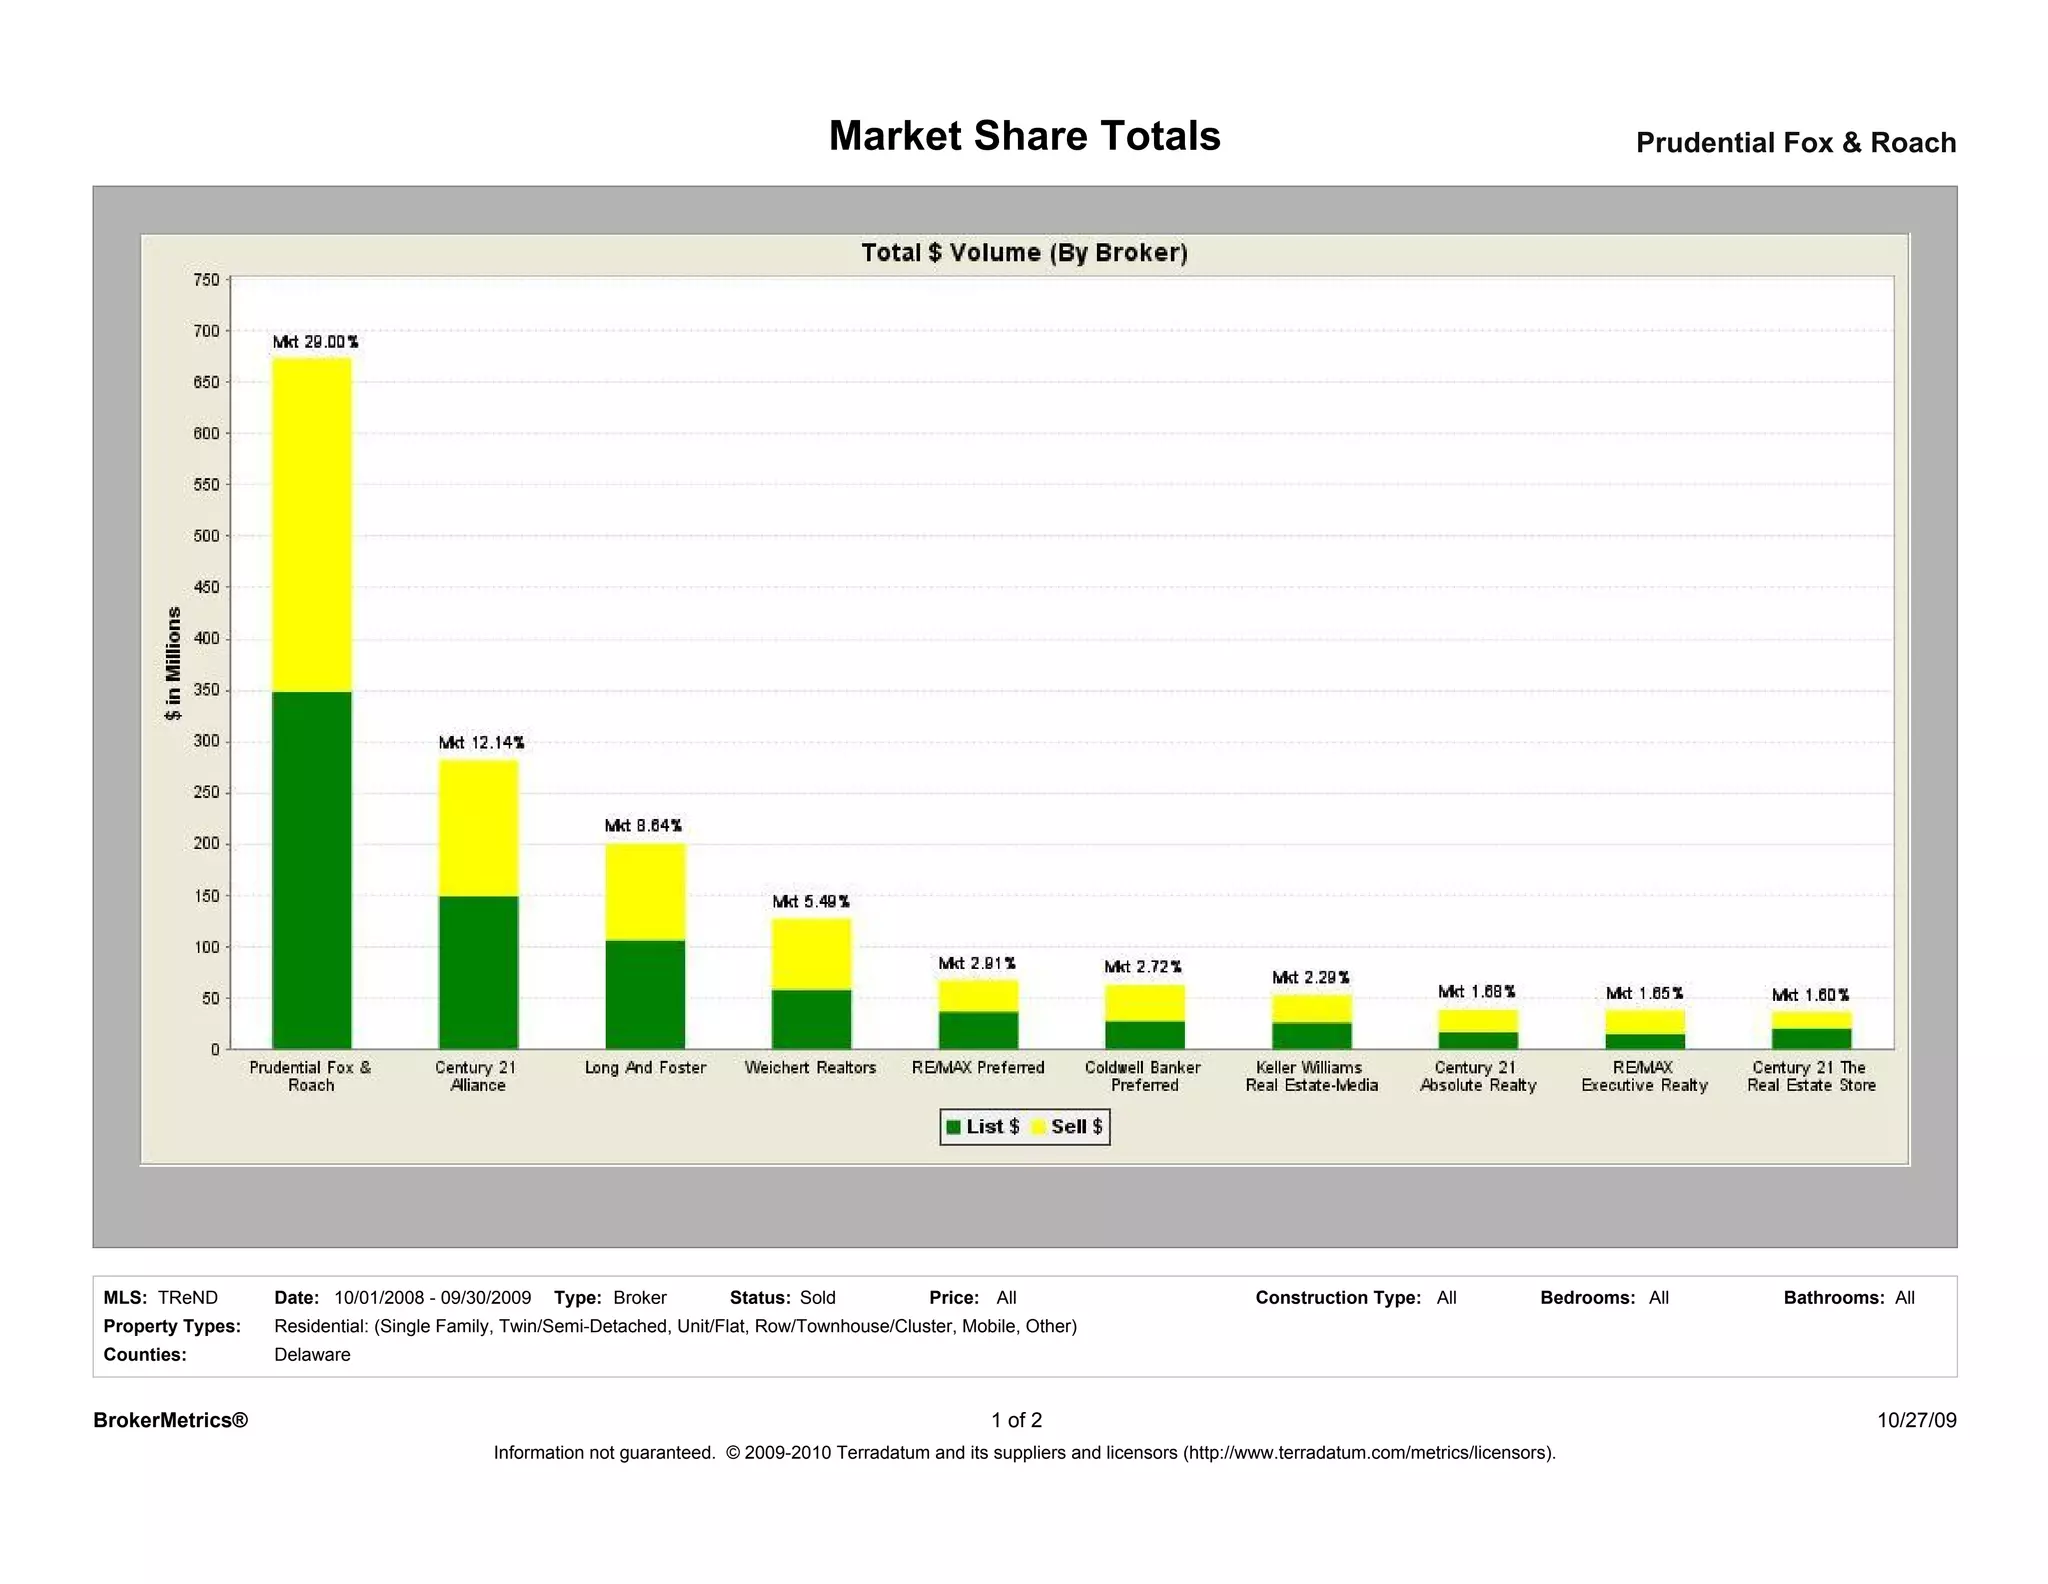
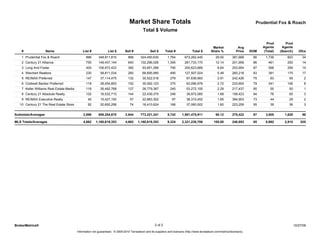

Prudential Fox & Roach had the largest market share of residential real estate sales in Delaware for the period of October 2008 to September 2009, with 29% of the total dollar volume. They listed 896 properties worth $348 million and sold 868 properties for $324 million. In total, Prudential Fox & Roach had $673 million in listed and sold property transactions, more than any other real estate broker.


